
Copd Types of bronchitis
COPD chronic obstructive pulmonary disease pathology emphysema
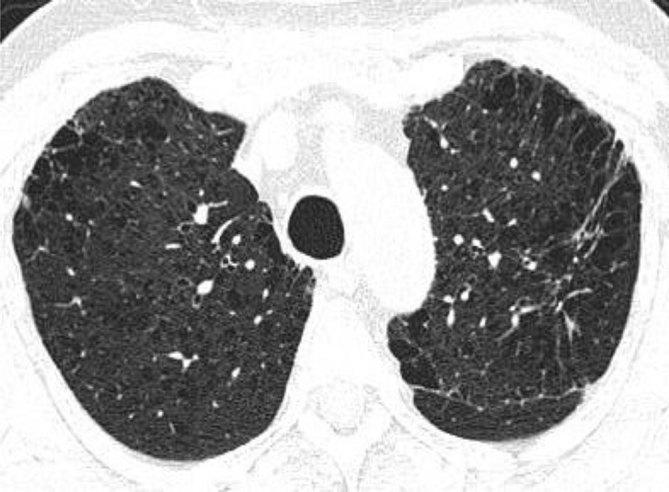
This diagnostic image is an axial non-contrast-enhanced CT scan of the chest at the level of the upper lobes, demonstrating significant chronic obstructive pulmonary disease (COPD) pathology. The lung parenchyma shows extensive centrilobular emphysema, characterized by multiple small, focal areas of low attenuation representing alveolar destruction within the secondary pulmonary lobules. Complementary paraseptal emphysematous changes are visible as subpleural lucencies along the peripheral lung margins. In the apicoposterior segment of the left upper lobe, there is a localized area of increased attenuation consistent with a fibrotic lesion or reticular opacity. The distribution is primarily bilateral and upper-lobe predominant, which is characteristic of smoking-related lung disease. Key educational concepts include the radiographic differentiation between centrilobular and paraseptal emphysema and the identification of concurrent interstitial lung changes in a patient with multi-faceted parenchymal disease.
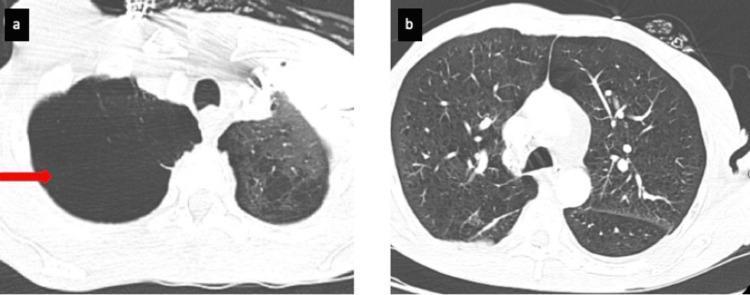
Two axial CT pulmonary angiography (CTPA) slices displayed in a lung window, illustrating chronic obstructive pulmonary disease (COPD) pathology. Image (a) shows a large, well-circumscribed, air-filled bulla in the right apical region, indicated by a red arrow. This bulla causes focal compression of the adjacent lung tissue and significant rarefaction of the vascular markings. Image (b) shows a lower thoracic section demonstrating diffuse, bilateral emphysematous changes. The lung parenchyma exhibits increased lucency, multiple small air-filled lucent spaces, and a reduction in the density and caliber of peripheral pulmonary vessels, creating a 'spongy' texture. These findings are characteristic of extensive centrilobular and paraseptal emphysema. The images provide clinical evidence of severe parenchymal destruction, contributing to decreased gas exchange and potential secondary pulmonary hypertension.
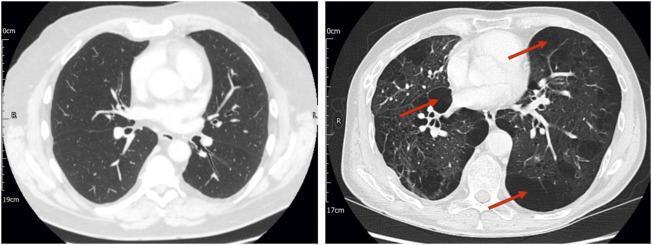
This Comparison Chart features two axial non-contrast Computed Tomography (CT) scans of the thorax at the level of the main pulmonary artery, illustrating different phenotypes of Stage 2 Chronic Obstructive Pulmonary Disease (COPD). The left panel displays a patient with relatively preserved lung parenchyma, characterized by normal attenuation and intact vascular markings without visible emphysematous destruction. The right panel demonstrates advanced structural pathology in a second patient, showcasing significant centrilobular and paraseptal emphysema. Red arrows highlight multiple pulmonary bullae, appearing as focal areas of low attenuation (increased lucency) with thin, well-defined walls, representing localized tissue destruction. A diffuse reduction in vascular density is also evident in the emphysematous lung compared to the normal scan. The educational focus is the radiological manifestation of COPD phenotypes, specifically the correlation between parenchymal destruction, anatomical deadspace volume, and lung inhomogeneity as visualized through diagnostic imaging.
chronic bronchitis mucous gland hyperplasia histology Reid index
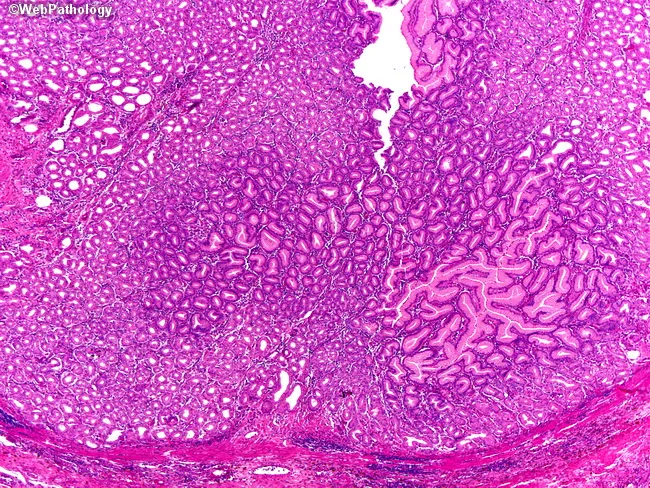
This image shows gastric body mucosa obtained by biopsy, examined under light microscopy with standard Hematoxylin and Eosin staining. The histologic hallmark is marked foveolar hyperplasia with elongated, tortuous glands and frequent cystic dilatation of mucous glands, a pattern strongly suggestive of hypertrophic gastropathy. The surface epithelium is mucin-rich, with tall, columnar foveolar cells forming crowded, branching pits; deep oxyntic glands are variably atrophic in affected foci. Lamina propria is mildly edematous and may contain modest chronic inflammatory infiltrates. The overall architecture is diffuse rather than polypoid, consistent with a non-neoplastic, hyperplastic process. No definite dysplasia is observed in this field; however, Menetrier-type hypertrophic gastritis (Menetrier disease) carries a recognized risk of gastric adenocarcinoma with time. The pattern correlates clinically with adult-onset, often severe disease characterized by diffuse thickening of the gastric folds and protein-losing enteropathy, whereas pediatric forms are typically self-limited. On this section, the combination of foveolar hyperplasia, gland tortuosity, and cystic dilation constitutes the diagnostic clue. This histology supports a diagnosis of Menetrier-type hypertrophic gastropathy and has implications for management, including monitoring for nutritional deficiency, edema, and potential neoplastic transformation, and consideration of EGFR-targeted therapies in selected patients.
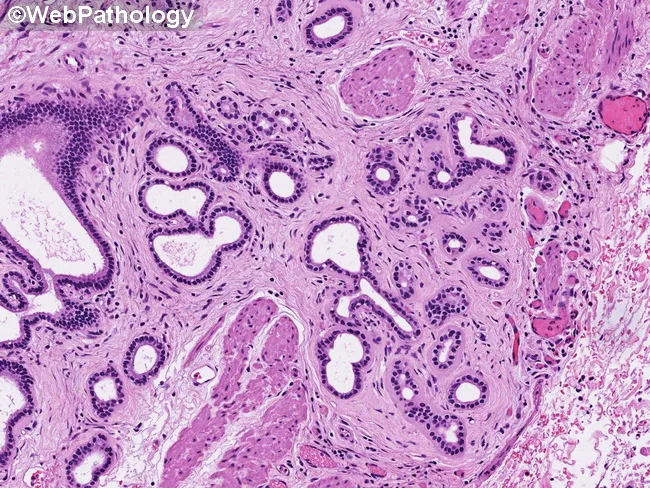
Brightfield hematoxylin and eosin (H&E) stained histology of the gallbladder neck and cystic duct region. Peribiliary mucous glands form a characteristic lobular architecture with evenly spaced, uniform tubules embedded in the fibromuscular lamina propria. The glands are lined by cuboidal to low-columnar mucinous epithelium with minimal cytologic atypia, mild cytoplasm, and rare mitotic figures. The glands lie in close proximity to the biliary epithelium but remain within the peribiliary/submucosal compartment, without evidence of stromal invasion or desmoplastic reaction. This benign pattern can be mistaken for invasive adenocarcinoma if the glands are sampled in a disorganized fashion or show crowding near the gallbladder neck. In contrast, invasive carcinoma glands are typically haphazardly scattered, infiltrative, and accompanied by cytologic atypia, desmoplasia, and irregular nuclear features. The image highlights orderly glandular lobules, uniform tubules, and lack of cytologic atypia, supporting a benign peribiliary gland process. Clinically, recognizing this pattern is essential to avoid overtreatment, especially in limited biopsy samples. Correlation with gross anatomy and imaging, and, when needed, ancillary stains or immunohistochemistry can help distinguish benign peribiliary gland hyperplasia from biliary adenocarcinoma. This distinction influences prognosis and therapeutic planning. Appropriate sampling and awareness reduce false positives in needle biopsies and guide management decisions.
COPD and Types of Bronchitis
COPD - Chronic Obstructive Pulmonary Disease
Definition
- Robbins & Kumar Basic Pathology, p. 495
Risk Factors
- Cigarette smoking - the dominant cause
- Air pollutants (sulfur dioxide, nitrogen dioxide)
- Alpha-1 antitrypsin (A1AT) deficiency (for panacinar emphysema)
COPD Subtypes
1. Emphysema
| Subtype | Location of Destruction | Cause |
|---|---|---|
| Centriacinar (centrilobular) | Central part of acinus (respiratory bronchioles); spares peripheral alveoli | Cigarette smoking (most common) |
| Panacinar (panlobular) | Entire acinus uniformly affected | A1AT deficiency; lower lobes |
| Paraseptal (distal acinar) | Peripheral/distal part of acinus near septa/pleura | Can lead to spontaneous pneumothorax |
| Irregular | Scar-related; no acinar uniformity | Post-inflammatory scarring |
- Increased chest volume (barrel chest), hyperresonance
- Dyspnea on exertion
- Relatively normal blood oxygenation at rest (called "Pink Puffer")
- Pursed-lip breathing
2. Chronic Bronchitis (as part of COPD)
- Cigarette smoke and pollutants stimulate:
- Hypertrophy of mucous glands in the trachea and large bronchi
- Goblet cell metaplasia in smaller bronchi/bronchioles
- Inflammation (macrophages, neutrophils, lymphocytes - notably NOT eosinophils)
- Mucus hypersecretion occurs in large airways
- Airflow obstruction results from small airway disease (chronic bronchiolitis) - mucus plugging, inflammation, and bronchiolar wall fibrosis
- Ratio of submucosal gland thickness to total bronchial wall thickness
- Normal: ≤ 0.4
- In chronic bronchitis: > 0.4 (gland hypertrophy increases the ratio)
- Productive cough with mucoid/mucopurulent sputum
- Hypoxemia and hypercapnia ("Blue Bloater")
- Prone to recurrent infections
- Cor pulmonale in advanced disease
COPD - Spirometry
| Parameter | Finding |
|---|---|
| FEV1 | Reduced |
| FVC | Normal or near-normal |
| FEV1/FVC ratio | < 0.70 (obstructive pattern) |
| TLC/RV | Increased (air trapping) |
COPD Mucus Pathophysiology (Advanced)
- Productive cough - from proximal airway surface metaplasia and submucosal gland expansion
- Small airway occlusion - mucus plugging correlates with degree of airflow obstruction and predicts mortality
- Fishman's Pulmonary Diseases, p. 143-144
Types of Bronchitis
1. Acute Bronchitis
- Definition: Acute, typically viral respiratory infection causing inflammation of the bronchi, presenting with cough, phlegm, hoarseness, or wheezing.
- Causative agents: Predominantly viral (RSV, rhinovirus, influenza A/B); bacterial causes less common (Chlamydia pneumoniae ~4%, Mycoplasma pneumoniae ~2.3%)
- Distinct from acute exacerbations of COPD/chronic bronchitis
- Treatment:
- Primarily supportive (self-limited in healthy individuals) - humidifiers, cough suppressants, antipyretic analgesics
- Beta-agonists: no evidence of benefit unless measurable airway obstruction
- Antibiotics: controversial; indicated if productive cough persists beyond 10-14 days, especially in smokers or those with underlying lung disease
- Antibiotic stewardship note: Routine antibiotics not recommended due to antibiotic resistance concerns; specific antibiotic choice has little impact
2. Chronic Bronchitis
- Definition (clinical): Productive cough for ≥ 3 consecutive months in ≥ 2 consecutive years
- Part of the COPD spectrum in heavy smokers
- Pathology:
- Reid index > 0.4
- Goblet cell metaplasia
- Bronchiolar wall fibrosis
- In severe cases: bronchiolitis obliterans (complete luminal obliteration by fibrosis)
- Microbial infection plays a secondary role - maintains inflammation, exacerbates symptoms (common pathogen: Haemophilus influenzae)
- A subtype called asthmatic bronchitis exists - patients with chronic bronchitis who also have airway hyperresponsiveness and intermittent wheezing
3. Eosinophilic Bronchitis
- Definition: Chronic cough with ~40% eosinophils in sputum, without asthma features
- Key distinguishing features from asthma:
- Normal lung function
- No bronchial hyperreactivity
- No variable airflow obstruction
- Chest imaging: Normal
- Sputum eosinophil levels and chemokines are often higher than in asthma, although IL-5 levels and pathologic findings are comparable
- Triggers/causes: Occupational exposures (acrylates, welding fumes, formaldehyde, isocyanates, flour), certain drugs, FIP1L1-PDGFRA fusion gene in some cases
- Treatment: Inhaled corticosteroids (responsive); CCR3 antagonists may be beneficial
- Prognosis: Generally benign; rarely evolves to irreversible airflow obstruction or asthma
Summary Table - Types of Bronchitis
| Feature | Acute Bronchitis | Chronic Bronchitis | Eosinophilic Bronchitis |
|---|---|---|---|
| Duration | Self-limited (days-weeks) | ≥ 3 months/yr x 2 yrs | Chronic |
| Cause | Viral (mainly) | Smoking, pollutants | Eosinophilic inflammation |
| Sputum | Mucoid/purulent | Persistent mucoid | High eosinophils (~40%) |
| Airflow | Usually normal | Obstructed (COPD) | Normal |
| Lung function | Normal | FEV1/FVC < 0.7 | Normal |
| Hyperreactivity | No | Possible (asthmatic subtype) | No |
| Treatment | Supportive ± antibiotics | Bronchodilators, ICS, O2 | Inhaled corticosteroids |
COPD CT Imaging
Characteristics
pink puffer blue bloater COPD emphysema chronic bronchitis comparison
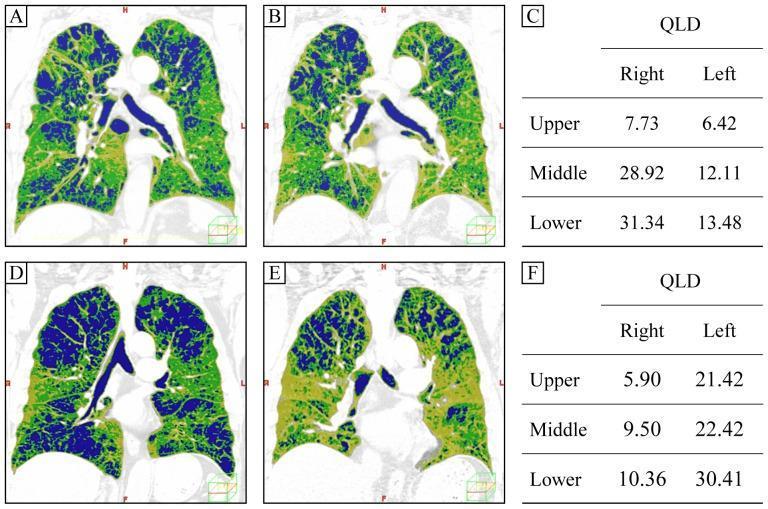
Educational comparison of Chronic Obstructive Pulmonary Disease (COPD) phenotypes using diagnostic imaging and quantitative data. Panels A-B and D-E display coronal CT scans with color-coded overlays representing lung density; blue areas indicate low-attenuation areas (LAA) characteristic of centrilobular emphysema. Case 1 (A-C) shows upper-lung-dominant emphysema during inspiration (A) and expiration (B), where lower lung volume decreases significantly more than upper volume. Case 2 (D-F) demonstrates nearly equal volume reduction in both lung zones during expiration (E). Adjacent tables (C and F) provide Quantitative Lung sound Distribution (QLD) values for upper, middle, and lower regions of the right and left lungs. The visual demonstrates the relationship between anatomical emphysema distribution (upper-lung dominant), dynamic hyperinflation (evidenced by volume changes on expiration CT), and functional lung sound intensity. This illustrates how differing mechanical properties of emphysematous lungs affect air distribution and acoustic findings, useful for differentiating COPD severity and phenotypes.
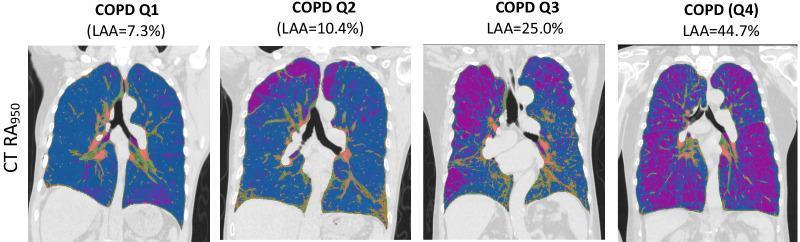
This diagnostic image series presents four coronal chest CT scans illustrating emphysema quantification in patients with varying severity of Chronic Obstructive Pulmonary Disease (COPD). The quantification is based on the RA950 metric (relative area of CT density histogram voxels < -950 HU), which identifies Low Attenuation Areas (LAA) characteristic of emphysematous tissue. A color-coded overlay is used to differentiate tissue types: healthy lung parenchyma is represented in blue, while emphysematous regions are highlighted in purple. The four panels (labeled Q1 through Q4) demonstrate a progressive increase in LAA percentage, ranging from 7.3% in early-stage disease to 44.7% in advanced emphysema. Visually, the purple areas transition from sparse focal distributions in Q1 to widespread, confluent regions in Q4, often appearing more prominent in the upper lung zones. Central mediastinal and hilar structures are visible, with some orange/red markers indicating vascular or hilar regions. This comparison chart serves as an educational tool for understanding radiological progression and automated volumetric quantification of lung destruction in COPD patients.
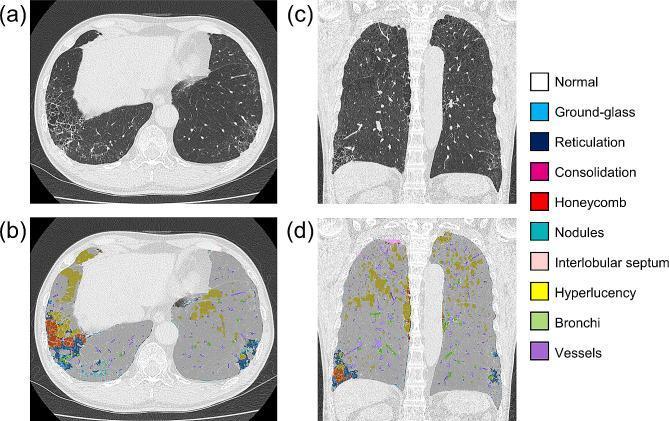
This diagnostic image set displays a comparison between standard high-resolution computed tomography (CT) and Artificial Intelligence Quantitative CT (AIQCT) in a 68-year-old male patient with Chronic Obstructive Pulmonary Disease (COPD) and Interstitial Lung Abnormalities (ILAs). The layout includes axial (a, b) and sagittal (c, d) views. Figures 2a and 2c show conventional CT imaging with visible peripheral reticulations, subpleural honeycombing, and areas of increased opacity. Figures 2b and 2d feature AIQCT overlays that provide automated segmentation and color-coded identification of pulmonary features. According to the included legend, colors represent: red for honeycombing, blue for ground-glass opacity, yellow for hyperlucency (emphysema), pink for consolidation, and dark blue for reticulation. The AIQCT visualization demonstrates a heterogeneous distribution of disease, with hyperlucency predominantly in the upper lobes and fibrotic changes (honeycombing and ground-glass opacities) localized to the lung bases. This tool illustrates the objective quantification of Interstitial Lung Disease (ILD) volume (calculated at 150 mL or 2.90% in this case) for clinical monitoring.
Characteristics of COPD and Types of Bronchitis
A. COPD - Key Characteristics
1. Symptoms
| Symptom | Detail |
|---|---|
| Dyspnea on exertion | Hallmark symptom; often present for months-years before diagnosis |
| Chronic cough | Especially in the chronic bronchitis phenotype |
| Sputum production | Mucoid or mucopurulent |
| Exacerbations | Increased dyspnea + increased cough + change in sputum character |
| Hemoptysis | Possible, particularly in chronic bronchitis; must rule out lung cancer |
| Weight loss / sarcopenia | Especially in emphysema-predominant phenotype |
2. Physical Signs
| Sign | Mechanism |
|---|---|
| Barrel chest | Chronic hyperinflation increases anteroposterior diameter |
| Pursed-lip breathing | Creates back pressure to keep small airways open |
| Accessory muscle use / tripod position | Fixes shoulder girdle to augment respiratory muscle leverage |
| Hoover sign | Paradoxical inward movement of lower rib cage on inspiration - from flattened diaphragm |
| Hyperresonance on percussion | Air trapping / overinflation |
| Decreased breath sounds | Emphysema (loss of alveolar walls) |
| Rhonchi / wheezing | Airway disease component |
| Cyanosis | Hypoxemia in advanced disease |
| Elevated JVP, peripheral edema | Cor pulmonale / right heart failure |
| Absent clubbing | Clubbing is NOT a feature of COPD; its presence prompts investigation for lung cancer or fibrosis |
3. Spirometry / Lung Function
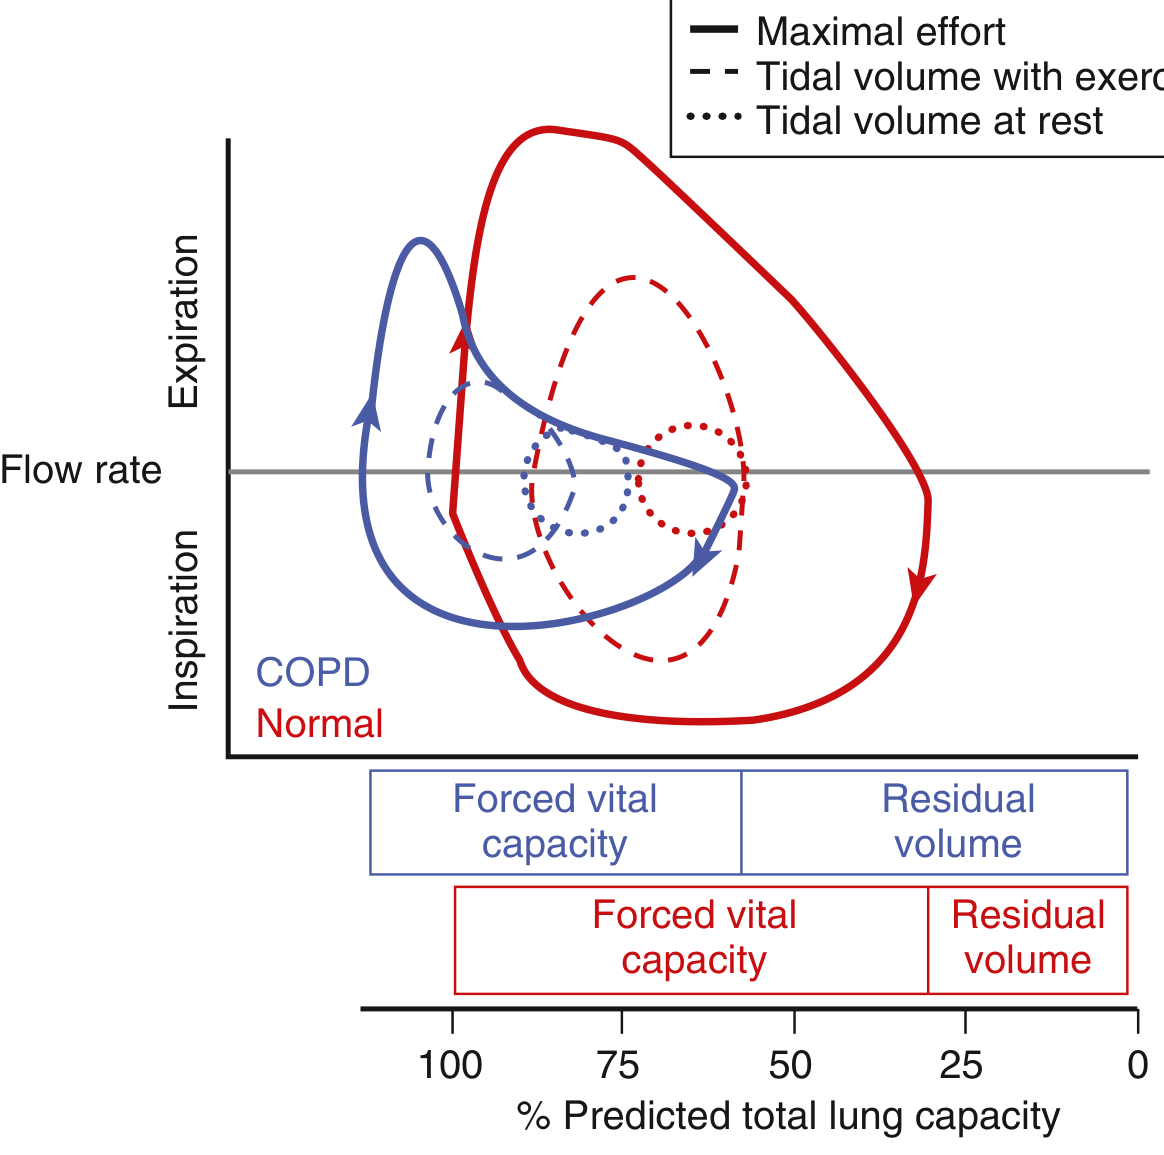
| Parameter | COPD |
|---|---|
| FEV1/FVC | < 0.70 (diagnostic criterion) |
| FEV1 | Reduced |
| FVC | Normal or mildly reduced |
| TLC | Elevated (hyperinflation) |
| RV | Elevated (air trapping) |
| DLCO | Reduced in emphysema (loss of capillary bed) |
4. The Two Classic Phenotypes
| Feature | "Pink Puffer" (Emphysema-dominant) | "Blue Bloater" (Chronic bronchitis-dominant) |
|---|---|---|
| Body habitus | Thin, cachexic | Obese or overweight |
| Color | Pink (relatively preserved O2) | Cyanotic (blue) |
| Cough | Minimal | Prominent, productive |
| Dyspnea | Severe | Moderate |
| ABG | Near-normal PaO2, normal/low PaCO2 | Low PaO2, elevated PaCO2 |
| Cor pulmonale | Late / absent | Common |
| Chest | Barrel-shaped, hyperinflated | Less hyperinflation |
| Breath sounds | Markedly diminished | Rhonchi, wheezing |
| Sputum | Minimal | Copious |
Note: Most patients fall somewhere on a spectrum between these two extremes, and mixed features are common.
5. Complications
- Cor pulmonale - pulmonary hypertension from chronic hypoxia causes right heart failure
- Polycythemia - compensatory response to chronic hypoxia
- Respiratory failure - type I (hypoxemic) or type II (hypercapnic)
- Pneumothorax - especially with bullous emphysema (ruptured bullae)
- Secondary infections - Haemophilus influenzae is a frequent colonizer
- Atrial fibrillation and other arrhythmias - systemic manifestation
- Depression - frequent comorbidity
- Lung cancer - ~2-fold increased risk vs. smokers without COPD
6. Imaging Characteristics
| Modality | Findings |
|---|---|
| CXR | Flattened diaphragm, increased retrosternal airspace, decreased parenchymal markings, bullae |
| CT chest | Centrilobular or panacinar emphysema; bullae; airway wall thickening in chronic bronchitis; mucus plugging |
B. Characteristics of Each Type of Bronchitis
1. Acute Bronchitis
| Characteristic | Detail |
|---|---|
| Definition | Acute cough (dry or productive) > 5 days, without pneumonia or asthma |
| Epidemiology | 9th most common ED diagnosis in USA; top 10 outpatient worldwide |
| Duration | Cough lasts 10-20 days; self-limited |
| Cause | Viral (influenza A/B, RSV, parainfluenza, coronavirus, adenovirus, rhinovirus); bacteria in 6-15.5% (H. influenzae, S. pneumoniae, Mycoplasma, Bordetella pertussis, Chlamydia) |
| Symptoms | Fever, mild dyspnea, cough ± sputum |
| Sputum color | Yellow/green sputum does NOT reliably indicate bacterial infection |
| Lung function | Reversible decrease in FEV1 possible (bronchial hyperresponsiveness) |
| Diagnosis | Clinical - no routine CXR unless pneumonia suspected |
| Treatment | Supportive (self-limited); antibiotics only if cough > 10-14 days in at-risk patients |
2. Chronic Bronchitis
| Characteristic | Detail |
|---|---|
| Definition | Persistent productive cough ≥ 3 months/year for ≥ 2 consecutive years |
| Basis | Clinical (not anatomical) |
| Pathology | Mucous gland hypertrophy (Reid index > 0.4), goblet cell metaplasia, inflammation, small airway fibrosis |
| Key inflammatory cells | Macrophages, neutrophils, lymphocytes - NOT eosinophils |
| Obstruction site | Large airways (mucus hypersecretion); small airways (inflammation/fibrosis = obstruction) |
| ABG | Hypoxemia + hypercapnia |
| Subtypes | Asthmatic bronchitis (with airway hyperresponsiveness + wheezing); severe cases --> bronchiolitis obliterans |
| Microbiology | Haemophilus influenzae common secondary colonizer |
| Mucin types | MUC5AC and MUC5B elevated in secretions |
3. Eosinophilic Bronchitis
| Characteristic | Detail |
|---|---|
| Hallmark | Chronic cough + sputum eosinophilia (~40%) |
| Lung function | Normal |
| Bronchial hyperreactivity | Absent (key distinction from asthma) |
| Chest imaging | Normal |
| Sputum eosinophils | Higher than in asthma |
| IL-5 in sputum | Comparable to asthma |
| Causes | Occupational (isocyanates, acrylates, flour, welding fumes), drugs, FIP1L1-PDGFRA fusion gene |
| Bronchoscopy | May show diffuse tracheobronchial mucosal nodules |
| Treatment | Inhaled corticosteroids (responsive); CCR3 antagonists |
| Prognosis | Generally benign; rarely progresses to airflow obstruction or asthma |
Quick Comparison Summary
| Feature | Acute Bronchitis | Chronic Bronchitis | Eosinophilic Bronchitis |
|---|---|---|---|
| Onset | Acute | Chronic | Chronic |
| Cough | > 5 days, self-limited | Productive, ≥ 3 months | Chronic, dry or productive |
| Sputum eosinophils | No | No | Yes (~40%) |
| Airflow obstruction | Transient/mild | Present (COPD) | Absent |
| Bronchial hyperreactivity | Mild, transient | Possible | Absent |
| Treatment | Supportive | Bronchodilators, ICS | ICS |
| Prognosis | Self-limited | Progressive | Benign (usually) |