
Inhibitors of ETC with different complexes
electron transport chain inhibitors complexes I II III IV diagram
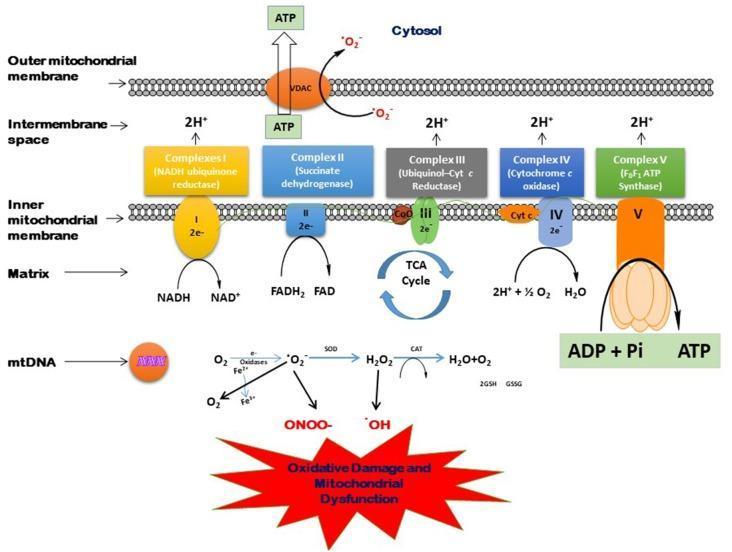
This pathophysiology diagram illustrates mitochondrial bioenergetics, specifically the electron transport chain (ETC), ATP synthesis, and the generation of reactive oxygen/nitrogen species (ROS/RNS). The upper portion details the inner mitochondrial membrane containing Complexes I through V. Complex I (NADH ubiquinone reductase) and Complex II (Succinate dehydrogenase) receive electrons from NADH and FADH2, respectively. Electrons flow through ubiquinone (CoQ) and cytochrome c (Cyt c) to Complex IV (Cytochrome c oxidase), which reduces O2 to H2O. Complexes I, III, and IV pump protons (H+) into the intermembrane space, creating a gradient that drives Complex V (F0F1 ATP Synthase) to convert ADP + Pi into ATP. ATP then exits to the cytosol via the VDAC channel. The lower section depicts oxidative stress pathways: O2 is converted to superoxide (•O2-) by oxidases or mitochondrial leakage. Superoxide is neutralized by Superoxide Dismutase (SOD) into H2O2, which Catalase (CAT) or the GSH/GSSG cycle converts to water. Alternatively, superoxide reacts with NO to form peroxynitrite (ONOO-) or leads to hydroxyl radicals (•OH), resulting in oxidative damage, mtDNA mutations, and mitochondrial dysfunction.
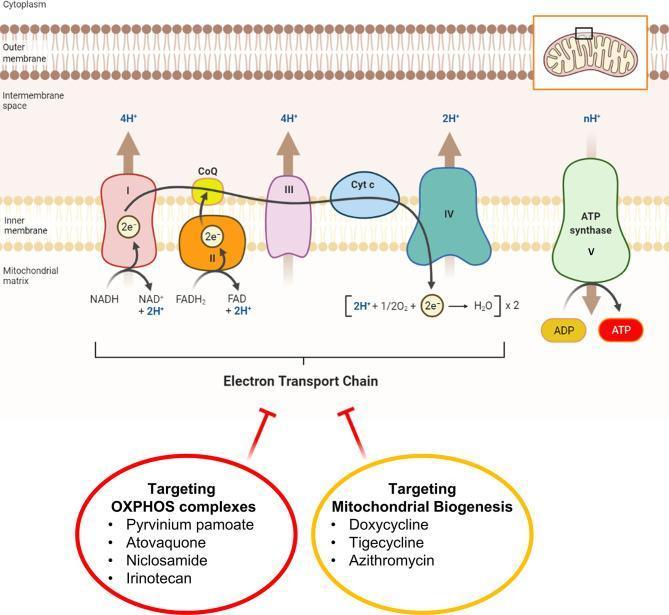
A pathophysiology diagram illustrating the mitochondrial oxidative phosphorylation (OXPHOS) system and its therapeutic inhibitors. The top schematic shows the inner mitochondrial membrane containing the Electron Transport Chain (ETC) complexes I through IV, Coenzyme Q (CoQ), and Cytochrome c (Cyt c), alongside ATP synthase (Complex V). It depicts the flow of electrons (2e-) from NADH and FADH2, the pumping of protons (H+) into the intermembrane space, and the final reduction of oxygen to water. Complex V is shown utilizing the proton gradient to convert ADP to ATP. The lower section identifies two pharmacological strategies for ATP depletion in cancer cells: 'Targeting OXPHOS complexes' using drugs like Pyrvinium pamoate, Atovaquone, Niclosamide, and Irinotecan; and 'Targeting Mitochondrial Biogenesis' using antibiotics such as Doxycycline, Tigecycline, and Azithromycin. Inhibitory arrows indicate these drugs disrupt mitochondrial function to target cancer stem cells (CSCs).
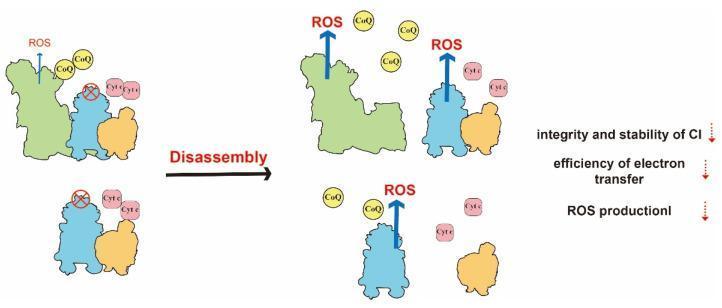
A pathophysiology diagram illustrating the mitochondrial respiratory chain dysfunction resulting from the disassembly of supercomplexes (SCs). The visual compares two states: an organized supercomplex and a disassembled state. On the left, Complex I (CI, green), Complex III (CIII, blue), and Complex IV (CIV, orange) are closely associated in a functional supercomplex, with Coenzyme Q (CoQ) and Cytochrome c (Cyt c) in close proximity to facilitate efficient electron transfer. A red 'X' on CIII signifies a defect. Following a 'Disassembly' arrow, the right side depicts the complexes separated. This structural breakdown leads to a longer diffusion distance for CoQ and Cyt c, represented by their wider dispersion. The educational focus is on the consequences of SC disassembly: increased production of Reactive Oxygen Species (ROS), indicated by larger blue arrows; decreased efficiency of electron transfer; and reduced integrity and stability of Complex I. Text annotations explicitly list these three deleterious physiological effects, emphasizing the role of SCs in maintaining efficient oxidative phosphorylation and cellular energy metabolism.
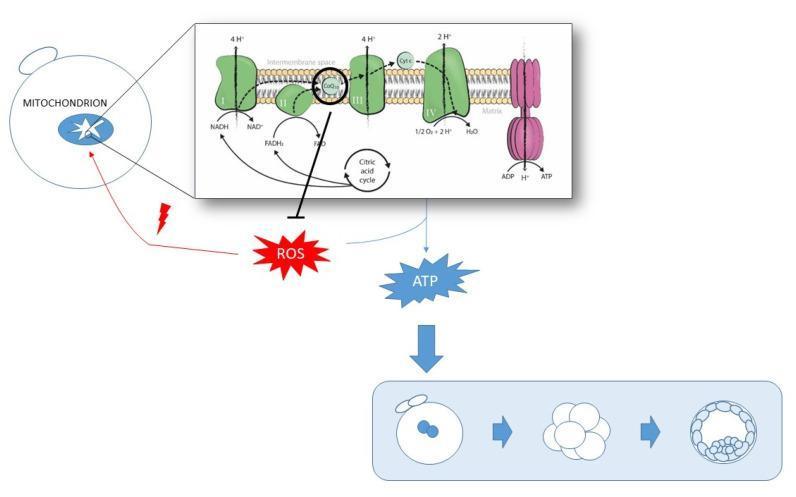
This pathophysiology diagram illustrates the role of mitochondrial function and Coenzyme Q10 (CoQ10) in oocyte development and quality. The visual is divided into a macro-scale pathway and a magnified biochemical view of the inner mitochondrial membrane. The magnified section details the Electron Transport Chain (ETC), showing Complexes I, II, III, and IV, alongside CoQ10 and Cytochrome c. It depicts the conversion of NADH to NAD+ and FADH2 to FAD, the pumping of protons (H+) into the intermembrane space, and the reduction of oxygen to water at Complex IV. ATP synthase is shown utilizing the proton gradient to produce ATP from ADP. The larger diagram links these processes to oocyte health: the production of ATP is depicted as a positive driver for embryonic progression from a zygote to a blastocyst. Conversely, the diagram shows Reactive Oxygen Species (ROS) as a byproduct of the Citric Acid Cycle that causes oxidative damage (indicated by a lightning bolt). CoQ10 is highlighted as a critical regulatory component that both facilitates the ETC and inhibits ROS production, thereby promoting optimal oocyte maturity and developmental potential.
Inhibitors of the Electron Transport Chain (ETC)
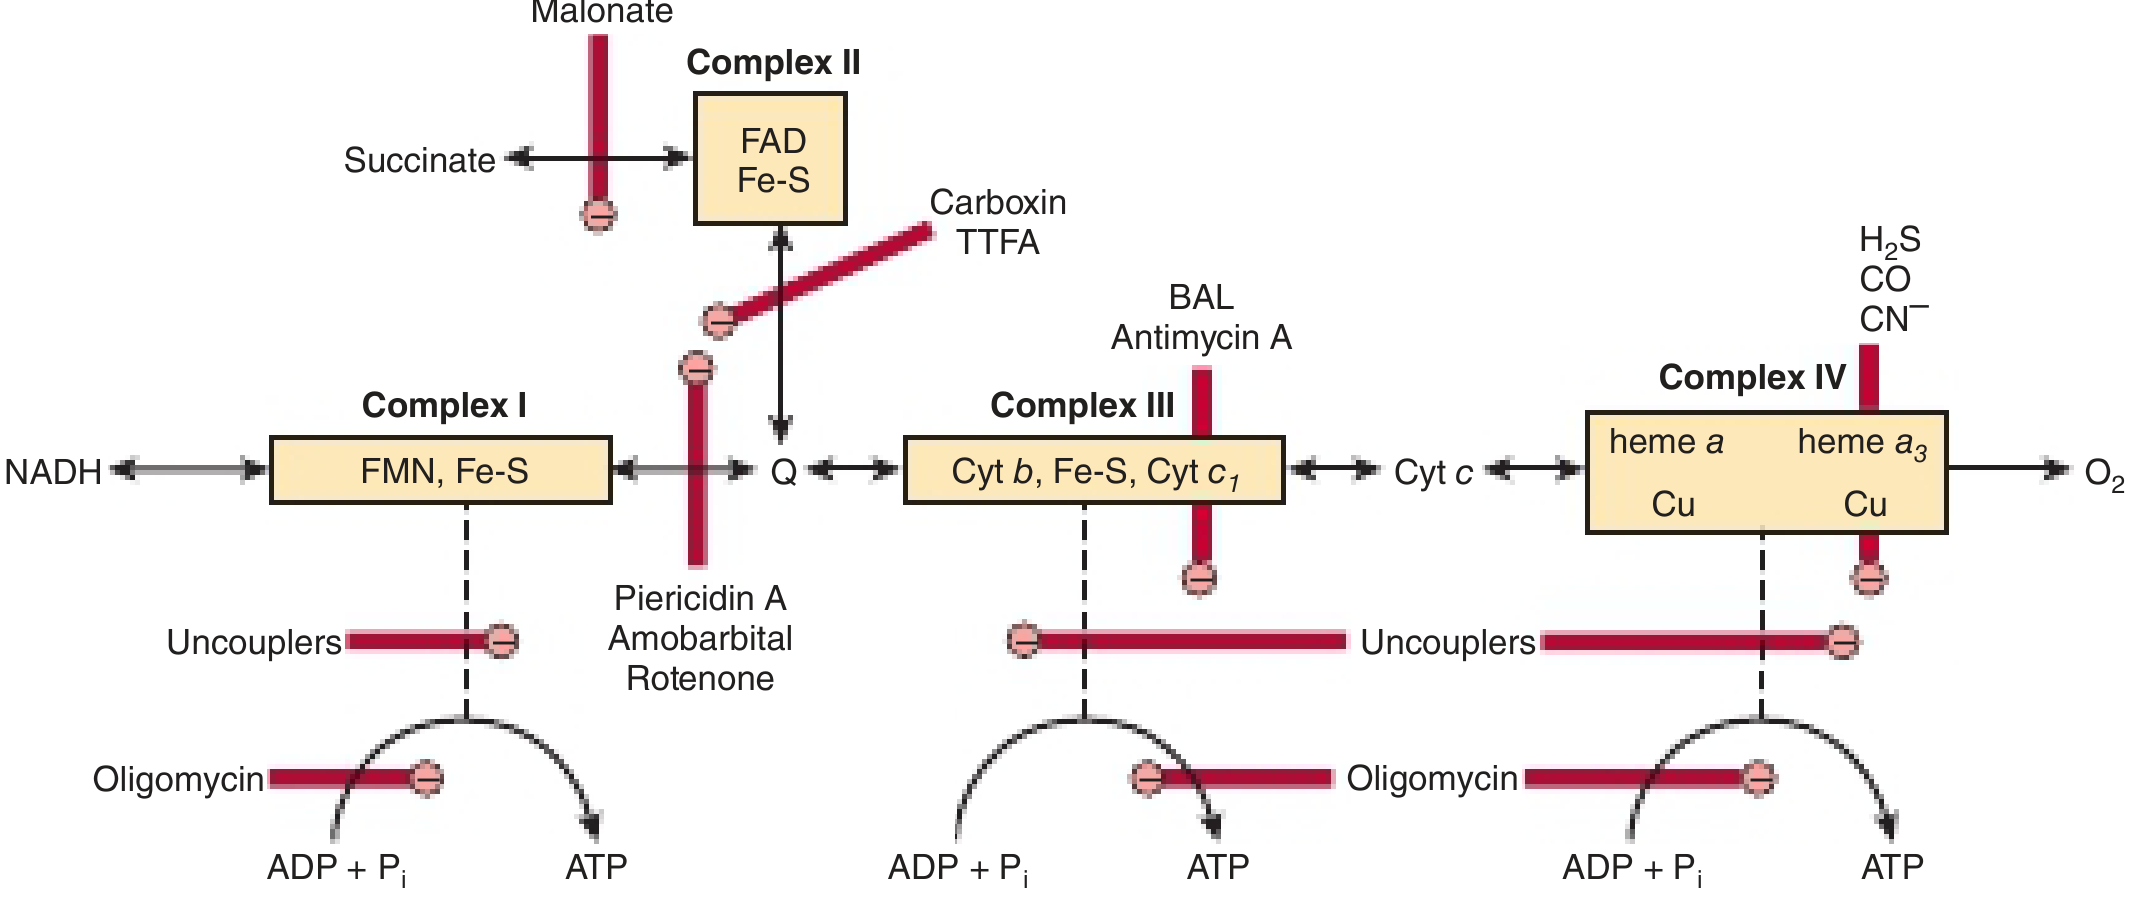
Complex I - NADH:Ubiquinone Oxidoreductase
| Inhibitor | Mechanism |
|---|---|
| Rotenone | Blocks electron transfer from Fe-S to CoQ (ubiquinone); used as a fish poison and insecticide |
| Amobarbital (Amytal) | Barbiturate; blocks transfer from Fe-S to CoQ; fatal at high doses |
| Piericidin A | Structural analog of CoQ; competes at the CoQ binding site |
| Metformin | Mild, clinically used Complex I inhibitor (antidiabetic mechanism) |
| MPP+ (active metabolite of MPTP) | Neurotoxin; selectively destroys dopaminergic neurons via Complex I inhibition (Parkinson model) |
Key effect: NADH accumulates, no proton pumping at Complex I, no ATP synthesis from this step.
Complex II - Succinate:Ubiquinone Oxidoreductase (Succinate Dehydrogenase)
| Inhibitor | Mechanism |
|---|---|
| Malonate | Competitive inhibitor of succinate dehydrogenase (structural analog of succinate) |
| Carboxin | Inhibits electron transfer from FAD/Fe-S to CoQ |
| TTFA (thenoyltrifluoroacetone) | Fe-chelating agent; blocks at the Fe-S center of Complex II |
Note: Complex II does NOT pump protons, so its inhibition has a smaller energetic impact than Complexes I, III, or IV.
Complex III - Cytochrome bc1 Complex (Ubiquinol:Cytochrome c Oxidoreductase)
| Inhibitor | Mechanism |
|---|---|
| Antimycin A | Binds the Qi site of Cyt b; blocks electron transfer from QH2 to cytochrome c |
| BAL (Dimercaprol / British Anti-Lewisite) | Inhibits at Complex III (also used as antidote for heavy metal poisoning) |
| Stigmatellin | Blocks the Qo site of Cyt b |
| Myxothiazol | Also blocks the Qo site |
Key effect: Blocks the Q-cycle; no proton pumping at Complex III; cytochrome c cannot be re-reduced.
Complex IV - Cytochrome c Oxidase
| Inhibitor | Mechanism |
|---|---|
| Cyanide (CN-) | Binds Fe3+ of heme a3 and cytochrome a; irreversibly blocks O2 reduction |
| Carbon monoxide (CO) | Binds Fe2+ of heme a3 (reduced form); blocks O2 binding - like anoxia |
| Hydrogen sulfide (H2S) | Inhibits cytochrome c oxidase; competitive with O2 |
| Azide (N3-) | Binds heme iron of Complex IV; blocks electron transfer to O2 |
| Nitric oxide (NO) | Competes reversibly with O2 at the binuclear center |
Key effect: All these agents mimic anoxia - all proton pumping (Complexes I, III, IV) ceases because CoQ backs up with electrons that cannot be passed forward.
Complex V - ATP Synthase (F0F1-ATPase)
| Inhibitor | Mechanism |
|---|---|
| Oligomycin | Blocks the F0 proton channel (c-ring); prevents proton flow and ATP synthesis |
| Dicyclohexylcarbodiimide (DCCD) | Reacts with Asp/Glu residue in F0; blocks proton translocation |
Uncouplers (Dissociate ETC from ATP Synthesis)
| Agent | Type |
|---|---|
| 2,4-Dinitrophenol (DNP) | Protonophore; shuttles H+ across inner mitochondrial membrane |
| FCCP (carbonyl cyanide-4-(trifluoromethoxy)phenylhydrazone) | Powerful protonophore; used experimentally |
| Thermogenin / UCP1 | Physiologic uncoupler in brown adipose tissue; generates body heat (non-shivering thermogenesis) |
| Valinomycin | K+ ionophore; dissipates membrane potential |
Other Inhibitors of OXPHOS Machinery
| Agent | Target | Effect |
|---|---|---|
| Atractyloside | Adenine nucleotide translocase (ANT) | Blocks ADP import into and ATP export out of the mitochondria |
| Bongkrekic acid | ANT | Similar to atractyloside |
| Nitroprusside (prolonged use) | Releases cyanide on breakdown | Inhibits Complex IV secondarily |
Summary Table
| Complex | Normal Substrates | Key Inhibitors |
|---|---|---|
| I | NADH → CoQ | Rotenone, Amytal/Amobarbital, Piericidin A, MPTP/MPP+ |
| II | FADH2 → CoQ | Malonate, Carboxin, TTFA |
| III | QH2 → Cyt c | Antimycin A, BAL (Dimercaprol) |
| IV | Cyt c → O2 | Cyanide, CO, H2S, Azide |
| V | ADP + Pi → ATP | Oligomycin |
| ANT | ADP/ATP exchange | Atractyloside, Bongkrekic acid |
| Uncouplers | Proton gradient | DNP, FCCP, Thermogenin (UCP1) |
Uncoplerrs of ETac
uncouplers electron transport chain proton gradient dinitrophenol mechanism diagram
A pathophysiology diagram illustrating the mitochondrial oxidative phosphorylation (OXPHOS) system and its therapeutic inhibitors. The top schematic shows the inner mitochondrial membrane containing the Electron Transport Chain (ETC) complexes I through IV, Coenzyme Q (CoQ), and Cytochrome c (Cyt c), alongside ATP synthase (Complex V). It depicts the flow of electrons (2e-) from NADH and FADH2, the pumping of protons (H+) into the intermembrane space, and the final reduction of oxygen to water. Complex V is shown utilizing the proton gradient to convert ADP to ATP. The lower section identifies two pharmacological strategies for ATP depletion in cancer cells: 'Targeting OXPHOS complexes' using drugs like Pyrvinium pamoate, Atovaquone, Niclosamide, and Irinotecan; and 'Targeting Mitochondrial Biogenesis' using antibiotics such as Doxycycline, Tigecycline, and Azithromycin. Inhibitory arrows indicate these drugs disrupt mitochondrial function to target cancer stem cells (CSCs).
This pathophysiology diagram illustrates the role of mitochondrial function and Coenzyme Q10 (CoQ10) in oocyte development and quality. The visual is divided into a macro-scale pathway and a magnified biochemical view of the inner mitochondrial membrane. The magnified section details the Electron Transport Chain (ETC), showing Complexes I, II, III, and IV, alongside CoQ10 and Cytochrome c. It depicts the conversion of NADH to NAD+ and FADH2 to FAD, the pumping of protons (H+) into the intermembrane space, and the reduction of oxygen to water at Complex IV. ATP synthase is shown utilizing the proton gradient to produce ATP from ADP. The larger diagram links these processes to oocyte health: the production of ATP is depicted as a positive driver for embryonic progression from a zygote to a blastocyst. Conversely, the diagram shows Reactive Oxygen Species (ROS) as a byproduct of the Citric Acid Cycle that causes oxidative damage (indicated by a lightning bolt). CoQ10 is highlighted as a critical regulatory component that both facilitates the ETC and inhibits ROS production, thereby promoting optimal oocyte maturity and developmental potential.
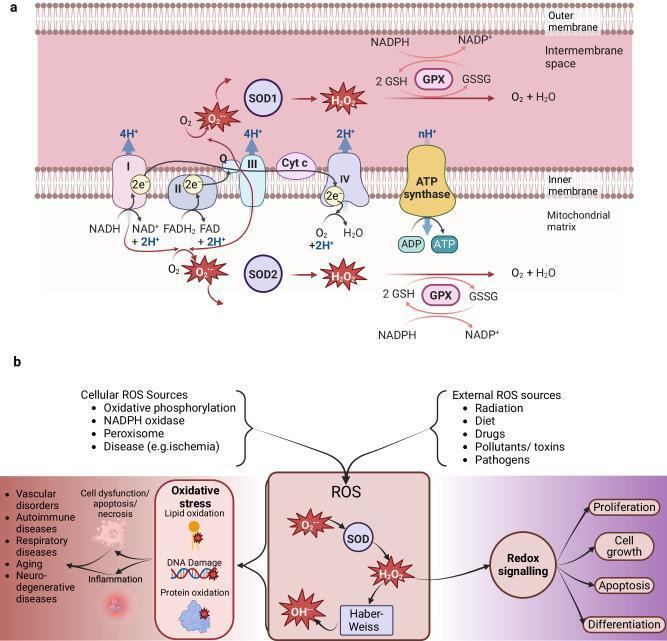
A two-part medical illustration depicting mitochondrial oxidative phosphorylation and the broader landscape of reactive oxygen species (ROS) biology. Section (a) shows the electron transport chain (ETC) within the inner mitochondrial membrane, detailing complexes I-IV, ubiquinone (Q), and cytochrome c. It illustrates electron flow from NADH/FADH2 leading to proton pumping into the intermembrane space and ATP synthesis via ATP synthase. The diagram highlights 'leaky' electrons from complexes I and III reacting with O2 to form superoxide (O2•-), which is subsequently neutralized by superoxide dismutase (SOD) and glutathione peroxidase (GPX). Section (b) outlines cellular and external ROS sources, including NADPH oxidase, peroxisomes, radiation, and pathogens. It demonstrates the dual nature of ROS: contributing to pathological oxidative stress (DNA damage, lipid oxidation, protein oxidation) leading to diseases like vascular disorders and neurodegeneration, while simultaneously acting as essential mediators in physiological redox signaling for cell growth, proliferation, apoptosis, and differentiation.
Uncouplers of the ETC (Electron Transport Chain)
What is "Uncoupling"?
Key Features of Uncoupling
| Parameter | Normal State | With Uncoupler |
|---|---|---|
| O2 consumption | Controlled by ADP | Increases markedly (uncontrolled) |
| ATP synthesis | Normal | Severely decreased |
| Proton gradient | High | Dissipated |
| Heat production | Minimal | Greatly increased |
| Respiration rate | Limited by ADP | No longer ADP-limited |
Uncouplers - Full List
1. 2,4-Dinitrophenol (DNP) - Prototype Pharmacological Uncoupler
- Mechanism: DNP is a lipid-soluble weak acid (protonophore). It is amphipathic - it can accept H+ on the acidic (intermembrane) side of the inner mitochondrial membrane, diffuse through the membrane in the protonated form (DNPH), release the proton on the matrix side, then return as the anionic form (DNP-). This continuously short-circuits the proton gradient.
- Effect: Oxidation proceeds without phosphorylation; energy released entirely as heat.
- History: Was used as a weight-loss agent in the 1930s. Reports of fatal overdoses (hyperthermia, tachycardia, diaphoresis) led to its discontinuation in 1939.
- Toxicity: Hyperthermia (fever), profuse sweating, tachycardia, cataracts (with chronic use), and death at high doses.
2. FCCP (Carbonyl Cyanide-4-(trifluoromethoxy)phenylhydrazone)
- Powerful synthetic protonophore used experimentally (more potent than DNP).
- Mechanism identical to DNP - shuttles protons across the inner mitochondrial membrane.
- Used in Seahorse assay (mitochondrial respiration experiments) to measure maximal respiratory capacity.
3. CCCP (Carbonyl Cyanide m-Chlorophenylhydrazone)
- Another potent synthetic protonophore; used experimentally.
- Same mechanism as DNP and FCCP.
4. Thermogenin / UCP1 (Uncoupling Protein 1) - Physiologic Uncoupler
- Location: Inner mitochondrial membrane of brown adipose tissue (BAT).
- Mechanism: UCP1 is a 33-kDa transmembrane protein. In the presence of free fatty acids, it forms a proton channel that allows H+ to flow from the intermembrane space back into the matrix, bypassing ATP synthase. Energy dissipates as heat.
- Regulation:
- Activated by: free fatty acids, norepinephrine (via β3 adrenergic receptors), cold exposure, T3 (thyroid hormone)
- Inhibited by: purine nucleotides (ATP, ADP, GTP, GDP)
- Physiological role:
- Non-shivering thermogenesis - major source of body heat in newborns and hibernating animals
- BAT is most abundant at birth (relative to body weight) when thermogenesis is most needed
- Cold weather increases BAT mass; lean adults have more active BAT
- Brown adipocytes differentiate from Myf5+ mesenchymal stem cells under PRDM16/PGC-1α transcription factors
5. UCP2 and UCP3
- UCP2: Widely distributed (many tissues); regulates ROS production and may play a role in insulin secretion.
- UCP3: Found mainly in skeletal muscle; role in fatty acid oxidation and thermogenesis.
6. Valinomycin
- A K+ ionophore (not a protonophore per se).
- Carries K+ across the inner mitochondrial membrane, collapsing the electrical component (membrane potential, ΔΨ) of the proton motive force.
- This partially uncouples the ETC because the driving force for ATP synthesis is reduced.
7. Long-Chain Free Fatty Acids
- At high concentrations, function as endogenous mild uncouplers - they are amphipathic and can carry protons across the membrane, or activate UCPs.
- This is relevant in lipotoxicity states.
8. Aspirin (Salicylate) - at High/Toxic Doses
- At toxic doses, salicylate acts as an uncoupler.
- This partly explains the hyperthermia seen in salicylate overdose (Reye syndrome-like picture).
- Also inhibits the TCA cycle at high concentrations.
Comparison: Uncouplers vs. ETC Inhibitors vs. ATP Synthase Inhibitors
| Property | ETC Inhibitor (e.g., Cyanide) | Uncoupler (e.g., DNP) | ATP Synthase Inhibitor (e.g., Oligomycin) |
|---|---|---|---|
| Electron flow | Stopped | Continues/increased | Stopped (backs up) |
| O2 consumption | Decreases | Increases | Decreases |
| Proton gradient | Builds up (no consumption) | Dissipated | Builds up (no consumption) |
| ATP synthesis | Stopped | Stopped (no gradient) | Stopped |
| Heat production | Low | High | Low |
Clinical Relevance
- DNP toxicity: Presents with severe hyperthermia, profuse sweating, tachycardia, and can be fatal. No specific antidote - treatment is supportive (cooling, fluids).
- Neonatal thermogenesis: Newborns cannot shiver effectively; UCP1 in BAT is the primary thermogenic mechanism.
- Hibernation: Brown fat UCPs are upregulated during hibernation for rewarming.
- Obesity pharmacology: UCPs and BAT activation are active research targets for anti-obesity therapy.
- Aspirin overdose: Contributes to hyperthermia through partial uncoupling.