Explain me 10 common heart disease with ECG changes and ECG images of those diseases
Reading File
Finding Sources
Finding Sources
Searching the Web
10 common heart diseases ECG changes patterns images cardiology
Finding Sources
Finding Sources
Finding Sources
Reading File
Reading File
Reading File
Reading File
Finding Sources
Finding Sources
Reading File
Reading File
Finding Sources
Reading File
Reading File
Finding Sources
Reading File
Reading File
Reading File
I now have all the material I need. Let me compose the comprehensive response with ECG images.
10 Common Heart Diseases: ECG Changes & Images
Below are 10 major cardiac conditions, their signature ECG findings, and actual ECG images from Harrison's Principles of Internal Medicine (22nd Ed.), Guyton & Hall Medical Physiology, and Fuster & Hurst's The Heart.
1. ST-Elevation Myocardial Infarction (STEMI)
What happens: Occlusion of a coronary artery causes transmural ischemia. A voltage gradient develops between normal and ischemic zones, producing "currents of injury" seen on ECG.
ECG changes:
- Hyperacute T waves - the earliest sign (tall, broad, peaked T waves)
- ST-segment elevation in the territory of the occluded artery (>1 mm in limb leads, >2 mm in precordial leads)
- Reciprocal ST depression in mirror-image leads
- Q waves - develop within hours to days (necrosis marker)
- T-wave inversion - follows ST elevation as infarct evolves
- R-wave loss in the infarct zone
Localization by leads:
- Anterior STEMI (LAD): V1-V4
- Inferior STEMI (RCA): II, III, aVF
- Lateral STEMI (LCx): I, aVL, V5-V6
- Posterior STEMI: reciprocal ST depression in V1-V3 (tall R wave in V1)
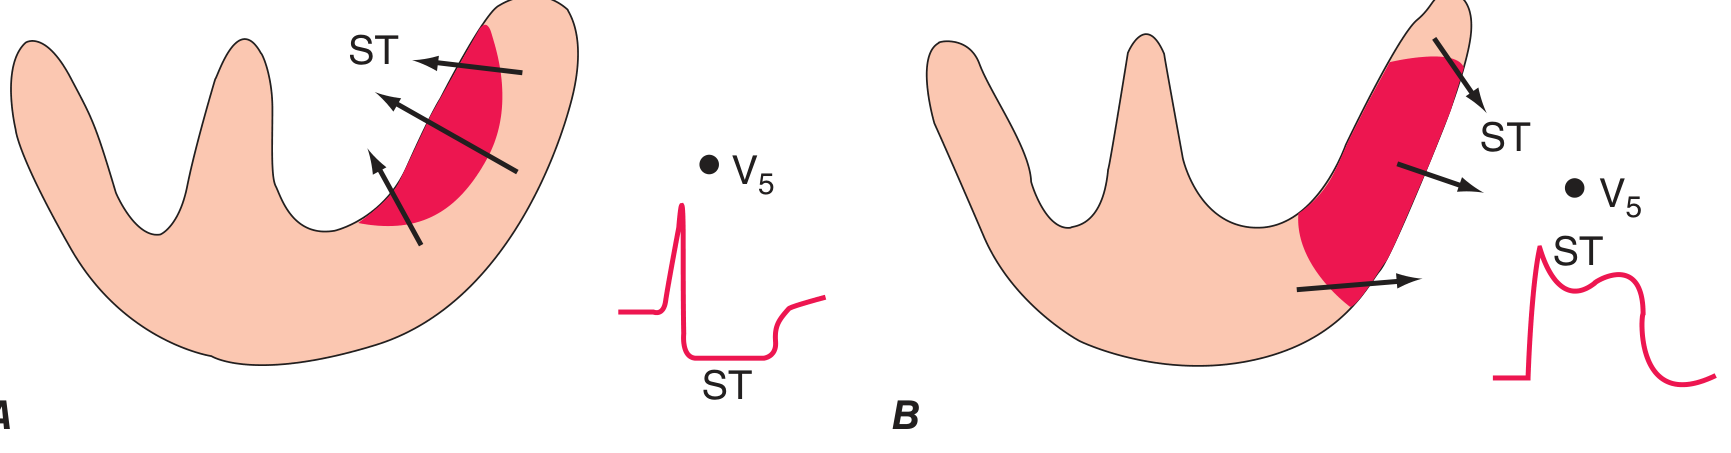
2. Non-ST-Elevation MI (NSTEMI) / Unstable Angina
What happens: Partial or subendocardial ischemia without full transmural involvement.
ECG changes:
- ST depression (horizontal or downsloping) in affected leads - the ST vector shifts toward the subendocardium
- T-wave inversions - deep, symmetric, often in anterior or lateral leads
- No Q waves (by definition - no full thickness necrosis on ECG)
- No ST elevation (but aVR may show ST elevation as a reciprocal change)
- Normal ECG does not exclude NSTEMI - diagnosis depends on biomarkers
Key note: Deep T-wave inversions in V1-V4 (Wellens pattern) signal a critical LAD lesion and impending STEMI even before enzyme rise.
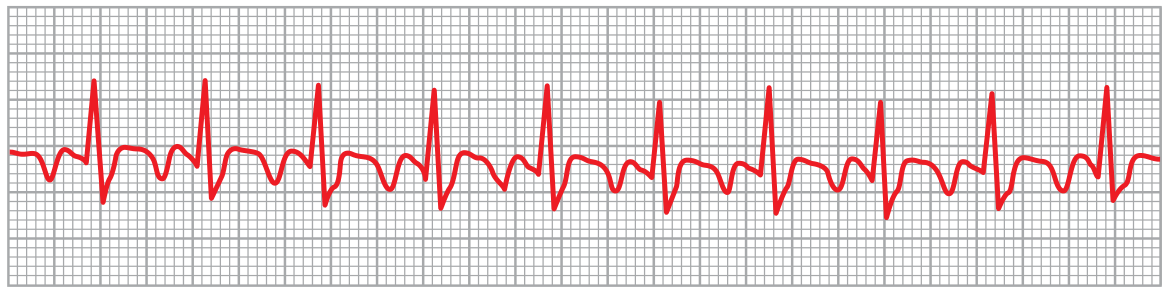
3. Atrial Fibrillation (AF)
What happens: Chaotic, disorganized electrical activity fires from multiple ectopic foci in the atria at 350-600 bpm. The AV node acts as a gatekeeper, allowing only random impulses through.
ECG changes:
- Absence of distinct P waves - replaced by a fine, irregular, low-amplitude baseline ("fibrillatory waves," sometimes called f-waves)
- Irregularly irregular RR intervals - the hallmark; no two consecutive RR intervals are equal
- Ventricular rate typically 100-160 bpm if untreated
- QRS complexes are normal unless aberrant conduction or pre-existing bundle branch block is present
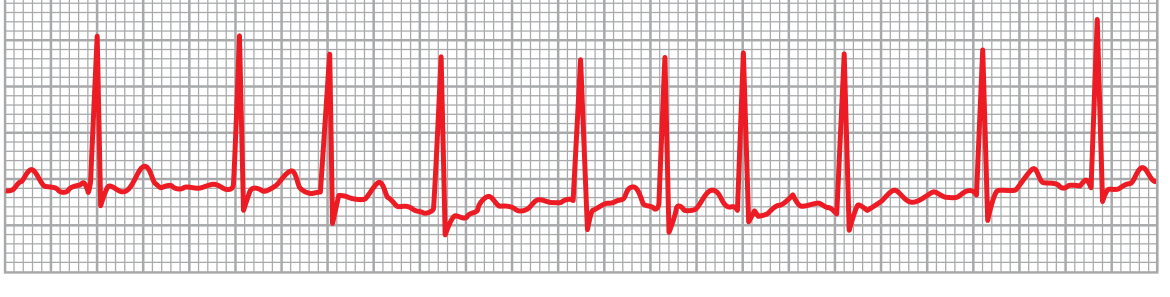
4. Atrial Flutter
What happens: A single, organized macroreentrant circuit in the right atrium (usually around the tricuspid annulus) fires at 250-350 bpm. The AV node blocks most impulses, usually conducting every 2nd or 3rd beat.
ECG changes:
- "Sawtooth" flutter waves (F waves) at ~250-300 bpm, best seen in leads II, III, aVF, and V1
- No isoelectric baseline between flutter waves
- Regular atrial rate ~300 bpm
- Regular ventricular response with a fixed block ratio (2:1 most common -> ventricular rate ~150 bpm; also 3:1, 4:1)
- Normal QRS unless aberrant conduction
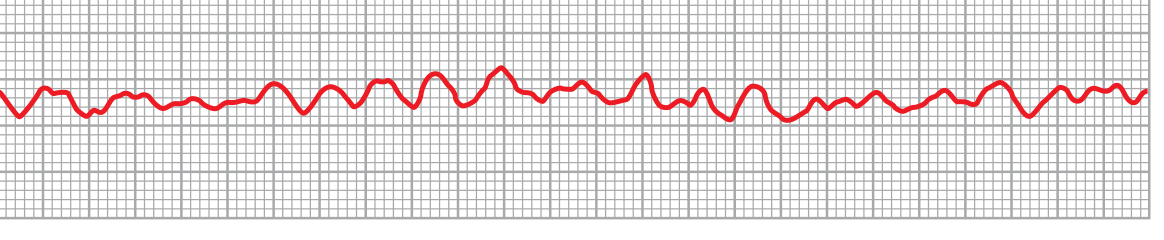
5. Ventricular Fibrillation (VF)
What happens: Multiple simultaneous chaotic reentrant wavefronts propagate through the ventricles in all directions - a "chain reaction" mechanism. No coordinated ventricular contraction occurs. This is immediately life-threatening (cardiac arrest).
ECG changes:
- Chaotic, bizarre, irregular waveforms - no identifiable P waves, QRS complexes, or T waves
- No repetitive pattern whatsoever
- Initial coarse VF - larger amplitude irregular waves in first few seconds
- Degenerates to fine VF - lower amplitude waves as amplitude decays over minutes
- Voltages decay rapidly: ~0.5 mV initially -> 0.2-0.3 mV after 20-30 seconds
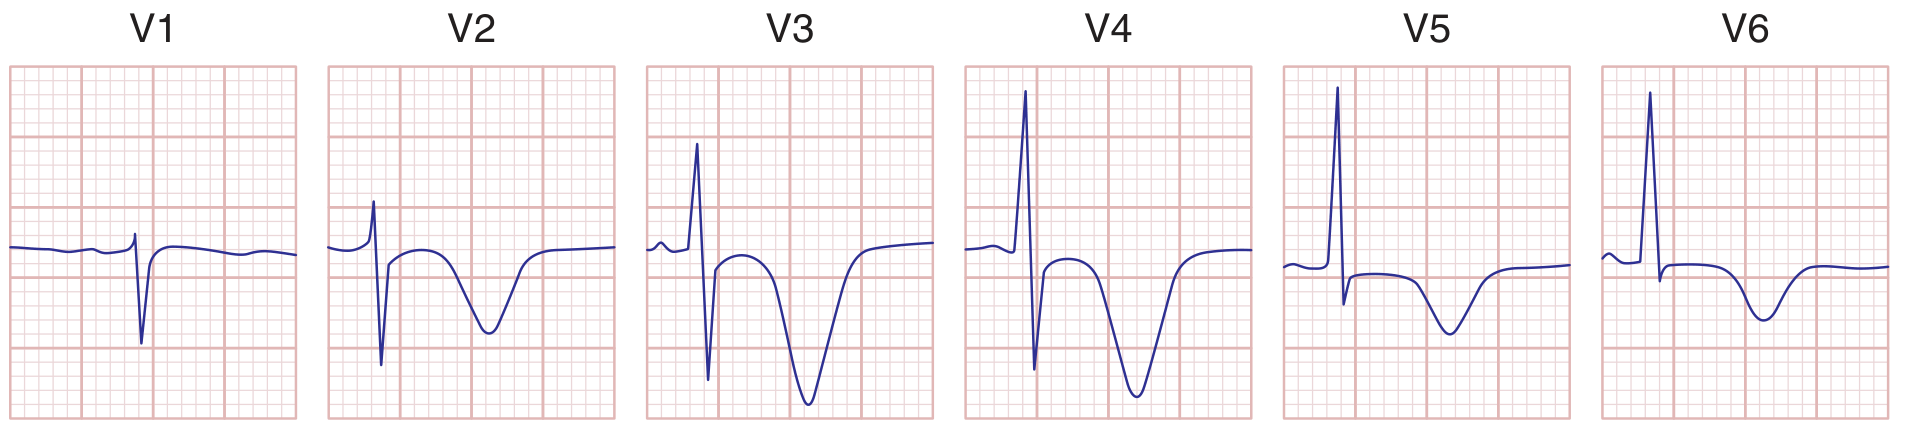
6. Left Ventricular Hypertrophy (LVH)
What happens: Increased LV muscle mass amplifies leftward and posterior electrical forces. Common in hypertension, aortic stenosis, hypertrophic cardiomyopathy.
ECG changes:
- Tall R waves in left precordial leads (V5, V6) and limb leads
- Deep S waves in right precordial leads (V1, V2)
- Sokolow-Lyon voltage criterion: SV1 + RV5 or RV6 >35 mm
- RaVL >20 mm (women) or >28 mm (men) (Cornell voltage criterion)
- "Strain" pattern: ST depression with T-wave inversion in leads with tall R waves (I, aVL, V5-V6)
- Left axis deviation
- Left atrial enlargement (broad, notched P wave - "P mitrale")
- Can progress to incomplete or complete LBBB
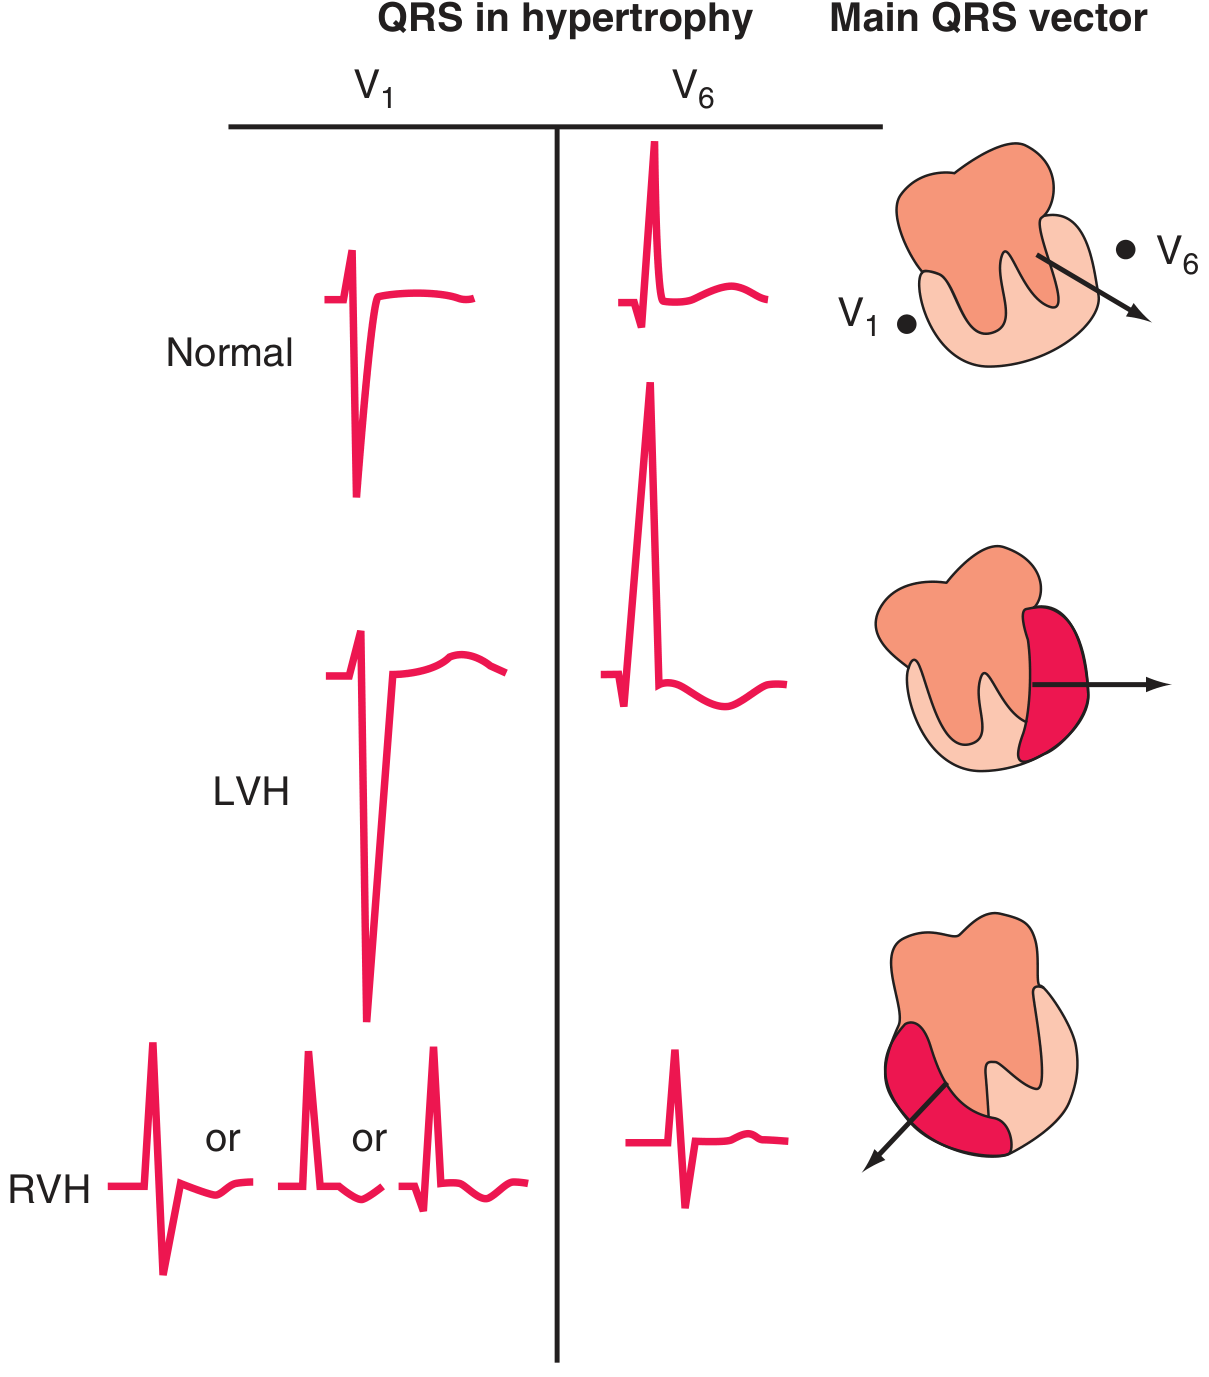
7. Right Ventricular Hypertrophy (RVH)
What happens: Increased RV muscle mass (from pulmonary hypertension, chronic lung disease, congenital heart disease) reverses the normal left-dominant QRS vector.
ECG changes:
- Tall R waves in V1 (R > S in V1) - reversal of normal pattern
- Deep S waves in V5, V6 (prominent S wave pattern in left lateral leads)
- Right axis deviation (QRS axis >+110°)
- T-wave inversions in V1-V4 ("RV strain" pattern)
- Incomplete or complete RBBB pattern in atrial septal defects
- Acute RVH (pulmonary embolism): S1Q3T3 pattern - S wave in lead I, Q wave in lead III, T-wave inversion in lead III; sinus tachycardia; new right bundle branch block
(Image above (Fig 247-9) also shows RVH pattern for comparison)
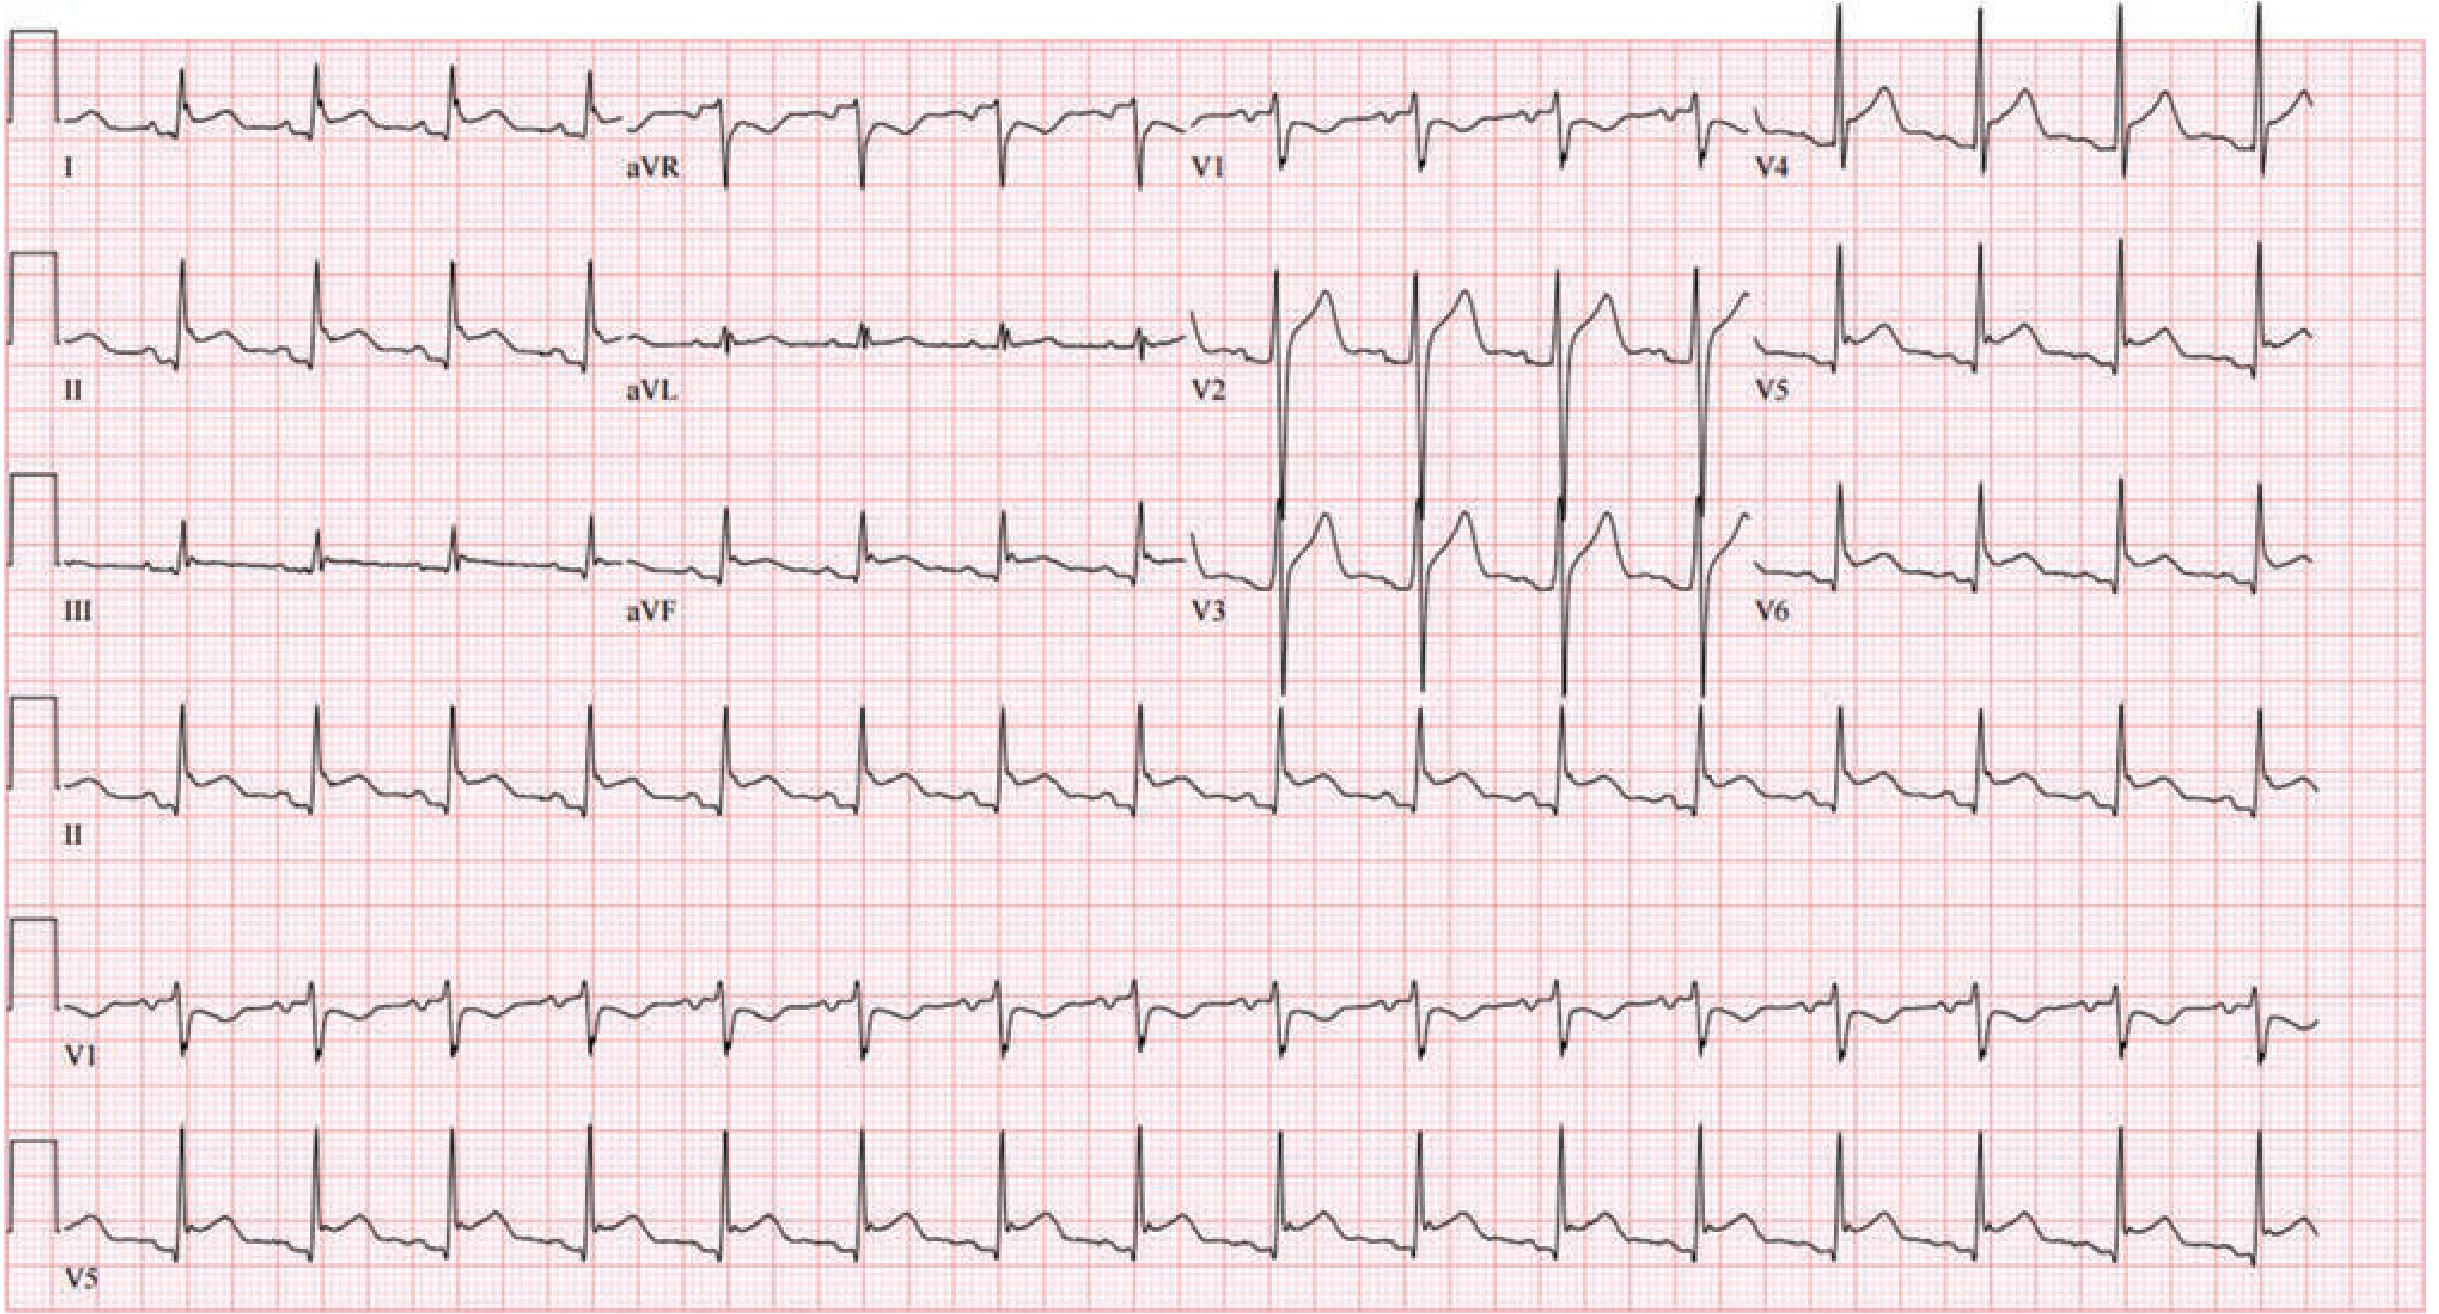
8. Bundle Branch Block (LBBB / RBBB)
What happens: Delay or block in one bundle branch forces the affected ventricle to depolarize late via slow myocardial conduction rather than fast Purkinje fibers, widening the QRS.
LBBB ECG changes:
- Wide QRS >120 ms
- Broad, notched ("M-shaped") R wave in V5, V6, I, aVL
- Absent septal q waves in lateral leads
- Deep S wave or QS in V1
- Secondary ST-T changes: T wave opposite to final QRS deflection (discordant)
- Left axis deviation
RBBB ECG changes:
- Wide QRS >120 ms
- rSR' ("M-shape") in V1, V2 - the second R' representing delayed RV activation
- Wide, slurred S waves in I, V5, V6
- T-wave inversion in V1-V3 (secondary repolarization change)
(See Harrison's Fig 247-10 description: "Comparison of typical QRS-T patterns in RBBB and LBBB vs normal in leads V1 and V5. Note secondary T-wave inversions in leads with rSR' complex with RBBB, and in leads with wide R wave with LBBB." - Harrison's 22E)
9. Acute Pericarditis
What happens: Inflammation of the pericardium irritates the underlying epicardium, causing diffuse (non-territory-specific) ST and PR changes. Evolves through 4 classical ECG stages.
ECG changes (4 stages):
- Stage 1 (acute, days 1-2): Diffuse concave-up ("saddle-shaped") ST elevation in almost all leads EXCEPT aVR and V1 (where ST is depressed); PR depression diffusely (PR elevation in aVR) - this combination is highly specific for pericarditis
- Stage 2 (days 3-7): ST and PR changes normalize; ECG may be normal
- Stage 3 (weeks 1-3): Diffuse T-wave inversions across multiple leads
- Stage 4 (weeks-months): Return to baseline (or persistent T-wave changes in chronic pericarditis)
Key distinguishing features from STEMI:
- ST elevation is diffuse, not territory-specific
- PR depression is a unique hallmark
- No reciprocal ST depression in other leads
- No Q waves
10. Complete (Third-Degree) Heart Block
What happens: No electrical impulses conduct from atria to ventricles through the AV node. The atria and ventricles beat completely independently - "AV dissociation." The ventricles are driven by a slow escape pacemaker (junctional or ventricular).
ECG changes:
- Regular P waves at normal sinus rate (60-100 bpm)
- Regular QRS complexes at a much slower escape rate:
- Junctional escape: 40-60 bpm, narrow QRS
- Ventricular escape: 20-40 bpm, wide QRS (>120 ms)
- P waves and QRS complexes are completely independent - the PR interval changes constantly; P waves "march through" QRS complexes
- No relationship between P waves and QRS complexes
- Slow ventricular rate leads to symptoms: syncope (Stokes-Adams attacks), heart failure, presyncope
Causes: Ischemic heart disease (especially inferior MI affecting the AV node), Lyme disease, drugs (digoxin, beta-blockers, calcium channel blockers), congenital, degenerative disease of the conduction system.
Quick Reference Summary Table
| # | Disease | Key ECG Finding | Rate/Rhythm |
|---|---|---|---|
| 1 | STEMI | ST elevation + Q waves in territory | Sinus ± tachycardia |
| 2 | NSTEMI/UA | ST depression, T inversions, no Q waves | Usually sinus |
| 3 | Atrial Fibrillation | No P waves, irregularly irregular | 100-160 bpm |
| 4 | Atrial Flutter | Sawtooth F waves, 2:1/3:1 block | Atrial 300, ventricular 150 |
| 5 | Ventricular Fibrillation | Chaotic, no organized waveform | No cardiac output |
| 6 | LVH | Tall R waves (V5/V6), strain pattern | Usually sinus |
| 7 | RVH | Tall R in V1, right axis, S1Q3T3 (PE) | Usually sinus |
| 8 | Bundle Branch Block | Wide QRS >120 ms, RSR' (RBBB) or M-wave (LBBB) | Depends on underlying |
| 9 | Acute Pericarditis | Diffuse saddle ST elevation + PR depression | Usually sinus tachycardia |
| 10 | Complete Heart Block | AV dissociation, slow ventricular escape | 20-60 bpm escape |
Sources: Harrison's Principles of Internal Medicine 22E (2025) - Chap. 247; Guyton and Hall Textbook of Medical Physiology 14E - Chap. 13; Fuster and Hurst's The Heart 15E - Chap. 53; Goldman-Cecil Medicine - Chap. 42.
Explain me 10 common function of each human organ with images
Asking for Preferences
Reading File
You've run out of free credits. Sign up for a free account to continue using Orris.
This is a shared conversation. Sign in to Orris to start your own chat.