
Explain me how to analyse ecg from basic to advanced with all conditions along with proper diagrams
Reading File
Now let me search the medical library for ECG content across multiple topics in parallel.
Finding Sources
Finding Sources
Searching the Web
ECG interpretation guide basic to advanced with diagrams all conditions
Reading File
Finding Sources
Finding Sources
Now let me fetch several images and read key ECG sections from the textbooks in parallel.
Reading File
Reading File
Reading File
Finding Sources
Finding Sources
Now let me fetch key ECG images from the textbooks to include in the answer.
Loading Image
Loading Image
Reading File
Reading File
Loading Image
Loading Image
Loading Image
Reading File
Finding Sources
Finding Sources
Loading Image
Loading Image
Reading File
Reading File
Loading Image
Loading Image
Finding Sources
Finding Sources
I now have comprehensive content from multiple authoritative textbooks and real ECG images. Let me compile the complete guide.
Complete ECG Analysis Guide: Basic to Advanced
Sources: Medical Physiology (Boron & Boulpaep), Goldman-Cecil Medicine, Braunwald's Heart Disease, Rosen's Emergency Medicine, Frameworks for Internal Medicine, Harrison's Principles of Internal Medicine 22E, Ganong's Review of Medical Physiology
PART 1 - THE BASICS: Understanding the ECG
What is an ECG?
An ECG (electrocardiogram) provides a direct measurement of the rate, rhythm, and time-dependent electrical vector of the heart. It records the time versus amplitude of electrical projections and represents the heart's conduction system. Because different parts of the heart activate sequentially, we can attribute time-dependent changes in the electrical vector to different regions.
- P wave - atrial depolarization
- QRS complex - ventricular depolarization
- T wave - ventricular repolarization
- U wave - delayed repolarization of Purkinje fibers (may be seen in hypokalemia)
(Medical Physiology, Boron & Boulpaep)
The ECG Paper
ECG paper uses a standard grid:
- Vertical axis: 0.1 mV per mm
- Horizontal axis: 0.04 seconds per small box (1 mm), 0.2 seconds per large box (5 mm)
- 5 large boxes = 1 second
At the standard paper speed of 25 mm/s:
| Box Size | Width | Time |
|---|---|---|
| Small (1 mm) | - | 0.04 sec |
| Large (5 mm) | - | 0.20 sec |
The 12 Leads: What Each Sees
A 12-lead ECG uses 10 electrodes to generate 12 views of the heart from different angles:
Limb Leads (Frontal Plane)
| Lead | View |
|---|---|
| I | Lateral (0°) |
| II | Inferior (60°) |
| III | Inferior (120°) |
| aVR | Cavity/right (-150°) |
| aVL | Lateral (-30°) |
| aVF | Inferior (90°) |
Precordial Leads (Horizontal Plane)
| Lead | Position | View |
|---|---|---|
| V1 | Right sternal border, 4th ICS | Septal/RV |
| V2 | Left sternal border, 4th ICS | Septal |
| V3 | Between V2 and V4 | Anterior |
| V4 | Midclavicular line, 5th ICS | Anterior |
| V5 | Anterior axillary line | Lateral |
| V6 | Midaxillary line | Lateral |
Coronary territory localization:
| Leads with Changes | Territory | Artery |
|---|---|---|
| V1-V4 | Anterior | LAD |
| I, aVL, V5-V6 | Lateral | LCx |
| II, III, aVF | Inferior | RCA |
| V1-V2 (tall R, ST depression) | Posterior | RCA/LCx |
| V3R-V4R | Right ventricle | RCA |
PART 2 - THE SYSTEMATIC APPROACH (7-Step Method)
Always read every ECG using the same sequence. Never skip steps.
Step 1 - Rate
Direct method: Count seconds between two R waves (R-R interval). Heart rate = 60 / R-R interval in seconds.
Quick method (for regular rhythms):
Count large boxes between R waves and use the "300 rule":
| Large Boxes (R-R) | Heart Rate |
|---|---|
| 1 | 300 bpm |
| 2 | 150 bpm |
| 3 | 100 bpm |
| 4 | 75 bpm |
| 5 | 60 bpm |
| 6 | 50 bpm |
For irregular rhythms: Count QRS complexes in a 10-second rhythm strip and multiply by 6.
- Normal: 60-100 bpm
- Bradycardia: < 60 bpm
- Tachycardia: > 100 bpm
Step 2 - Rhythm
Ask four questions:
- Is there a P wave before every QRS?
- Is there a QRS after every P wave?
- Are P-P intervals regular?
- Are R-R intervals regular?
Normal sinus rhythm requires:
- P wave before each QRS
- P wave upright in leads II, III, aVF
- PR interval 0.12-0.20 sec
- Regular rate 60-100 bpm
Step 3 - Axis
The normal QRS axis lies between -30° and +90°.
Quick method - look at leads I and aVF:
| Lead I | aVF | Axis |
|---|---|---|
| Positive (up) | Positive (up) | Normal (0° to +90°) |
| Positive (up) | Negative (down) | Left axis deviation (LAD) |
| Negative (down) | Positive (up) | Right axis deviation (RAD) |
| Negative (down) | Negative (down) | Extreme (Northwest) axis |
Causes of LAD: LBBB, left anterior fascicular block, inferior MI, LVH, WPW
Causes of RAD: RBBB, left posterior fascicular block, RVH, lateral MI, PE, WPW
Step 4 - Intervals
| Interval | Normal | Meaning |
|---|---|---|
| PR interval | 0.12-0.20 sec (3-5 small boxes) | AV conduction time |
| QRS duration | < 0.12 sec (< 3 small boxes) | Ventricular depolarization |
| QT interval | Varies with rate; corrected QTc < 450 ms (men), < 470 ms (women) | Ventricular action potential duration |
| QTc formula | QT / √(R-R interval in seconds) | Bazett's formula |
Step 5 - P Waves and Atrial Enlargement
Normal P wave: < 0.12 sec wide, < 2.5 mm tall, upright in I and II, biphasic in V1
| Finding | Meaning |
|---|---|
| Tall peaked P > 2.5 mm in II | Right atrial enlargement ("P pulmonale") |
| Wide notched P > 0.12 sec in II | Left atrial enlargement ("P mitrale") |
| Biphasic P in V1 with large terminal negative component | Left atrial enlargement |
Step 6 - QRS Complex
Normal Q waves: Small septal q waves in I, aVL, V5-V6 (< 1 small box wide, < 25% height of R wave)
Pathological Q waves: > 1 mm wide OR > 1/3 height of QRS = old infarction (not in III and aVR where Q waves can be normal)
R wave progression: R waves should grow from V1 to V5/V6 (poor R-wave progression = anterior MI or LVH)
Step 7 - ST Segment and T Waves
| Finding | Meaning |
|---|---|
| ST elevation > 1 mm in 2+ contiguous leads | STEMI, pericarditis, Prinzmetal's angina, LV aneurysm |
| ST depression | Ischemia (NSTEMI/UA), reciprocal changes, digitalis effect |
| T wave inversion | Ischemia, strain pattern, PE, Wellens' syndrome |
| Tall peaked T waves | Hyperkalemia, hyperacute STEMI |
| Flat/inverted T waves | Hypokalemia, ischemia |
PART 3 - ARRHYTHMIAS
3.1 Sinus Arrhythmias
| Arrhythmia | Rate | Rhythm | P waves | PR | QRS |
|---|---|---|---|---|---|
| Normal sinus rhythm | 60-100 | Regular | Upright in II, before QRS | 0.12-0.20 | Normal |
| Sinus tachycardia | >100 | Regular | Normal | Normal | Normal |
| Sinus bradycardia | <60 | Regular | Normal | Normal | Normal |
| Sinus arrhythmia | 60-100 | Irregular (varies with breathing) | Normal | Normal | Normal |
| Sinus pause/arrest | Variable | Pause | Missing P | - | Missing QRS |
3.2 Atrial Arrhythmias
Below is a classic textbook ECG showing atrial extrasystole, atrial tachycardia, atrial flutter, and atrial fibrillation side by side:
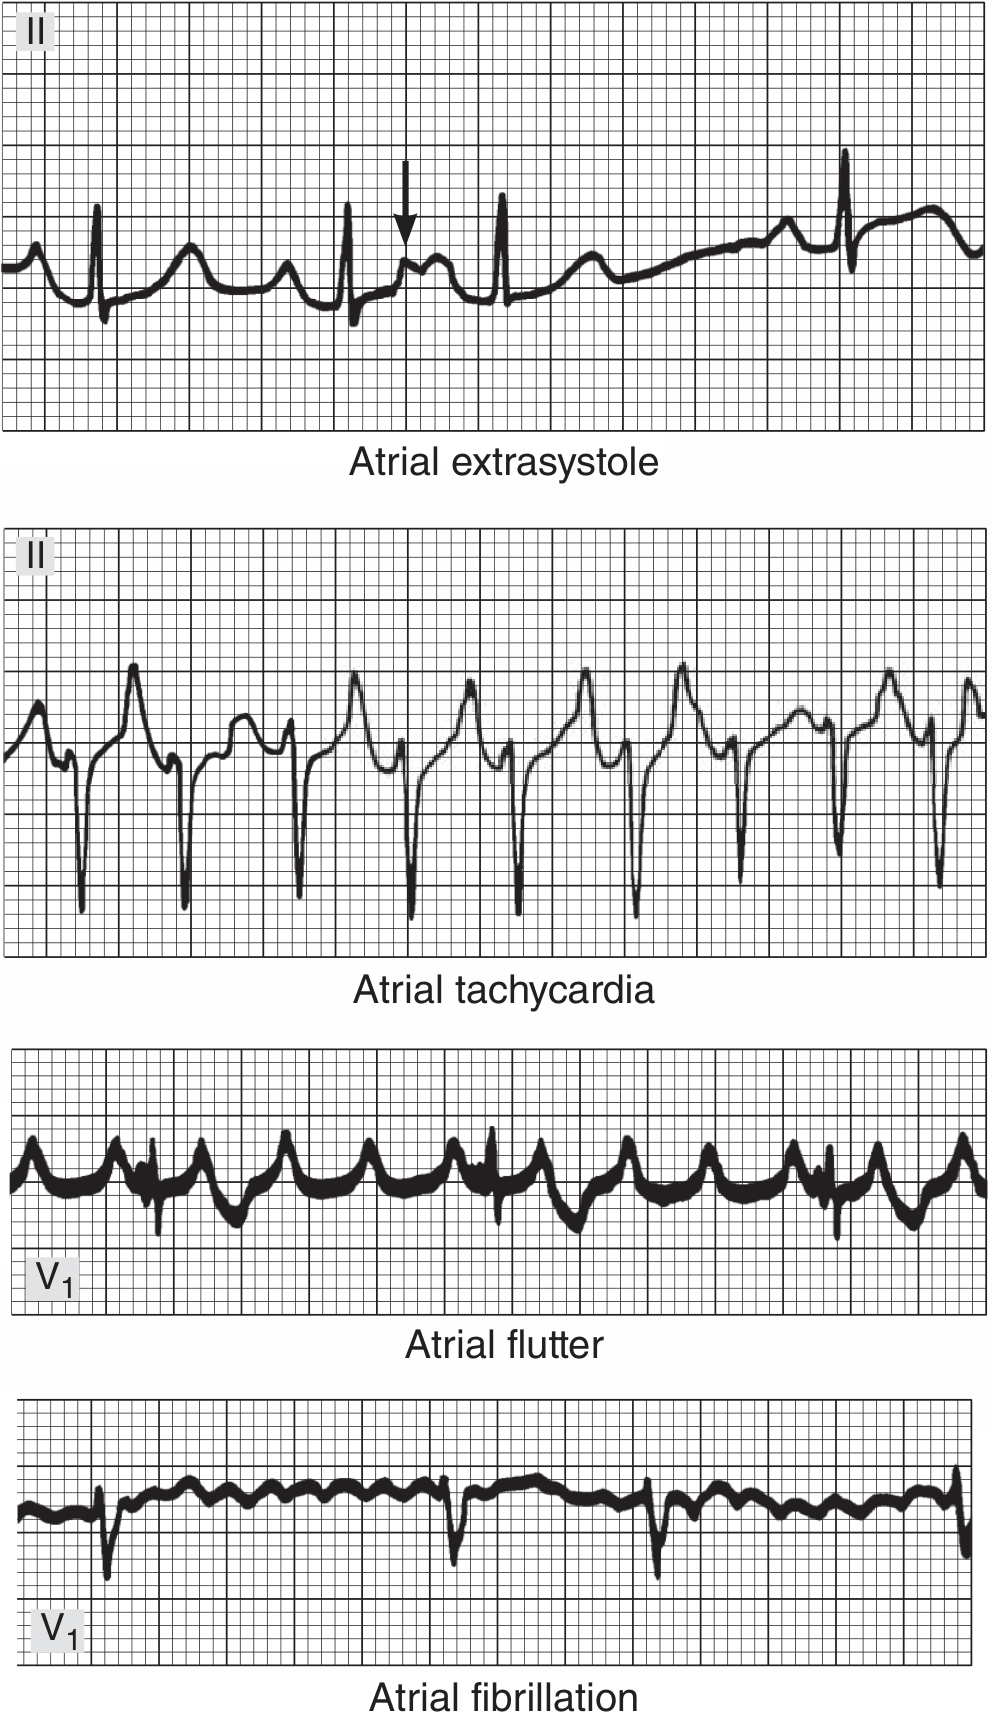
FIGURE - Atrial arrhythmias. Top to bottom: atrial extrasystole (arrow = abnormal P buried in preceding T wave); atrial tachycardia; atrial flutter with 4:1 AV block (sawtooth pattern); atrial fibrillation with totally irregular ventricular rate. (Ganong's Review of Medical Physiology)
Atrial Extrasystoles (PACs)
- Abnormal P wave morphology (ectopic atrial focus)
- QRST usually normal (same ventricular activation)
- Followed by a compensatory or non-compensatory pause
- Clinically benign in most individuals
Atrial Tachycardia
- Rate: 150-220 bpm from a single atrial focus
- P waves present but different morphology from sinus
- May have AV block (especially in digitalis toxicity)
Atrial Flutter
- Atrial rate: 200-350 bpm, typically ~300 bpm
- Classic sawtooth "flutter waves" at 300/min in leads II, III, aVF (negative) and V1 (positive)
- Usually 2:1 AV block → ventricular rate ~150 bpm (always suspect flutter when rate is exactly 150)
- Mechanism: large counterclockwise reentrant circuit in right atrium around cavo-tricuspid isthmus
The stress test below shows the natural progression from sinus tachycardia → rapid AF → 2:1 atrial flutter → AF → sinus rhythm:
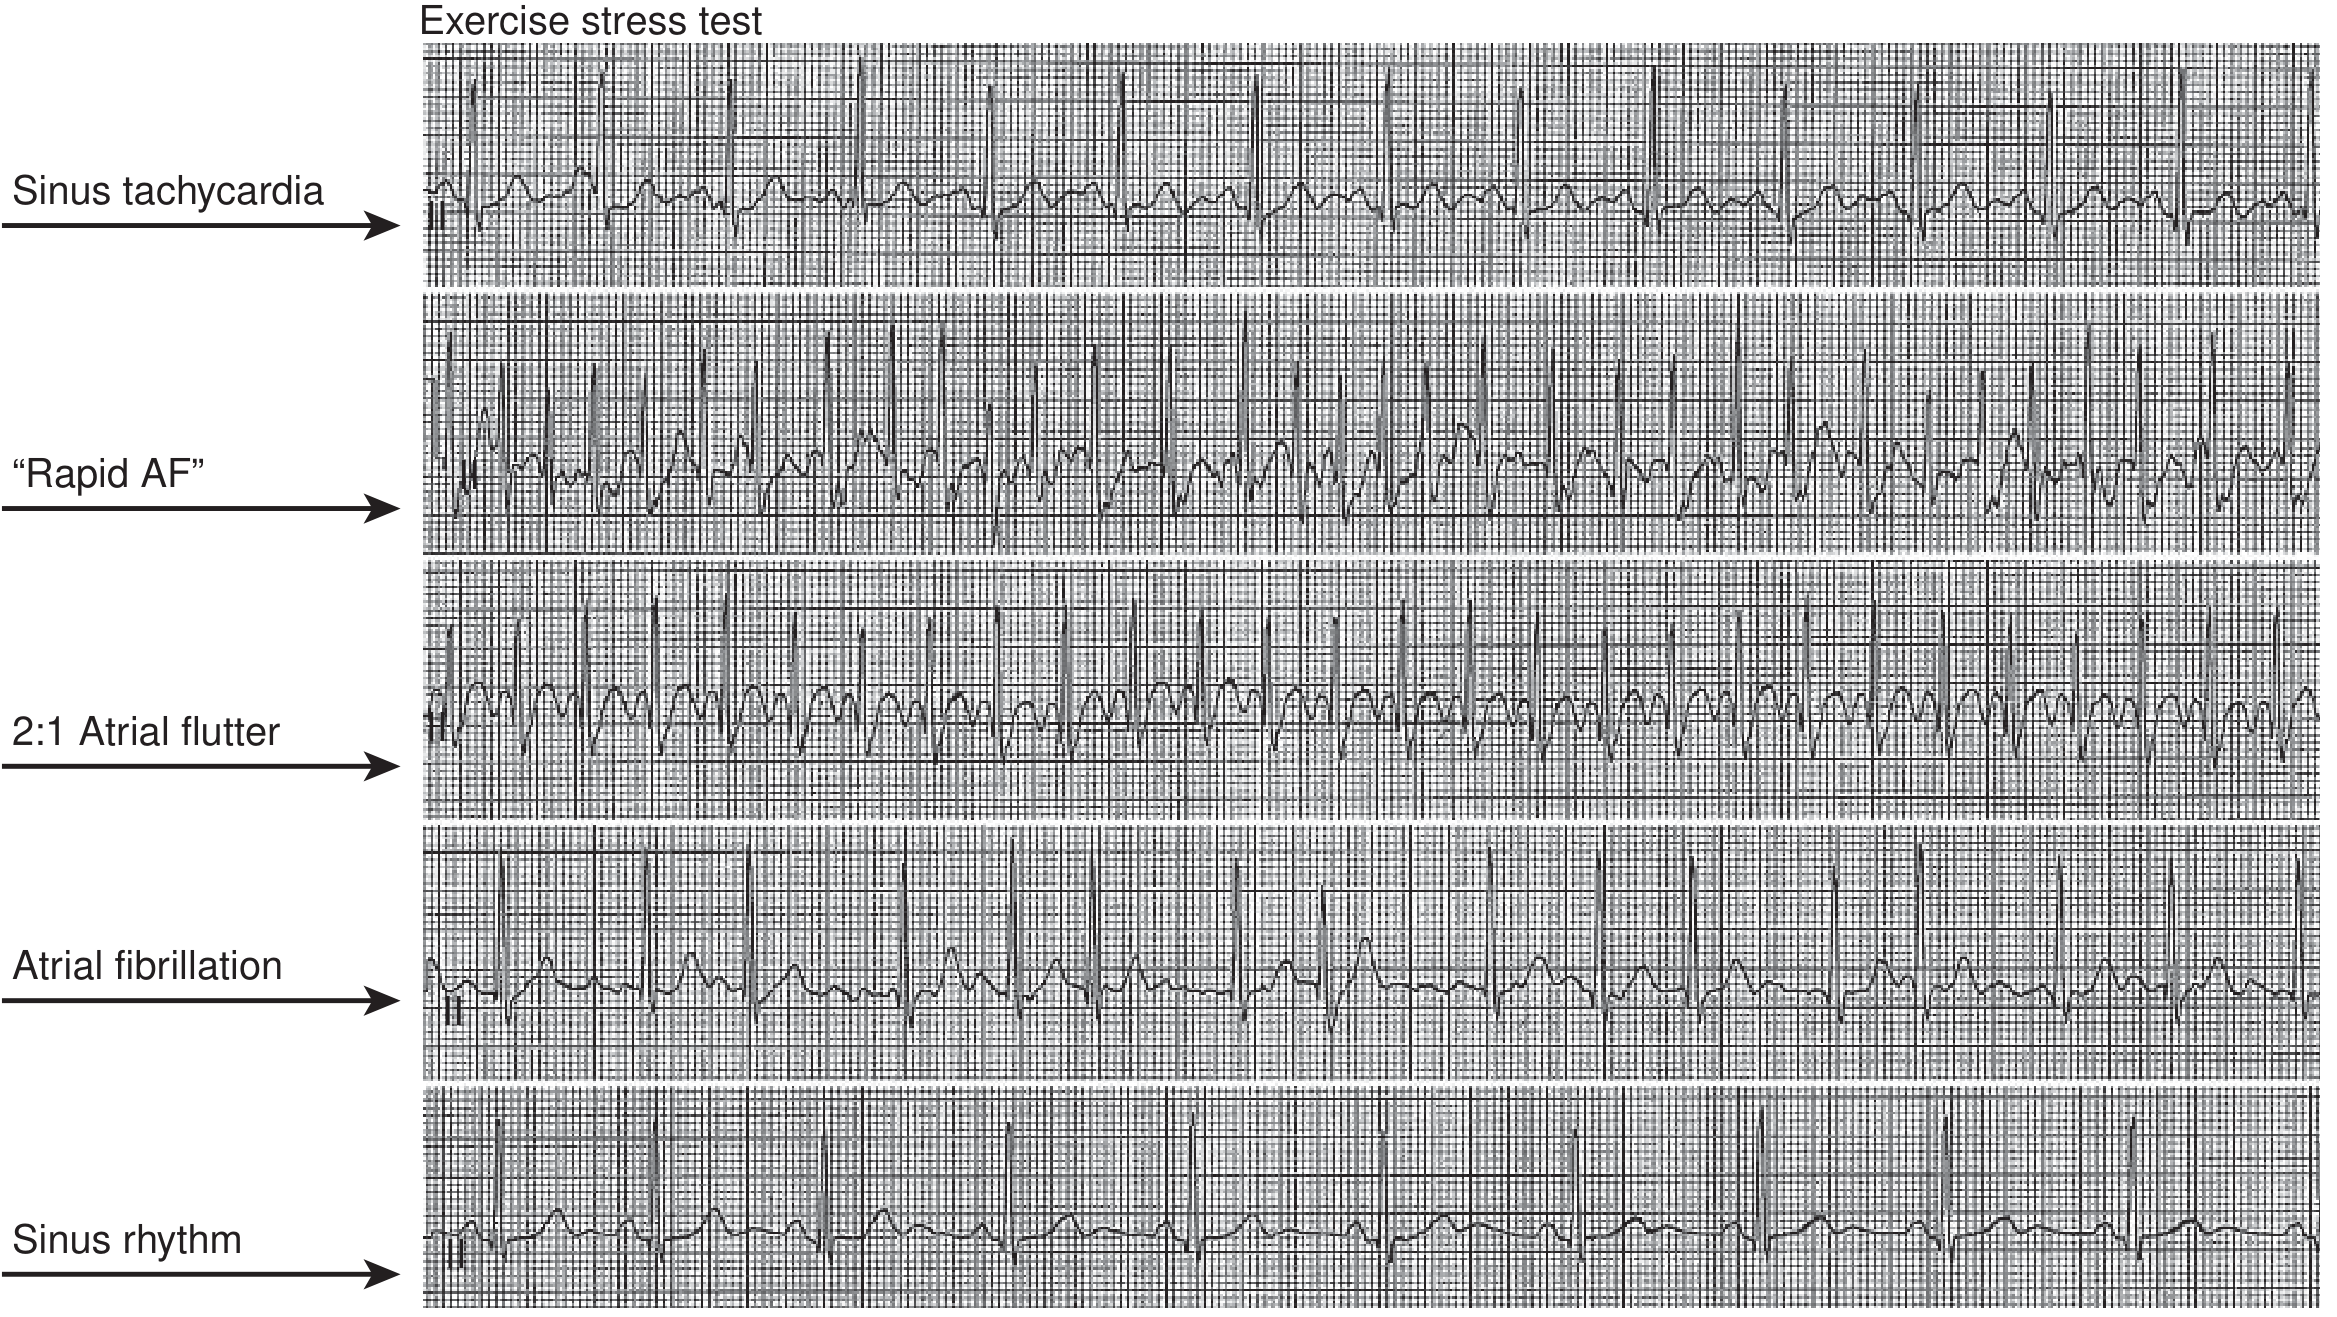
FIGURE - Exercise stress test showing sinus tachycardia, rapid AF, 2:1 atrial flutter, AF, and spontaneous return to sinus rhythm. (Braunwald's Heart Disease)
Atrial Fibrillation (AF)
- Atrial rate: 300-500/min, completely irregular and disorganized
- No distinct P waves - replaced by fibrillatory baseline
- Irregularly irregular R-R intervals (pathognomonic)
- Ventricular rate: 80-160 bpm
- Mechanism: multiple concurrent reentrant excitation waves in both atria; some paroxysmal AF from ectopic foci in pulmonary veins (Ganong's Review of Medical Physiology)
3.3 AV Nodal Arrhythmias
AVNRT (AV Nodal Reentrant Tachycardia)
- Most common SVT
- Rate: 150-250 bpm, regular
- P waves buried in or just after QRS (retrograde P, pseudo-R' in V1, pseudo-S in inferior leads)
- Narrow QRS (unless aberrant)
- Terminates with vagal maneuvers or adenosine
AVRT (AV Reentrant Tachycardia) - WPW
- Accessory pathway connects atria and ventricles
- Delta wave on baseline ECG: slurred upstroke of QRS, short PR (<0.12 sec), wide QRS
- Orthodromic AVRT: narrow complex (down accessory, up normal)
- Antidromic AVRT: wide complex (down normal, up accessory) - looks like VT!
3.4 Heart Blocks (AV Blocks)
The three general types are first-degree, second-degree, and third-degree AV block.
First-Degree AV Block
ECG finding: PR interval > 200 ms (> 1 large box), every P conducts to QRS
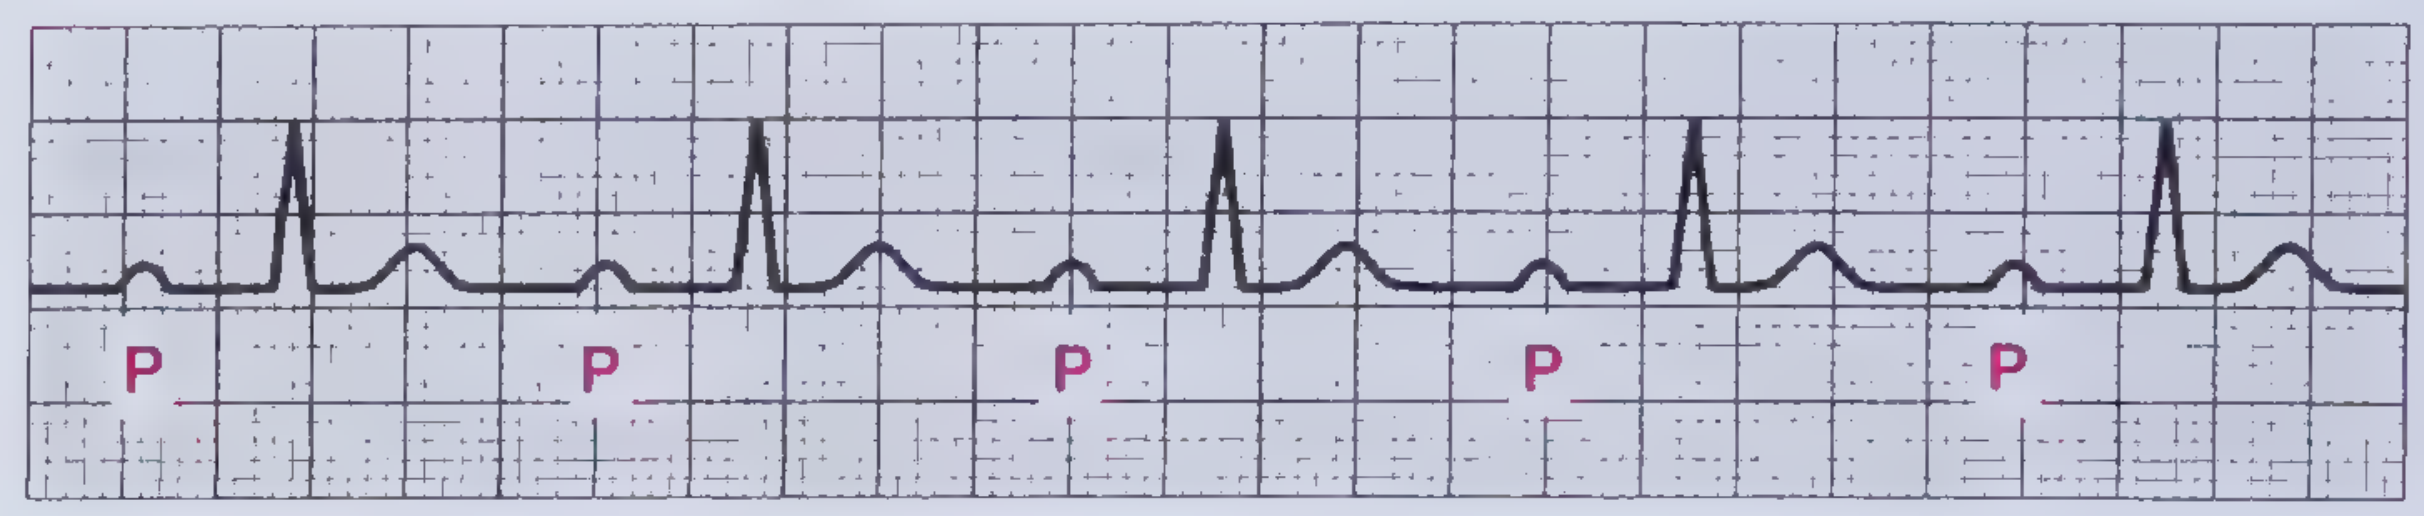
FIGURE - First-degree AV block. The PR interval is >200 ms in duration. (Frameworks for Internal Medicine)
- Generally benign
- Causes: inferior MI, increased vagal tone, digoxin, electrolyte abnormalities
- No treatment needed for isolated first-degree block
Second-Degree AV Block - Mobitz Type I (Wenckebach)
ECG findings: Progressively lengthening PR intervals until a QRS is dropped, then the cycle resets.
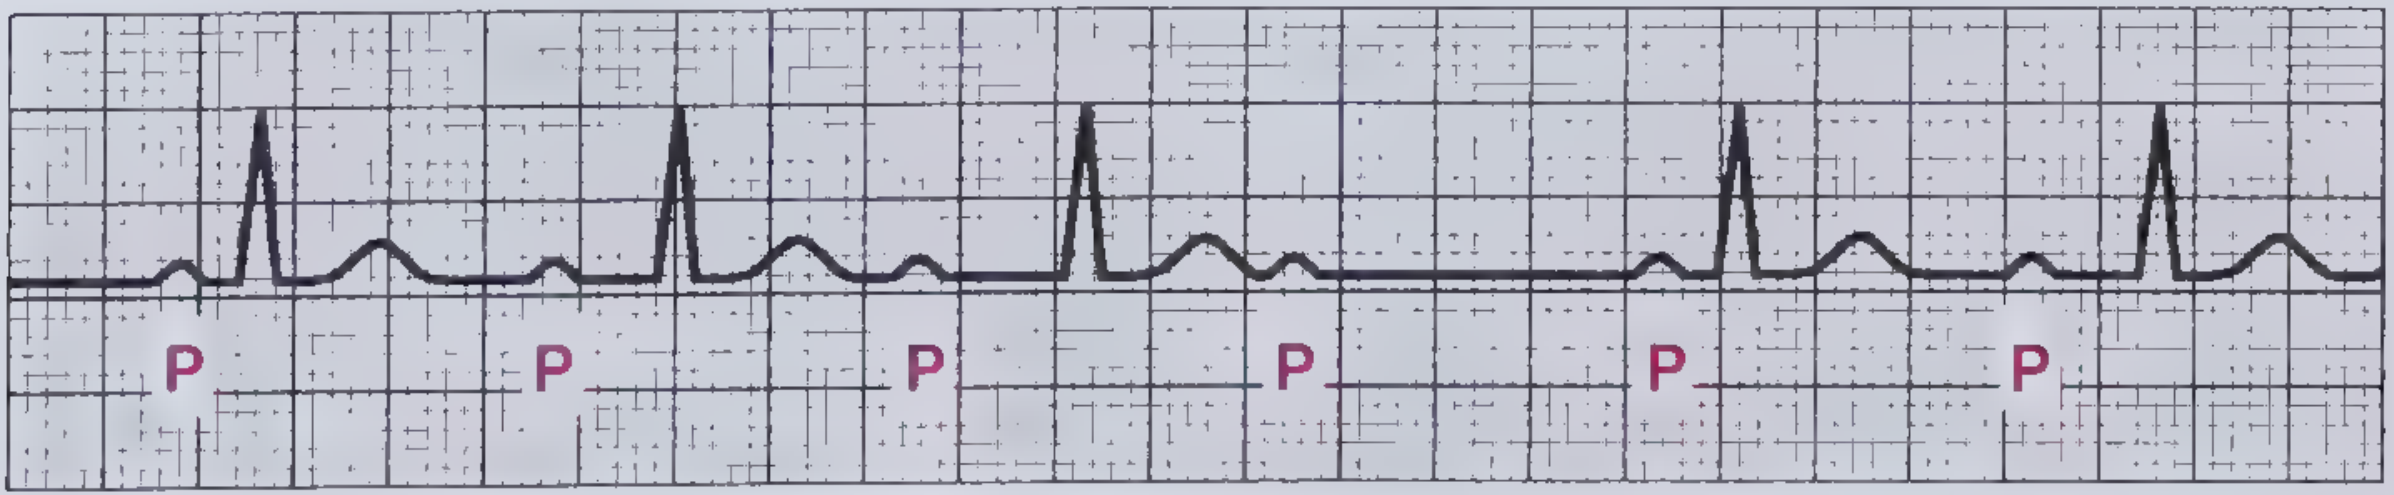
FIGURE - Mobitz I second-degree AV block. The P-wave rate is constant, but PR interval progressively lengthens until a QRS is completely blocked (after the 4th P wave). (Frameworks for Internal Medicine)
- Level of block: AV node
- Associated with: right coronary artery territory MI (inferior leads II, III, aVF)
- Usually benign, may be transient
- Rarely requires pacing
Second-Degree AV Block - Mobitz Type II
ECG findings: Constant PR interval with sudden unexpected drop of a QRS (no progressive PR lengthening).
- Level of block: His-Purkinje system (below AV node)
- High risk of progression to complete heart block
- Permanent pacemaker usually required (Frameworks for Internal Medicine)
Second-Degree AV Block - 2:1 Block

FIGURE - Second-degree AV block with 2:1 AV conduction. There are twice as many P waves as QRS complexes - every other atrial impulse is blocked. (Frameworks for Internal Medicine)
- Every other P wave is non-conducted
- Cannot distinguish Mobitz I from II electrocardiographically in pure 2:1 block
- PR interval of conducted beats helps: prolonged = more likely Mobitz I; normal = more likely Mobitz II
Third-Degree (Complete) AV Block
ECG findings: Complete AV dissociation - P waves and QRS complexes are completely independent.
- Atrial rate (P waves) is faster than the ventricular rate (QRS)
- Escape rhythm: junctional (narrow QRS, 40-60 bpm) or ventricular (wide QRS, 20-40 bpm)
- Causes: inferior MI (transient), anterior MI (permanent), Lyme disease, digoxin toxicity, fibrosis
- Treatment: atropine acutely; permanent pacemaker for persistent cases (Goldman-Cecil Medicine)
3.5 Bundle Branch Blocks
| Feature | RBBB | LBBB |
|---|---|---|
| QRS duration | ≥ 0.12 sec | ≥ 0.12 sec |
| V1 morphology | rSR' ("rabbit ears"/ M-shaped) | Broad rS or QS |
| V6 morphology | qRS with wide S | Broad monophasic R, no Q |
| Mnemonic | WiLLiaM MaRRoW (W in V1, M in V6 = LBBB; M in V1, W in V6 = RBBB) | Same mnemonic |
| ST/T changes | Discordant (opposite to QRS direction) | Discordant |
| Axis | Normal or RAD | Normal or LAD |
| Significance | Often benign; new RBBB can indicate PE, RV strain | Significant - rules out STEMI interpretation; new LBBB = possible ACS |
Memory trick - "WiLLiaM MaRRoW":
- LBBB: W in V1, M in V6 (= "WilLiam")
- RBBB: M in V1, W in V6 (= "MaRRow")
3.6 Ventricular Arrhythmias
Premature Ventricular Contractions (PVCs)
- Wide, bizarre QRS (> 0.12 sec), not preceded by a P wave
- Followed by full compensatory pause (SA node not reset)
- T wave opposite in polarity to QRS
- If PVCs appear every other beat = bigeminy; every 3rd beat = trigeminy; consecutive pairs = couplets
Ventricular Tachycardia (VT)
- Rate: > 100 bpm (usually 140-250), wide QRS (> 0.12 sec)
- AV dissociation (P waves march through independently) = diagnostic of VT
- Fusion beats (sinus + ventricular = hybrid QRS) = diagnostic of VT
- Capture beats (sinus impulse successfully captures ventricle = narrow QRS amid wide ones) = diagnostic of VT
The algorithm below - from Goldman-Cecil Medicine - is the definitive clinical tool for distinguishing wide-QRS tachycardia VT from SVT with aberrancy:
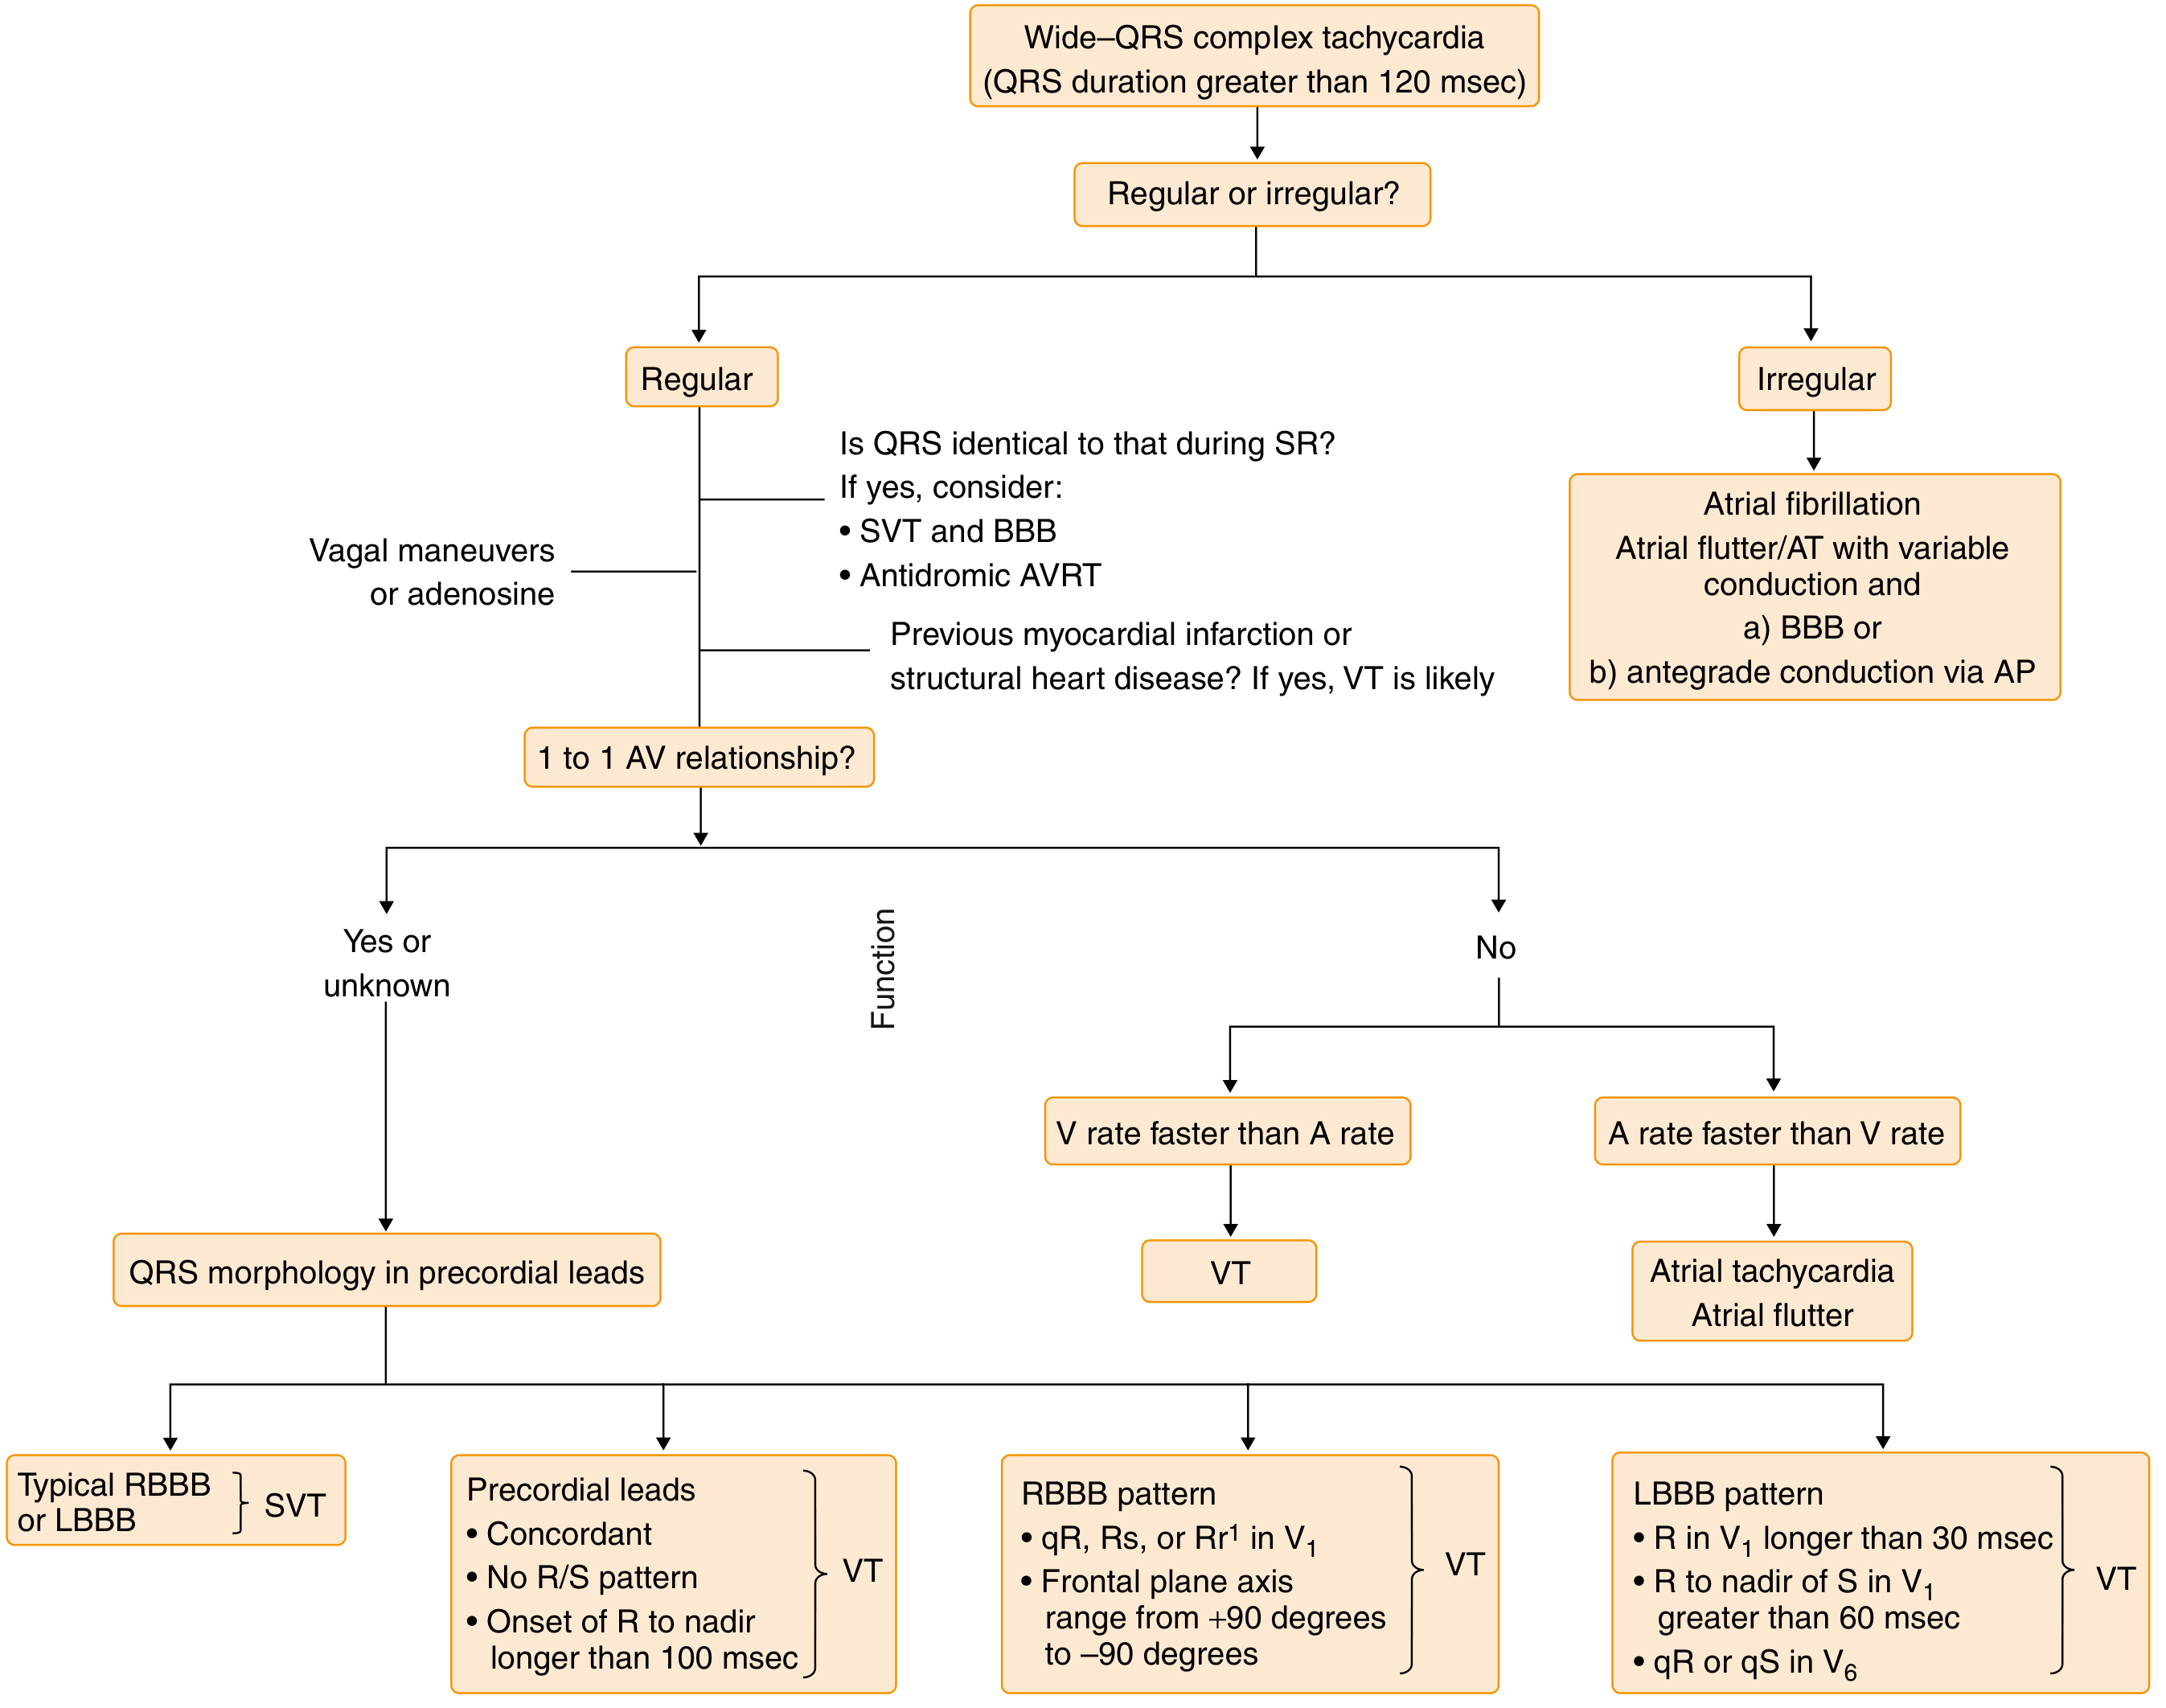
FIGURE - ECG algorithm for diagnosis of wide-complex tachycardias. Key decision points: regularity, AV relationship, QRS morphology in precordial leads. (Goldman-Cecil Medicine)
Ventricular Fibrillation (VF)
- Completely chaotic, disorganized electrical activity
- No identifiable QRS complexes, P waves, or T waves
- "Coarse" VF = larger amplitude; "fine" VF = nearly flat
- Immediately life-threatening; requires immediate defibrillation
PART 4 - ISCHEMIA AND INFARCTION
4.1 The ECG Progression of STEMI
Ischemia → Injury → Infarction follows a predictable ECG sequence:
Stage 1 (Minutes): Hyperacute T waves
- Tall, peaked, symmetric T waves (often first sign)
Stage 2 (Hours): ST elevation
- Convex ("tombstone") ST elevation ≥ 1 mm in limb leads, ≥ 2 mm in precordial leads in ≥ 2 contiguous leads
- Reciprocal ST depression in opposite leads
Stage 3 (Hours-Days): Q waves develop
- Pathological Q waves: > 1 mm wide or > 25% of QRS height
Stage 4 (Days-Weeks): T-wave inversion
- T waves invert in the leads showing ST elevation
Stage 5 (Weeks-Months): Normalization or persistent Q waves
- Q waves may persist indefinitely (scar)
4.2 STEMI by Territory
Below is a real 12-lead ECG of an anterior STEMI (Rosen's Emergency Medicine):
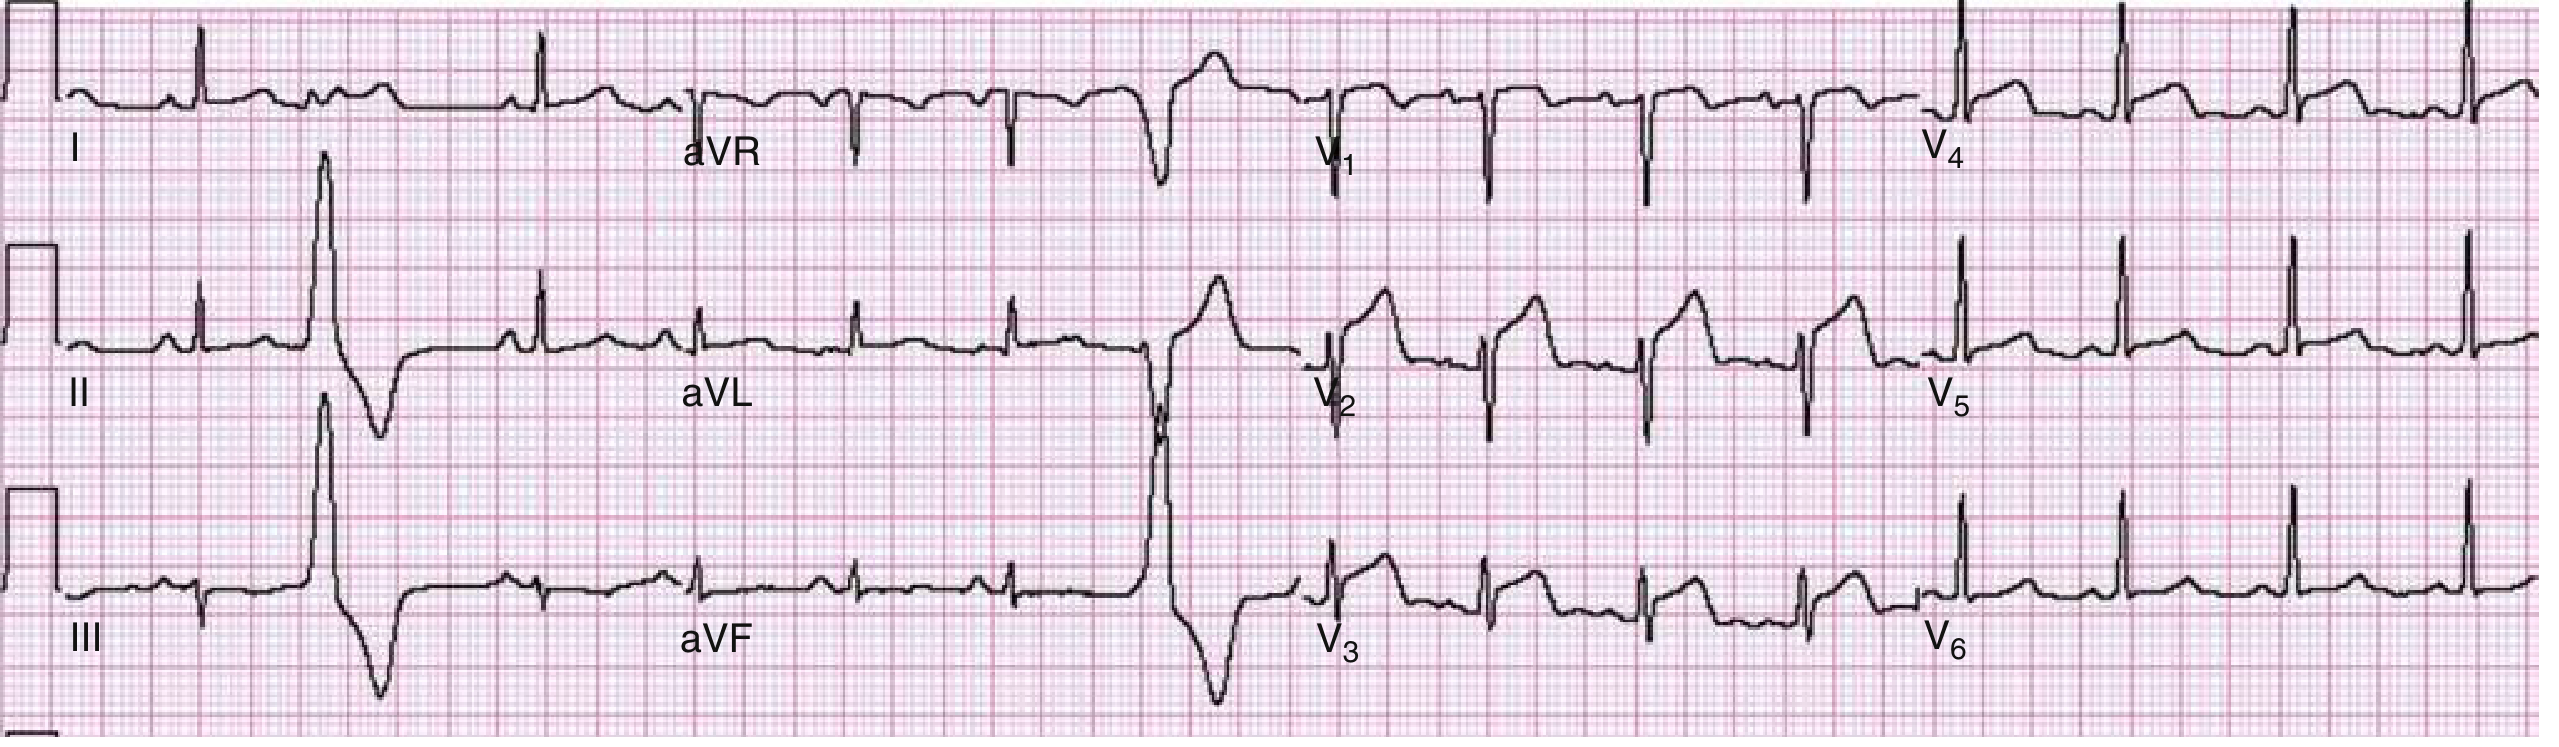
FIGURE - Anterior wall STEMI. ST elevation in V1-V4 with straight/oblique morphology. 90% LAD stenosis confirmed on catheterization. (Rosen's Emergency Medicine)
And an anterolateral STEMI involving V2-V6, I, and aVL:
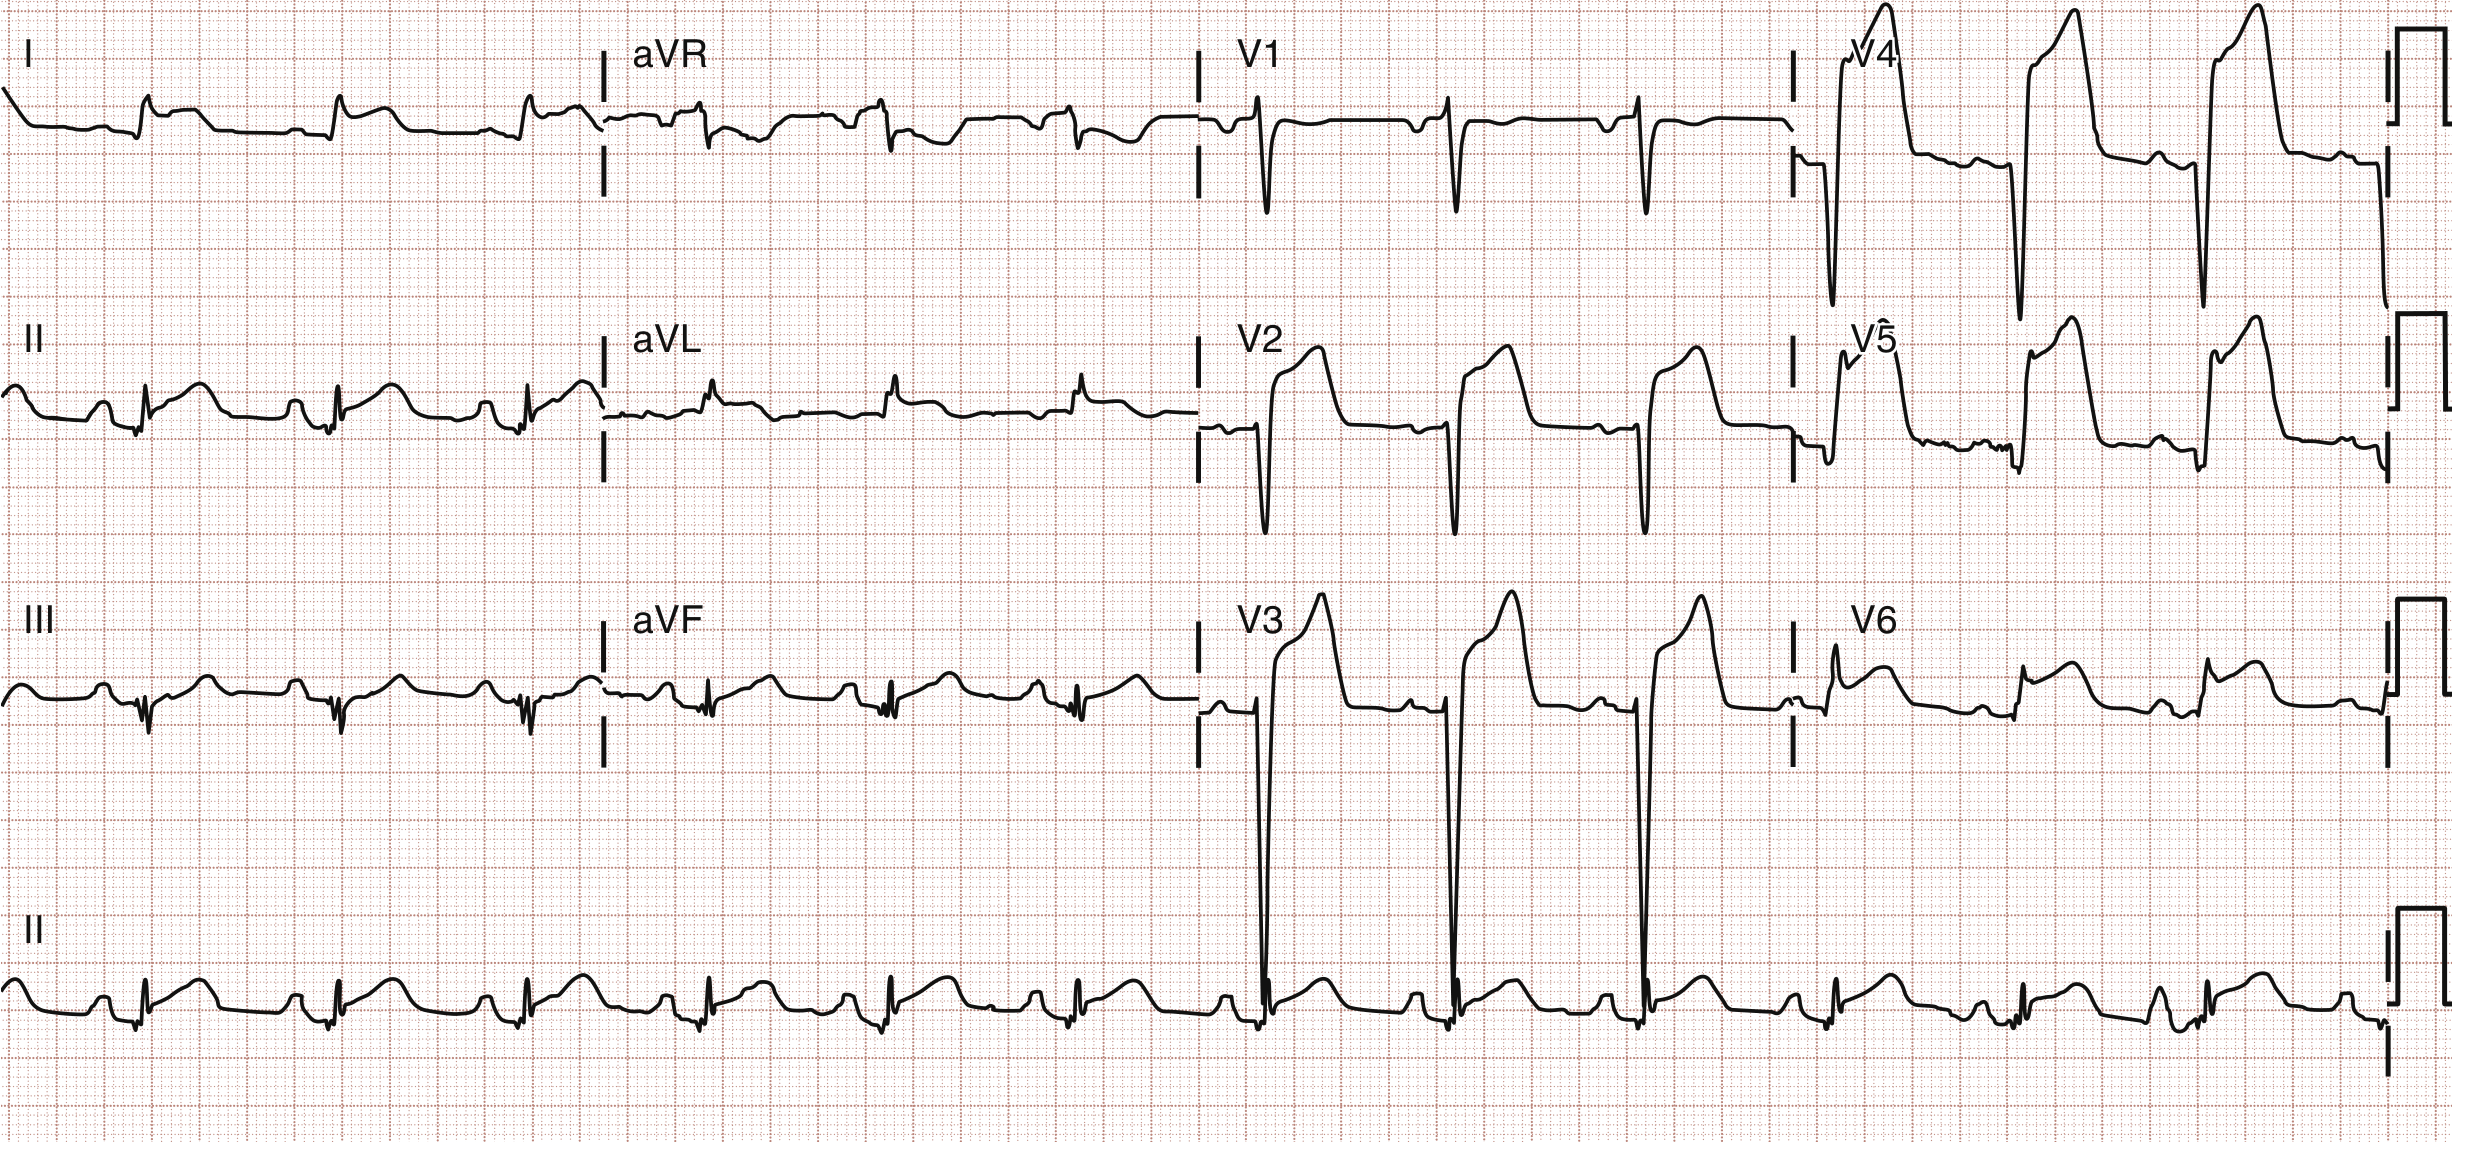
FIGURE - Anterolateral STEMI. STE in V2-V6, I, and aVL. 100% in-stent LAD thrombosis on catheterization. (Rosen's Emergency Medicine)
| Infarct Location | Leads with Changes | Artery |
|---|---|---|
| Anterior | V1-V4 | LAD |
| Anterolateral | V1-V6, I, aVL | LAD or LCx |
| Lateral | I, aVL, V5-V6 | LCx |
| Inferior | II, III, aVF | RCA (80%) / LCx |
| Posterior | Tall R and ST depression V1-V2 (mirror test) | RCA or LCx |
| Right ventricular | ST elevation in V3R-V4R, inferior ST elevation | RCA proximal |
| Left main/proximal LAD | ST elevation in aVR + diffuse ST depression | Left main or proximal LAD |
4.3 Special STEMI Patterns
de Winter Pattern (proximal LAD occlusion without classic STE):
- Upsloping ST depression with tall, peaked T waves in precordial leads V1-V6
- ST elevation in aVR
- Treat as STEMI equivalent
Wellens' Syndrome (proximal LAD critical stenosis, pain-free):
- Type A: Biphasic T waves (upright then inverted) in V2-V3
- Type B: Deep symmetric T wave inversions in V2-V3
- Do NOT stress test; high risk for massive anterior MI
Sgarbossa Criteria (STEMI in LBBB):
- Concordant ST elevation ≥ 1 mm in leads with positive QRS (+5 points)
- Concordant ST depression ≥ 1 mm in V1-V3 (+3 points)
- Discordant ST elevation ≥ 5 mm (+2 points)
- Score ≥ 3 = high specificity for acute MI
PART 5 - HYPERTROPHY
Left Ventricular Hypertrophy (LVH)
Voltage criteria (any one sufficient with appropriate clinical context):
- Sokolow-Lyon: S in V1 + R in V5 or V6 > 35 mm
- Cornell: R in aVL + S in V3 > 28 mm (men) or > 20 mm (women)
- R in aVL > 11 mm
- Strain pattern: ST depression and T-wave inversion in V5-V6, I, aVL (lateral "strain")
Right Ventricular Hypertrophy (RVH)
- Tall R wave in V1 (R > S in V1)
- Right axis deviation (> +90°)
- ST depression and T-wave inversion in V1-V4 (right "strain")
- Causes: pulmonary hypertension, cor pulmonale, severe pulmonary stenosis, PE (acute)
PART 6 - METABOLIC AND DRUG CHANGES
Hyperkalemia (progressive changes with rising K+)
| K+ Level | ECG Changes |
|---|---|
| 5.5-6.5 mEq/L | Tall, peaked, "tented" T waves |
| 6.5-7.5 mEq/L | Widened QRS, prolonged PR, flattened P waves |
| > 7.5 mEq/L | Absent P waves, "sine wave" pattern |
| > 9 mEq/L | VF or asystole |
Hypokalemia
- Flattened T waves
- U waves become prominent (U > T in same lead)
- ST depression
- Prolonged QU interval (often misread as long QT)
Hypercalcemia
- Shortened QT interval
- Short ST segment
Hypocalcemia
- Prolonged QT interval (long ST segment)
Digoxin effect (not toxicity)
- "Reverse tick" or "sagging" ST depression (scooped ST depression)
- Shortened QT
- T-wave flattening or inversion
Digoxin toxicity
- Any arrhythmia, especially PAT with block, junctional tachycardia, bidirectional VT
- PVCs (bigeminy very common)
PART 7 - OTHER IMPORTANT CONDITIONS
Pericarditis
Stage I (acute): Diffuse concave ("saddle-shaped") ST elevation in nearly all leads except aVR and V1 (where ST is depressed). PR depression is pathognomonic.
Key differentiator from STEMI: In pericarditis, STE is diffuse (not in a single vascular territory), concave (not convex), and PR depression is present.
Stage II-IV: ST normalizes → T-wave inversion → normalization.
Pulmonary Embolism
Classic (but not universal) ECG findings:
- S1Q3T3: S wave in lead I, Q wave and T-wave inversion in lead III
- Sinus tachycardia (most common finding)
- New RBBB or right heart strain pattern
- T-wave inversions in V1-V4
- Right axis deviation
Brugada Syndrome
- Type 1 (diagnostic): Coved ST elevation ≥ 2 mm with T-wave inversion in V1-V2 (unprovoked or with sodium channel blockers)
- Type 2: Saddle-back ST elevation in V1-V2 (not diagnostic alone)
- Associated with sudden cardiac death from VF in structurally normal hearts
- More common in males, South/Southeast Asians
Long QT Syndrome
- QTc > 450 ms (men), > 470 ms (women), or > 500 ms (high risk)
- Risk of torsades de pointes (polymorphic VT)
- Causes: congenital (LQTS1, 2, 3) or acquired (drugs - quinidine, sotalol, erythromycin, antipsychotics; hypokalemia, hypomagnesemia)
Hypothermia
- Osborn (J) wave: Positive deflection at the J-point (junction of QRS and ST segment), best seen in inferior and lateral leads
- Shivering artifact
- Bradycardia, prolonged intervals
- Osborn wave size correlates with depth of hypothermia
PART 8 - QUICK REFERENCE SUMMARY TABLE
| Condition | Rate | Rhythm | P Waves | PR | QRS | ST/T |
|---|---|---|---|---|---|---|
| Normal sinus | 60-100 | Regular | Upright, before each QRS | 0.12-0.20 | Narrow <0.12 | Normal |
| Sinus tachycardia | >100 | Regular | Normal | Normal | Normal | Normal |
| AF | Variable | Irregularly irregular | No P (fibrillatory baseline) | None | Narrow (usually) | Variable |
| Atrial flutter | ~150 (with 2:1) | Regular or variable | Sawtooth 300/min | Variable | Narrow | Variable |
| SVT/AVNRT | 150-250 | Regular | Buried/retrograde | None visible | Narrow | Normal |
| 1st-degree AV block | Normal | Regular | Normal | >0.20 sec | Normal | Normal |
| Mobitz I (Wenckebach) | Normal | Regularly irregular | Normal | Progressive lengthening then drop | Normal | Normal |
| Mobitz II | Normal | Regularly irregular | Normal | Constant, then QRS drops | Normal/wide | Normal |
| 3rd-degree block | Slow | Regular (but dissociated) | Normal atrial rate | Completely dissociated | Wide (escape) or narrow | Normal |
| RBBB | Normal | Regular | Normal | Normal | ≥0.12, rSR' in V1, wide S in V6 | Discordant T |
| LBBB | Normal | Regular | Normal | Normal | ≥0.12, broad R in V6, QS in V1 | Discordant T |
| STEMI | Variable | Any | Normal | Normal | May have Q waves | ST elevation, convex |
| NSTEMI/UA | Variable | Any | Normal | Normal | Normal | ST depression/T inversion |
| LVH | Normal | Regular | May be enlarged | Normal | Tall voltage | Lateral strain |
| Hyperkalemia | Slow if severe | Variable | Tall peaked T first, then P disappears | Prolonged | Widened | Tall T, then sine wave |
| VT | >100 | Regular | Dissociated | None | Wide ≥0.12 | Discordant |
| VF | - | Chaotic | None | None | No QRS | Chaotic |
PART 9 - CLINICAL MEMORY AIDS
Rate calculation: 300 ÷ (number of large boxes between R waves) = rate in bpm
Axis quick rule: "If I and aVF are both up → normal axis. I up, aVF down → LAD. I down, aVF up → RAD."
Bundle branch block mnemonic: WiLLiaM MaRRoW - LBBB = W in V1, M in V6; RBBB = M in V1, W in V6
AV blocks mnemonic: "1st degree = PR prolonged, everyone gets through. 2nd degree = some are dropped. 3rd degree = none get through."
STEMI localization: "Inferior = II, III, aVF; Anterior = V1-V4; Lateral = I, aVL, V5-V6"
Hyperkalemia progression: "Peaked T → Wide QRS → No P → Sine wave → Death"
Key reference for further reading: The step-by-step approach above is derived from Boron & Boulpaep's Medical Physiology, Braunwald's Heart Disease, Goldman-Cecil Medicine, Rosen's Emergency Medicine, and Frameworks for Internal Medicine. For video-based learning, this Ninja Nerd lecture is an excellent companion:
Explain structure of heart with diagram
Reading File
This is a Visual + Broad query. Let me search headings and paragraphs in parallel for heart structure content and images.
Finding Sources
Finding Sources
Searching the Web
heart structure anatomy chambers valves diagram labeled
Finding Sources
Finding Sources
Loading Image
Loading Image
Reading File
Reading File
Finding Sources
Finding Sources
Reading File
Reading File
Reading File
Loading Image
Loading Image
Loading Image
Finding Sources
Finding Sources
Reading File
Reading File
Loading Image
Loading Image
I now have all the diagrams and textbook content needed. Here is the complete guide.
Structure of the Heart
Sources: Goldman-Cecil Medicine, Gray's Anatomy for Students, Histology: A Text and Atlas (Ross & Pawlina), Costanzo Physiology, Guyton & Hall Textbook of Medical Physiology, Robbins & Kumar Pathologic Basis of Disease, Grainger & Allison's Diagnostic Radiology
1. Overview and Location
The heart is a hollow, muscular organ roughly the size of a fist, located in the middle mediastinum of the thoracic cavity. It sits obliquely - about two-thirds to the left of the midline - between the lungs, resting on the diaphragm and behind the sternum. It weighs approximately 250-350 g in adults.
The heart has:
- A base (broad top, facing upward and to the right) - where the great vessels attach
- An apex (pointed tip, facing downward and to the left) - at approximately the 5th intercostal space in the midclavicular line
2. The Pericardium - Outer Covering
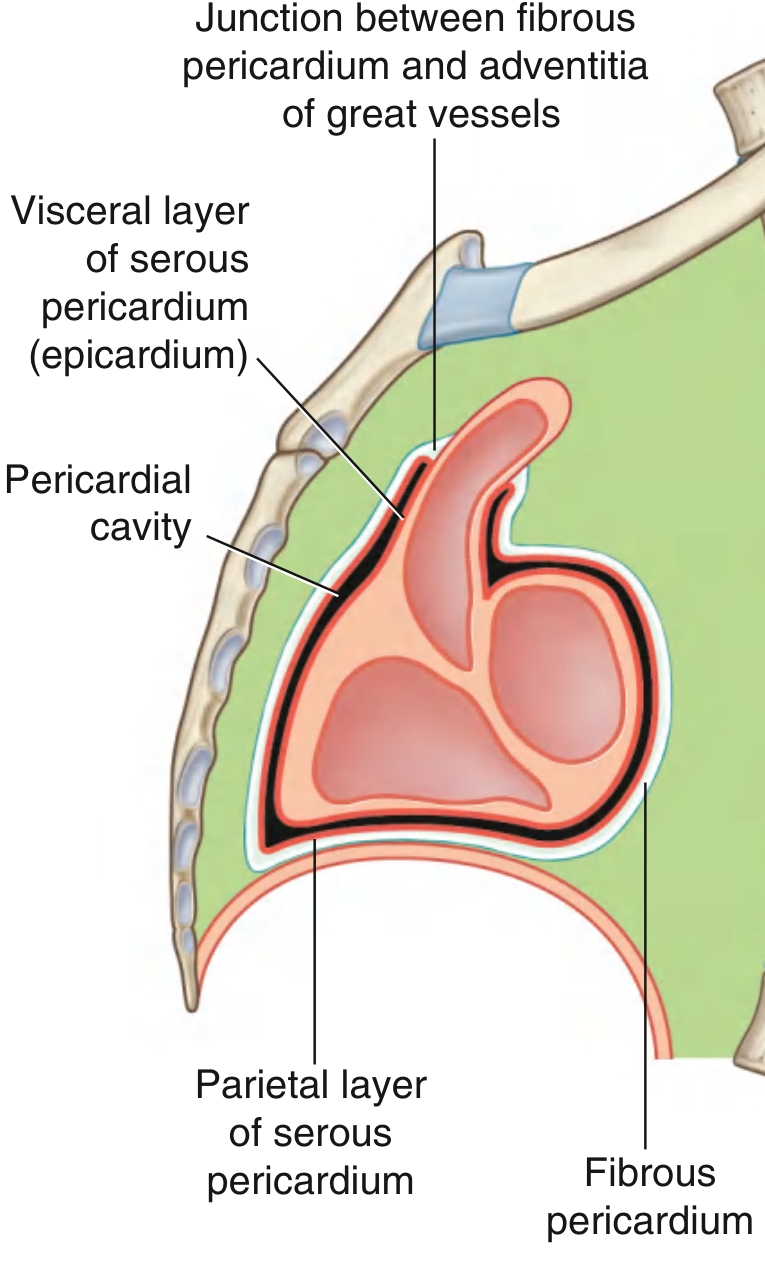
FIGURE - Sagittal section of the pericardium showing fibrous pericardium, parietal serous layer, visceral serous layer (epicardium), and pericardial cavity. (Gray's Anatomy for Students)
The heart is enclosed in a double-walled sac called the pericardium, which has two distinct components:
Fibrous Pericardium
- Outermost, tough connective tissue layer
- Cone-shaped bag with its base on the diaphragm, apex continuous with the adventitia of the great vessels
- Attached to the posterior sternum by sternopericardial ligaments
- Prevents cardiac overdistention and keeps the heart in position in the thoracic cavity
Serous Pericardium
A thin, dual-layered membrane inside the fibrous pericardium:
| Layer | Description |
|---|---|
| Parietal layer | Lines the inner surface of the fibrous pericardium |
| Visceral layer (Epicardium) | Adheres directly to the heart surface |
| Pericardial cavity | Narrow potential space between the two layers, normally contains up to 50 mL of serous fluid |
The fluid lubricates the moving surfaces, allowing the heart to beat without friction. When fluid accumulates pathologically (pericardial effusion), it can compress the heart causing cardiac tamponade.
3. The Wall of the Heart - Three Layers
The heart wall itself, from outside in, consists of three layers:
| Layer | Position | Composition |
|---|---|---|
| Epicardium | Outer (= visceral pericardium) | Mesothelium + connective tissue + adipose tissue; contains coronary vessels |
| Myocardium | Middle | Cardiac muscle (cardiomyocytes) - the actual pumping tissue |
| Endocardium | Inner | Endothelium + subendothelial connective tissue + conducting system cells |
(Histology: A Text and Atlas, Ross & Pawlina)
The myocardium is the thickest layer. The left ventricle has the thickest myocardium (~8-12 mm) because it pumps blood against the high resistance of the systemic circulation. The right ventricle wall is thinner (~3-5 mm) because it pumps only to the lungs at lower pressure.
4. The Four Chambers

FIGURE - Cross-section of the heart showing all four chambers (right atrium, right ventricle, left atrium, left ventricle), four valves (tricuspid, pulmonary, mitral, aortic), major vessels, and the sinoatrial node. (NHLBI)
The heart is divided into four chambers - two atria (upper, thin-walled) and two ventricles (lower, thick-walled). The right and left sides are separated by the septum (interatrial septum above, interventricular septum below), so right-sided (deoxygenated) blood and left-sided (oxygenated) blood never mix in a normal heart.
Right Atrium (RA)
- Thin-walled receiving chamber
- Receives deoxygenated blood from the body via:
- Superior vena cava (from head, neck, arms)
- Inferior vena cava (from trunk, legs, abdominal organs)
- Coronary sinus (venous drainage from heart muscle itself)
- Contains the fossa ovalis - a depression on the interatrial septum, remnant of the foramen ovale (fetal opening between atria)
- Contains the SA node at the junction of the right atrial appendage and superior vena cava
- Contains the AV node in the floor of the right atrium near the interatrial septum
Right Ventricle (RV)
- Triangular in shape, anteriorly positioned (directly behind the sternum)
- More trabeculated (muscular ridges) inner wall than the left
- Contains a moderator band (carrying bundle branch fibers)
- Has a muscular outflow tract called the infundibulum (conus arteriosus)
- Pumps blood to the lungs via the pulmonary trunk (low-pressure circuit)
- Separated from the RA by the tricuspid valve
- Separated from the pulmonary artery by the pulmonary valve
Left Atrium (LA)
- Thin-walled, located posteriorly behind the right atrium
- Receives oxygenated blood from the lungs via four pulmonary veins (two right, two left)
- Has a narrow, tubular left atrial appendage (important site for thrombus formation in AF)
- The mitral valve separates it from the left ventricle
Left Ventricle (LV)
- Thickest-walled chamber - the primary pump of the body
- Positioned posteriorly and to the left
- Smooth septum (no trabeculae in contrast to RV)
- Contains papillary muscles (anterolateral and posteromedial) connected to valve leaflets via chordae tendineae
- Has a membranous and muscular interventricular septum dividing it from the RV
- Pumps blood to the entire body via the aorta (high-pressure circuit)
- Separated from the LA by the mitral valve
- Separated from the aorta by the aortic valve
5. The Four Heart Valves
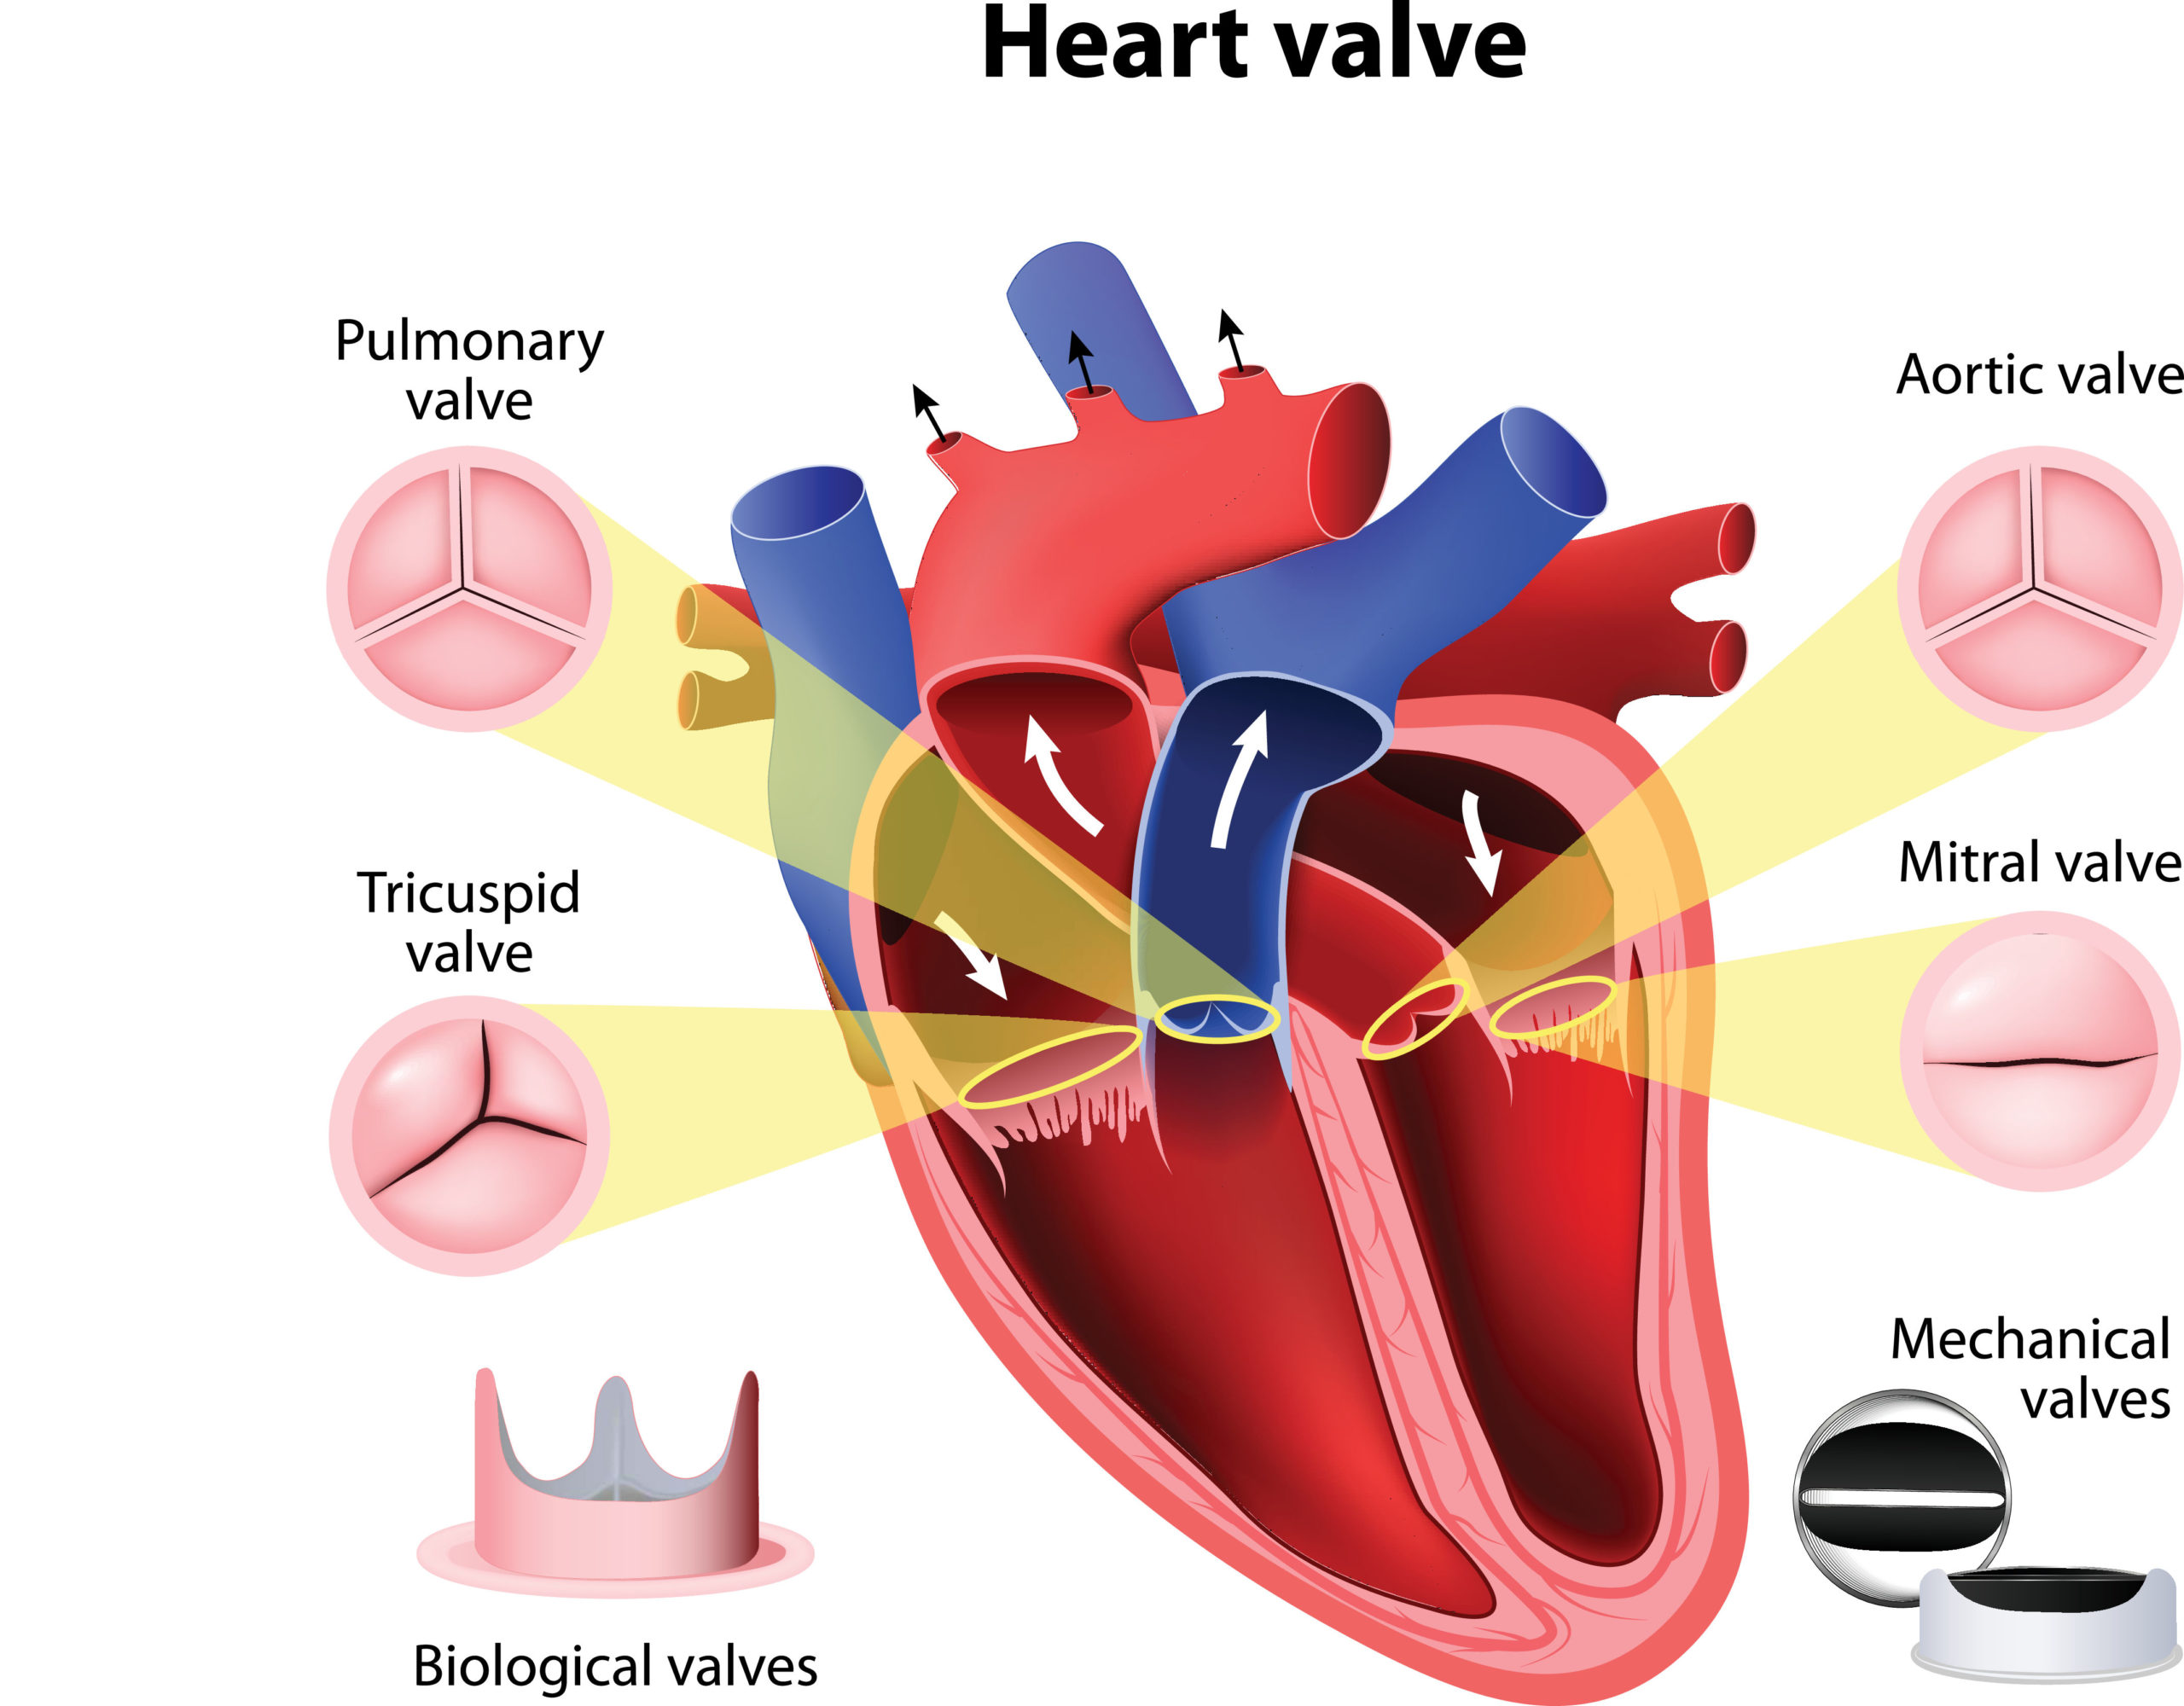
FIGURE - The four heart valves with their leaflet/cusp morphology shown in close-up: tricuspid (3 cusps), pulmonary (3 cusps), mitral (bicuspid, 2 cusps), aortic (3 cusps).
Valves ensure one-way blood flow through the heart. They open passively due to pressure gradients and close to prevent backflow.
| Valve | Location | Type | Leaflets/Cusps | Prevents |
|---|---|---|---|---|
| Tricuspid | Between RA and RV | AV valve | 3 leaflets | Regurgitation from RV → RA |
| Pulmonary | Between RV and pulmonary trunk | Semilunar | 3 cusps | Regurgitation from pulmonary artery → RV |
| Mitral (Bicuspid) | Between LA and LV | AV valve | 2 leaflets (anterior + posterior) | Regurgitation from LV → LA |
| Aortic | Between LV and aorta | Semilunar | 3 cusps | Regurgitation from aorta → LV |
AV Valves (Tricuspid and Mitral)
- Connected to papillary muscles via chordae tendineae ("heartstrings")
- During ventricular contraction, papillary muscles also contract, pulling the chordae taut - this prevents the leaflets from prolapsing backward into the atria (preventing regurgitation)
- Opening is driven by pressure difference between atria and ventricles during diastole
Semilunar Valves (Pulmonary and Aortic)
- Each cusp is shaped like a half-moon (semilunar)
- Have three pockets (sinuses) - blood fills these pockets during diastole, pushing cusps together to close the valve
- No papillary muscles or chordae tendineae
Valve Wall Layers (Histology)
Heart valve leaflets consist of three layers:
- Fibrosa - dense collagen, load-bearing layer
- Spongiosa - loose connective tissue, acts as shock absorber
- Ventricularis (semilunar valves) or Atrialis (AV valves) - elastic tissue facing blood flow
(Histology: A Text and Atlas, Ross & Pawlina)
6. Blood Flow Through the Heart
The complete pathway of blood through the heart:
Body (deoxygenated blood)
↓
Superior + Inferior Vena Cava
↓
RIGHT ATRIUM → [Tricuspid Valve] → RIGHT VENTRICLE
↓
[Pulmonary Valve] → Pulmonary Trunk → Lungs
↓
Pulmonary Veins (oxygenated blood)
↓
LEFT ATRIUM → [Mitral Valve] → LEFT VENTRICLE
↓
[Aortic Valve] → Aorta → Body
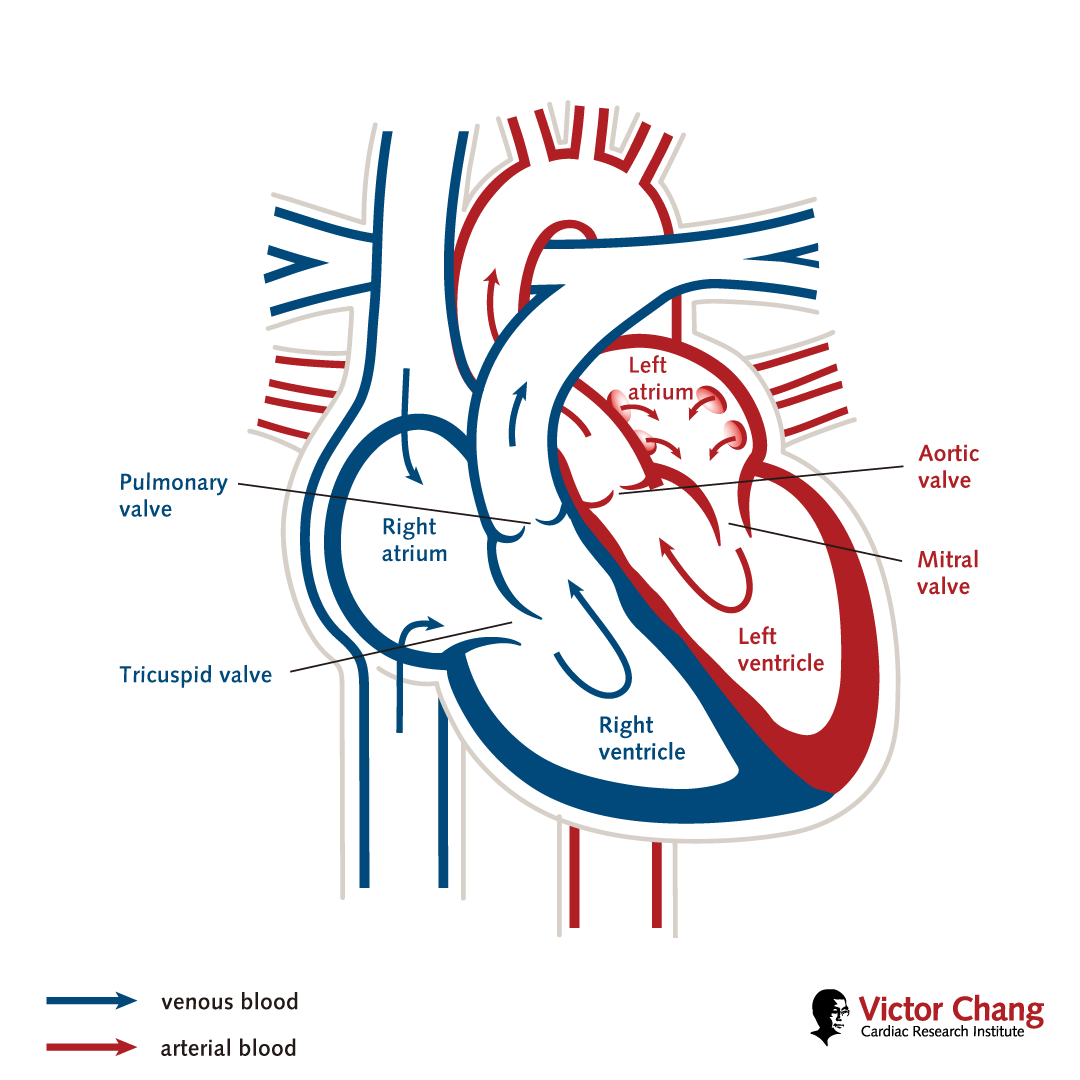
FIGURE - Schematic showing venous (blue) and arterial (red) blood flow through all four chambers and four valves. (Victor Chang Cardiac Research Institute)
7. The Cardiac Conduction System
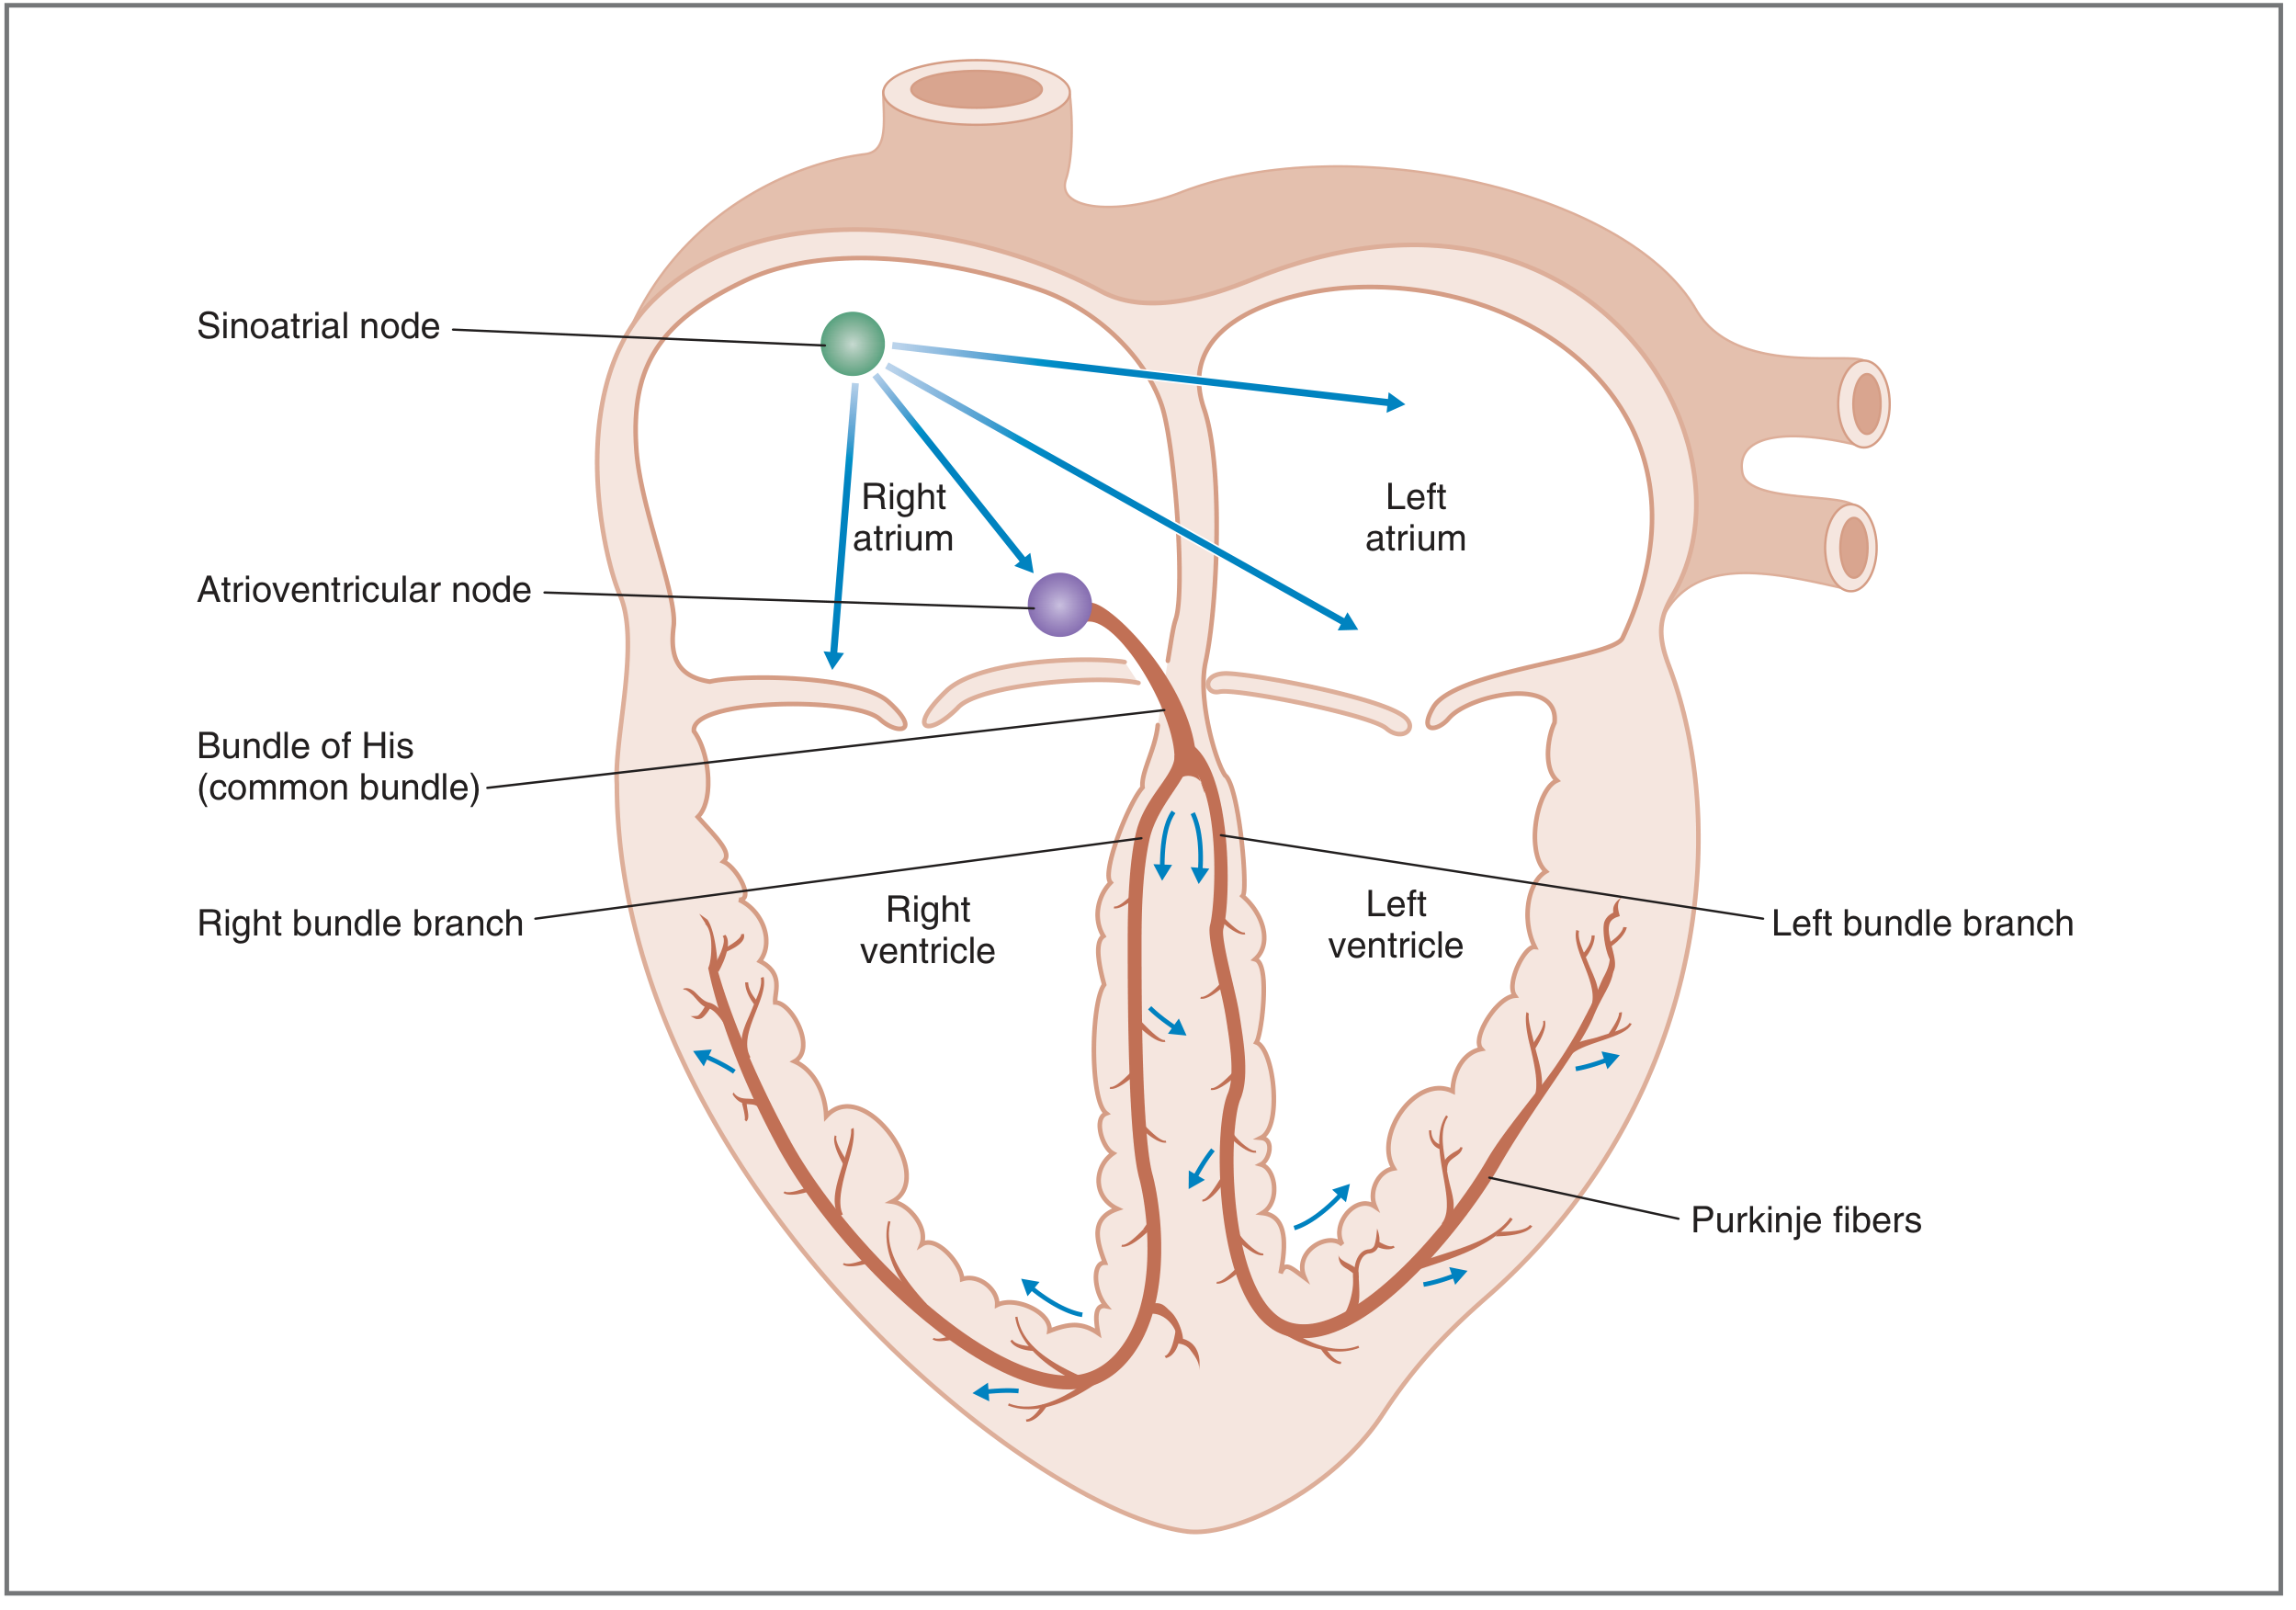
FIGURE - The cardiac conduction system: electrical impulse originates in the SA node and spreads through the atria to the AV node, then down the Bundle of His, right and left bundle branches, and Purkinje fiber network to activate the ventricles. (Costanzo Physiology)
The electrical conduction system consists of modified cardiac myocytes that can depolarize spontaneously. (Robbins & Kumar Pathologic Basis of Disease)
| Component | Location | Intrinsic Rate | Function |
|---|---|---|---|
| SA node | Junction of right atrial appendage and superior vena cava | 60-100/min | Primary pacemaker - initiates each heartbeat |
| Internodal tracts | Through right atrium | - | Conduct impulse from SA → AV node |
| AV node | Right atrium along interatrial septum | 40-60/min | "Gatekeeper" - delays signal ~0.1 sec to allow atrial emptying before ventricular contraction |
| Bundle of His | Connects right atrium to ventricular septum | 40-60/min | Conducts from AV node to ventricles |
| Right bundle branch | Right side of interventricular septum | 20-40/min | Activates right ventricle |
| Left bundle branch | Left side of interventricular septum | 20-40/min | Activates left ventricle (divides into anterior and posterior fascicles) |
| Purkinje fibers | Ventricular walls | 20-40/min | Final rapid distribution throughout ventricular myocardium |
Why does the SA node dominate? All conduction cells can fire spontaneously, but the SA node fires fastest (60-100/min), so it always depolarizes before other pacemakers can fire - it sets the pace for the whole heart. If the SA node fails, the AV node takes over (slower), and if that fails, ventricular escape rhythm takes over (even slower).
The AV node's deliberate slowing of the impulse ensures atria finish contracting and ventricles fully fill before ventricular contraction begins. (Costanzo Physiology)
8. Coronary Blood Supply
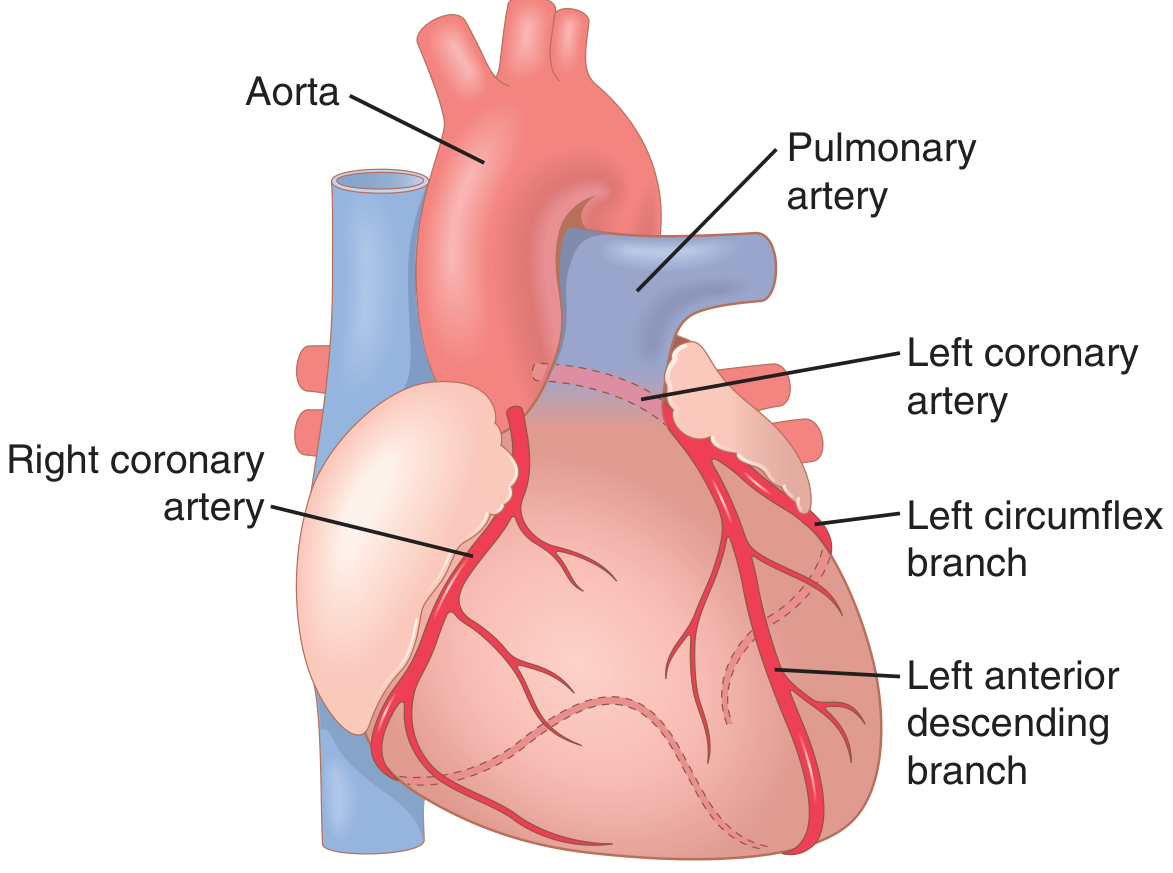
FIGURE - Coronary artery anatomy: RCA on the right, LCA dividing into LAD and left circumflex branch on the left. (Guyton & Hall Textbook of Medical Physiology)
The heart muscle receives its own blood supply from the coronary arteries, which originate from the aortic sinuses (pockets) just above the aortic valve cusps.
| Artery | Territory Supplied |
|---|---|
| Right coronary artery (RCA) | Right ventricle (free wall), posterior left ventricle (80-90% of people), SA node (60%), AV node (80%) |
| Left anterior descending (LAD) | Anterior left ventricle, anterior 2/3 of interventricular septum, apex |
| Left circumflex (LCx) | Lateral and posterior left ventricle, SA node (40%), AV node (20%) |
Key points:
- Coronary arteries course along the epicardial surface first, then penetrate the myocardium
- Blood flows predominantly during diastole (not systole), because during systole the contracting myocardium compresses the intramural vessels
- Resting coronary blood flow ≈ 225 mL/min (4-5% of cardiac output)
- During heavy exercise, coronary flow can increase 3-4 fold
- Venous drainage: most of the LV drains via the coronary sinus → right atrium; RV drains via small anterior cardiac veins → directly into right atrium
(Guyton & Hall Textbook of Medical Physiology)
9. Summary Table - Heart Chambers at a Glance
| Feature | Right Atrium | Right Ventricle | Left Atrium | Left Ventricle |
|---|---|---|---|---|
| Wall thickness | Thin | Moderate | Thin | Thick (8-12 mm) |
| Inflow vessels | SVC, IVC, Coronary sinus | Via tricuspid valve | 4 pulmonary veins | Via mitral valve |
| Outflow valve | Tricuspid (→ RV) | Pulmonary (→ pulmonary artery) | Mitral (→ LV) | Aortic (→ aorta) |
| Blood type | Deoxygenated | Deoxygenated | Oxygenated | Oxygenated |
| Circuit | Systemic return | Pulmonary | Pulmonary return | Systemic |
| Special structures | SA node, AV node, fossa ovalis | Moderator band, infundibulum, trabeculae | LAA, pulmonary vein ostia | Papillary muscles, thick myocardium |
This is a shared conversation. Sign in to Orris to start your own chat.