
Hep b micro for 5mark
Hepatitis B virus Dane particle structure HBsAg HBcAg DNA genome
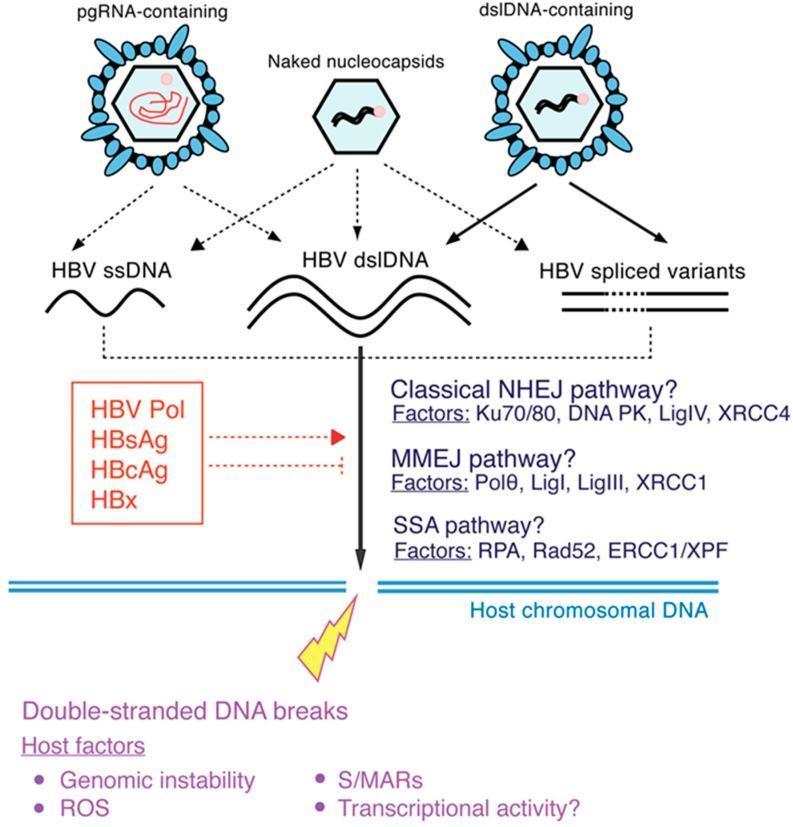
A pathophysiology diagram illustrating the molecular pathways of Hepatitis B Virus (HBV) DNA integration into the host cell genome. The top section depicts different secreted viral forms: pgRNA-containing and dslDNA-containing virions (enveloped) and naked nucleocapsids (non-enveloped). These forms contribute potential molecular substrates for integration, including HBV ssDNA, dslDNA, and spliced variants. The central logic illustrates three cellular double-stranded DNA (dsDNA) repair mechanisms hypothesized to facilitate HBV integration at host DNA break sites: Classical Non-Homologous End Joining (NHEJ), Microhomology-Mediated End Joining (MMEJ), and Single-Stranded Annealing (SSA). Key host enzymes for each pathway are listed, such as Ku70/80 and DNA PK for NHEJ; Polθ and LigI/III for MMEJ; and RPA and Rad52 for SSA. Additional factors contributing to host chromosomal DNA breaks, such as Reactive Oxygen Species (ROS) and genomic instability, are noted. The diagram also mentions viral proteins (Pol, HBsAg, HBcAg, HBx) that may influence these integration processes.
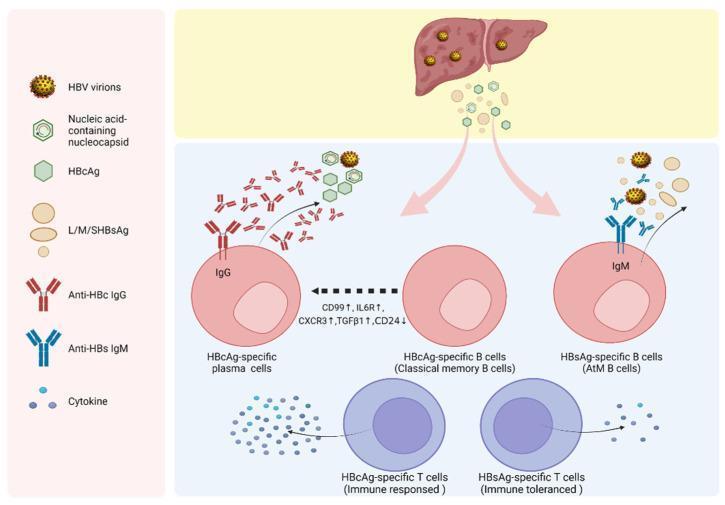
This pathophysiology diagram illustrates the differential immune responses to Hepatitis B core antigen (HBcAg) and surface antigen (HBsAg) in the context of chronic HBV infection. The diagram depicts a liver releasing HBV virions, nucleocapsids, and soluble antigens. The immune response is divided into two distinct pathways: the HBcAg-specific pathway and the HBsAg-specific pathway. In the HBcAg pathway, classical memory B cells differentiate into HBcAg-specific plasma cells, characterized by high expression of CD99, IL6R, CXCR3, and TGFB1, alongside low CD24. These cells actively secrete anti-HBc IgG and stimulate HBcAg-specific T cells, leading to a robust immune response. Conversely, the HBsAg pathway shows HBsAg-specific B cells exhibiting an atypical memory (AtM) phenotype. These cells produce anti-HBs IgM but are associated with HBsAg-specific T cells in a state of immune tolerance, characterized by reduced cytokine production. The visual highlights how high levels of surface antigens contribute to B-cell dysfunction and T-cell exhaustion compared to the more activated core-antigen response.
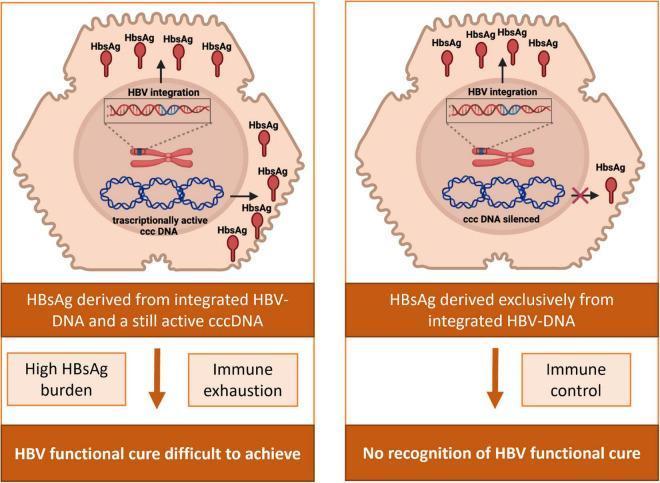
This pathophysiology diagram compares two hepatocytes illustrating the impact of Hepatitis B Virus (HBV) DNA integration on HBsAg production and functional cure assessment. Both cells show a nucleus containing integrated HBV-DNA within host chromosomes. The left panel depicts an active HBV reservoir with transcriptionally active cccDNA (covalently closed circular DNA). In this state, HBsAg (red teardrop icons) is derived from both integrated DNA and cccDNA, leading to a high HBsAg burden, immune exhaustion, and difficulty achieving a functional cure. The right panel shows a silenced HBV reservoir where cccDNA is inhibited (marked with a red X). However, HBsAg continues to be produced and secreted exclusively from the integrated HBV-DNA. This persistence of HBsAg, despite silenced cccDNA, may allow for immune control but hampers the clinical recognition of a functional cure. The diagram uses a cellular model to highlight how viral integration maintains antigen levels independently of the primary viral reservoir, posing challenges for diagnostic monitoring in chronic hepatitis B.
Hepatitis B Virus (HBV) - Microbiology (5 Marks)
1. Classification & Morphology
- Family: Hepadnaviridae; the complete virion is called the Dane particle
- Size: 42 nm spherical enveloped virus (the nucleocapsid/core is 27 nm)
- Genome: Partially double-stranded (relaxed circular) DNA, ~3200 nucleotides - the smallest known human DNA virus
- Has 4 open reading frames (ORFs): S (surface), C (core), P (polymerase), X (HBx protein - transcriptional activator)
- Four major serotypes: adr, adw, ayr, ayw based on HBsAg determinants; 10 genotypes (A-J)
2. Structural Components & Antigens
| Antigen | Location | Significance |
|---|---|---|
| HBsAg (Surface Ag) | Outer lipid envelope | Marker of active infection; 22 nm spherical/filamentous forms found in excess in serum |
| HBcAg (Core Ag) | Nucleocapsid | Found in nucleus of hepatocytes; NOT detected in serum directly |
| HBeAg (e Antigen) | Secreted from infected hepatocytes | Low-mol-weight glycoprotein; marker of active viral replication and high infectivity |
| HBx protein | - | Transcriptional activator; role in hepatocellular carcinoma (HCC) |
| DNA Polymerase | Nucleocapsid | Has reverse transcriptase + RNase H activity (unique for a DNA virus) |
Note: Aggregates of HBsAg in spherical (22 nm) and filamentous forms circulate in blood in huge numbers - up to 10¹⁰ particles/mL.
3. Replication Cycle (Unique Feature - Reverse Transcription)
- Virion attaches to hepatocyte surface and is uncoated
- Partially ds DNA is converted to covalently closed circular DNA (cccDNA) in the nucleus - this is the key replication template and persistence reservoir
- cccDNA is transcribed into a 3.5 kb pregenomic RNA (pgRNA)
- pgRNA is encapsidated with HBcAg
- Viral reverse transcriptase copies pgRNA into negative-strand DNA (with RNase H degrading the RNA)
- Positive-strand DNA synthesis begins but remains incomplete (hence "partial ds DNA" in mature virion)
- Cores bud from pre-Golgi membranes acquiring HBsAg-containing envelope and exit the cell - OR are re-imported into the nucleus to amplify cccDNA pool
4. Pathogenesis
- Transmission: Parenteral (blood/blood products), sexual, vertical (mother-to-child) - NOT fecal-oral
- Incubation period: 60-150 days (average 90 days)
- Liver damage is immune-mediated - CD8+ cytotoxic T cells kill infected hepatocytes; circulating immune complexes cause extrahepatic manifestations (serum sickness, rash, arthritis, glomerulonephritis)
- Anti-HBs antibody = protective; correlates with recovery
- ~10% of adults develop chronic infection; >90% if perinatal transmission
- Chronic HBV → cirrhosis → Hepatocellular Carcinoma (HCC) (via HBx protein integration)
5. Serology - Interpretation of Markers
| Marker | Acute | Chronic | Resolved | Vaccinated |
|---|---|---|---|---|
| HBsAg | + | + | - | - |
| Anti-HBs | - | - | + | + |
| Anti-HBc IgM | + (high titer) | + (low titer) | - | - |
| Anti-HBc IgG | + | + | + | - |
| HBeAg | + | +/- | - | - |
| Anti-HBe | - | +/- | + | - |
| HBV DNA | + | + | - | - |
- Window period: Both HBsAg and Anti-HBs are negative; Anti-HBc IgM is the only positive marker - diagnoses acute HBV
- Pre-core mutant (e-minus mutant): Stop codon at nucleotide 1896 → no HBeAg production, but virus still replicates → HBeAg-negative chronic hepatitis; worse prognosis
- Chronic carrier: HBsAg positive for >6 months
- HBsAg is detectable 2-6 weeks before clinical jaundice appears
6. Stability & Treatment/Prevention
- Extremely stable: survives at 37°C for 60 min, dried at 25°C for 1 week; resistant to UV irradiation
- Destroyed by: 100°C for 1 min; sodium hypochlorite 0.5%
- Treatment (chronic): Pegylated interferon-alpha; nucleoside/nucleotide reverse transcriptase inhibitors - tenofovir (TDF/TAF), entecavir, lamivudine
- Vaccine: Recombinant HBsAg subunit vaccine - given at 0, 1, 6 months; first FDA-approved recombinant vaccine; provides long-term protection; anti-HBs >10 mIU/mL = protective
- HBIG (Hepatitis B Immunoglobulin) for post-exposure prophylaxis (e.g., needlestick, newborns of HBsAg+ mothers)
Lab d
What do you mean by 'Lab d'?
Laboratory Diagnosis of Hepatitis B
Specimens Used
- Serum - for antigens, antibodies, HBV DNA, liver enzymes
- Liver biopsy - for histology, HBcAg/HBsAg by immunofluorescence, cccDNA, and grading of fibrosis
A. Non-Specific Tests (Biochemical)
| Test | Finding |
|---|---|
| Serum ALT / AST | Markedly elevated (hepatocellular damage) |
| Serum Bilirubin | Elevated (conjugated + unconjugated) |
| Prothrombin Time | Prolonged in severe disease |
| Serum Albumin | Low in chronic disease |
These are non-specific - raised in any hepatitis; used to assess severity, not diagnosis.
B. Specific Tests - Serological Markers (Most Important)
1. HBsAg (Hepatitis B Surface Antigen)
- First marker to appear in serum - detectable 2-6 weeks before jaundice
- Detected by ELISA (enzyme-linked immunosorbent assay) - method of choice
- Persistence >6 months = chronic infection
- Its disappearance signals recovery
2. Anti-HBc (Antibody to Core Antigen)
- IgM anti-HBc = marker of acute infection; appears at onset of symptoms; persists ~6 months; only positive marker in the window period
- IgG anti-HBc = past infection (persists for life); present in both resolved and chronic infection; NOT induced by vaccine
- Window period = HBsAg gone, anti-HBs not yet appeared → only IgM anti-HBc is positive - do NOT miss this!
3. HBeAg (Hepatitis B e Antigen)
- Appears shortly after HBsAg; marker of active viral replication and high infectivity
- Seen only when HBsAg is present
- Its replacement by anti-HBe = seroconversion = falling infectivity and start of resolution
4. Anti-HBs (Antibody to Surface Antigen)
- Appears after HBsAg clears (variable gap = window period)
- Protective antibody - correlates with recovery and immunity
- Present after: recovery from natural infection (+ anti-HBc positive) OR vaccination (anti-HBc negative; anti-HBs alone)
- Titer >10 mIU/mL = protective
5. Anti-HBe
- Appears as HBeAg disappears
- Signals start of resolution; declining infectivity
- Persists for years - useful epidemiological marker
- Not protective
C. Serological Course - Acute Self-Limiting Infection
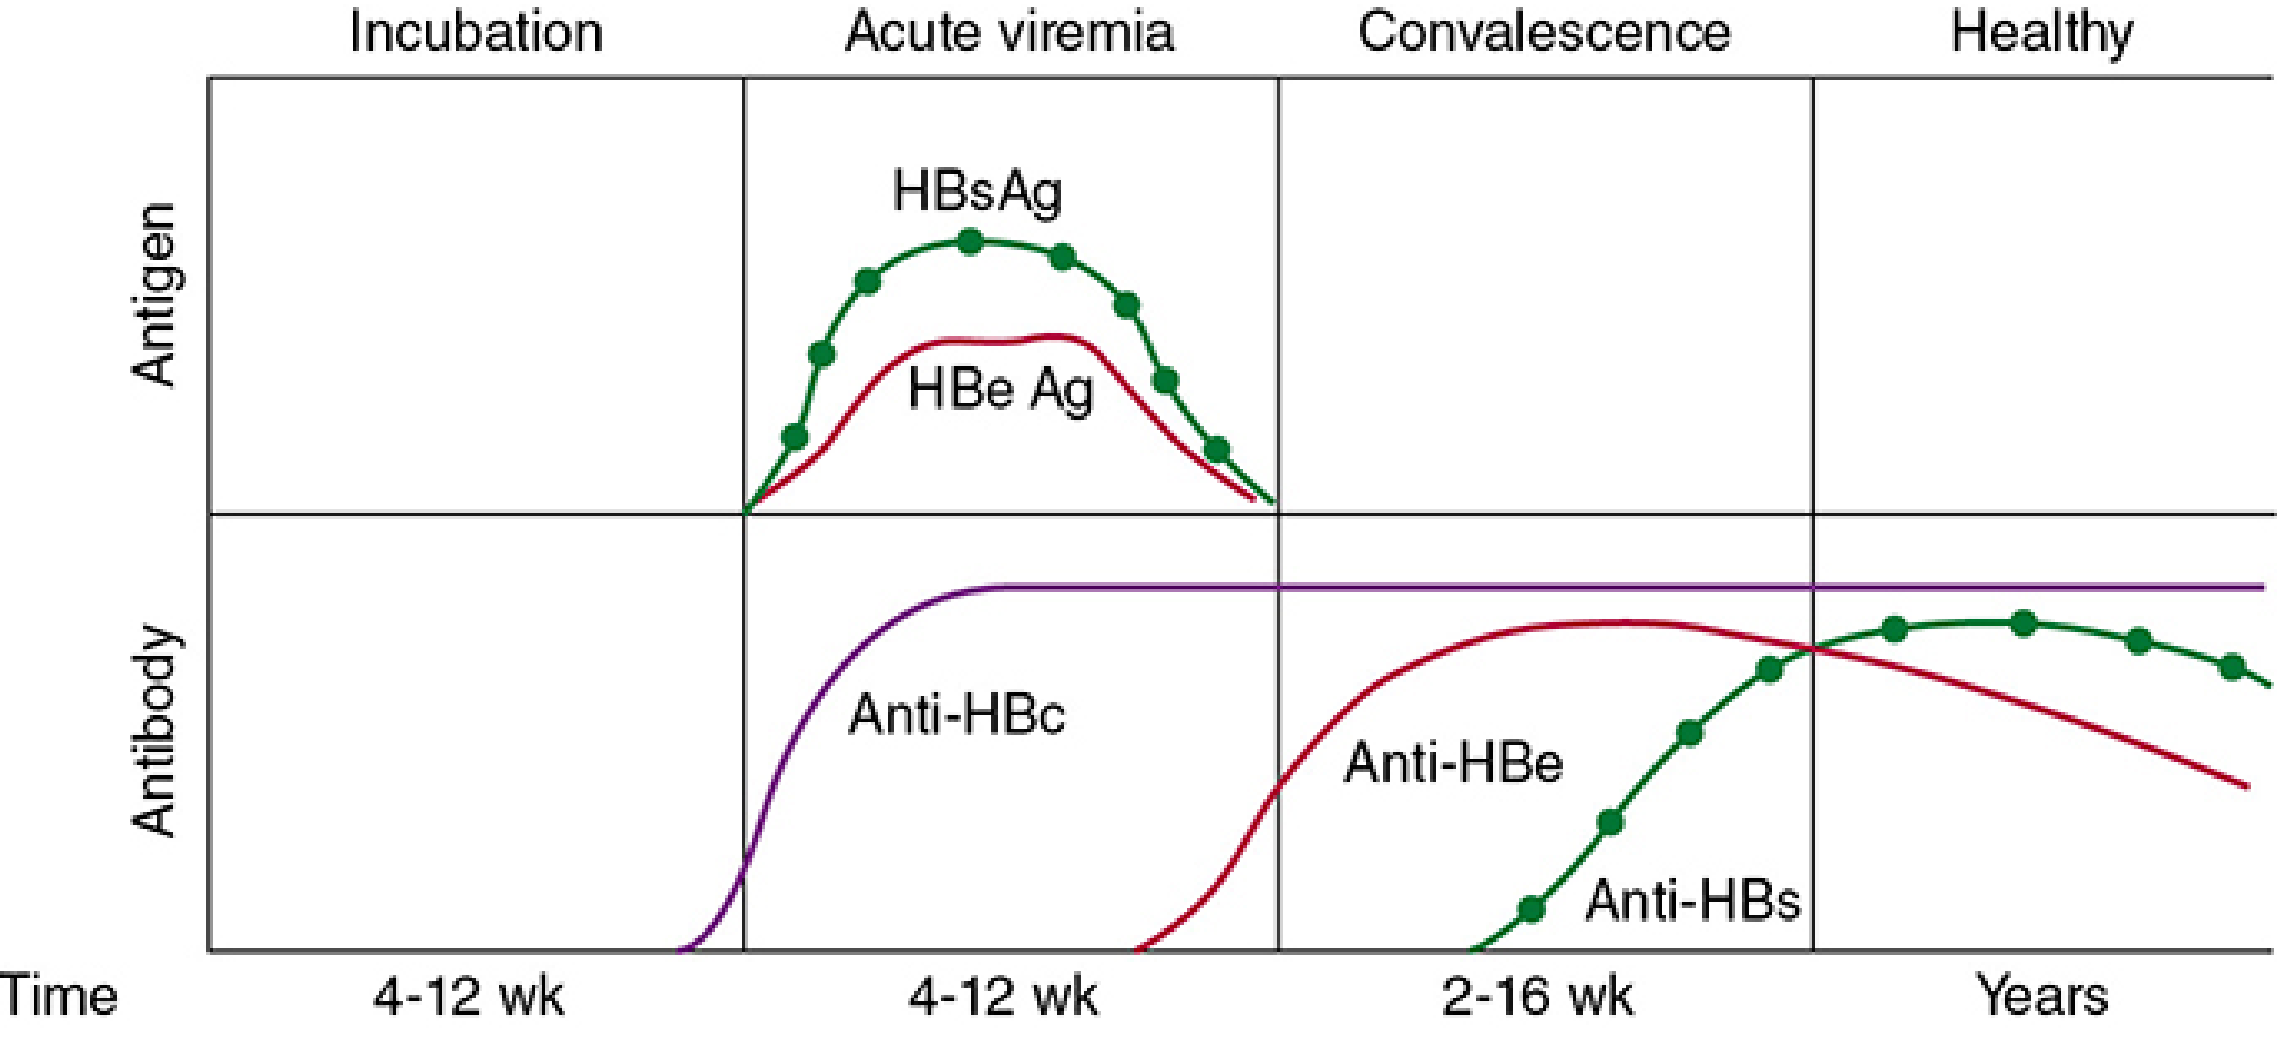
- Incubation (4-12 wk): HBsAg and HBeAg rise; HBV DNA detectable
- Acute viremia (4-12 wk): HBsAg and HBeAg peak; Anti-HBc rises
- Convalescence (2-16 wk): HBsAg/HBeAg fall; Anti-HBe and Anti-HBs appear
- Healthy (years): Anti-HBc (IgG) + Anti-HBs persist
D. Interpretation of Serological Patterns
| HBsAg | Anti-HBs | Anti-HBc | HBeAg | Interpretation |
|---|---|---|---|---|
| + | - | - | +/- | Early acute infection |
| + | - | + (IgM) | + | Acute HBV infection (active replication) |
| + | - | + (IgG) | + | Chronic HBV - high replication |
| + | - | + (IgG) | - | Chronic HBV - low replication |
| - | - | + (IgM) | - | Window period |
| - | + | + (IgG) | - | Past infection, resolved, immune |
| - | + | - | - | Vaccinated (HBsAg vaccine response) |
| - | - | - | - | Never infected; susceptible |
E. Molecular / Virological Tests
| Test | Use |
|---|---|
| HBV DNA (quantitative PCR) | Gold standard for active replication; >1000 IU/mL = risk of progression; monitors antiviral treatment response |
| HBV DNA (qualitative PCR) | Detects occult HBV (HBsAg negative but HBV DNA+) |
| HBV Genotyping | 10 genotypes (A-J); guides treatment (e.g., genotype A responds better to interferon) |
| Pre-core mutant testing | Stop codon mutation at nt 1896 → HBeAg-negative chronic hepatitis; worse prognosis |
| Quantitative HBsAg | Newer test; predicts antiviral efficacy, disease progression, and recovery |
F. Histological Diagnosis (Liver Biopsy)
- "Ground glass" hepatocytes - smooth, eosinophilic cytoplasm packed with HBsAg; pathognomonic of chronic HBV
- Immunofluorescence: HBcAg in nucleus, HBsAg in cytoplasm of hepatocytes
- Grading of inflammation and staging of fibrosis (Metavir/Ishak scoring) guides treatment decisions
- cccDNA detected by Southern blot or PCR in tissue
G. Summary - Quick Diagnostic Approach
| Clinical Situation | Key Test to Order |
|---|---|
| Acute hepatitis - any | HBsAg + IgM anti-HBc |
| Window period suspected | IgM anti-HBc (sole +ve marker) |
| Chronic HBV screen | HBsAg (>6 months) + IgG anti-HBc + HBV DNA |
| Assess infectivity | HBeAg + HBV DNA |
| Post-vaccination check | Anti-HBs titer (>10 mIU/mL = protected) |
| Past infection vs vaccination | Anti-HBc IgG (+ in past infection, - in vaccination) |
| Monitor treatment | Quantitative HBV DNA |
Differnce btn gram + and negative
Differences Between Gram-Positive and Gram-Negative Bacteria
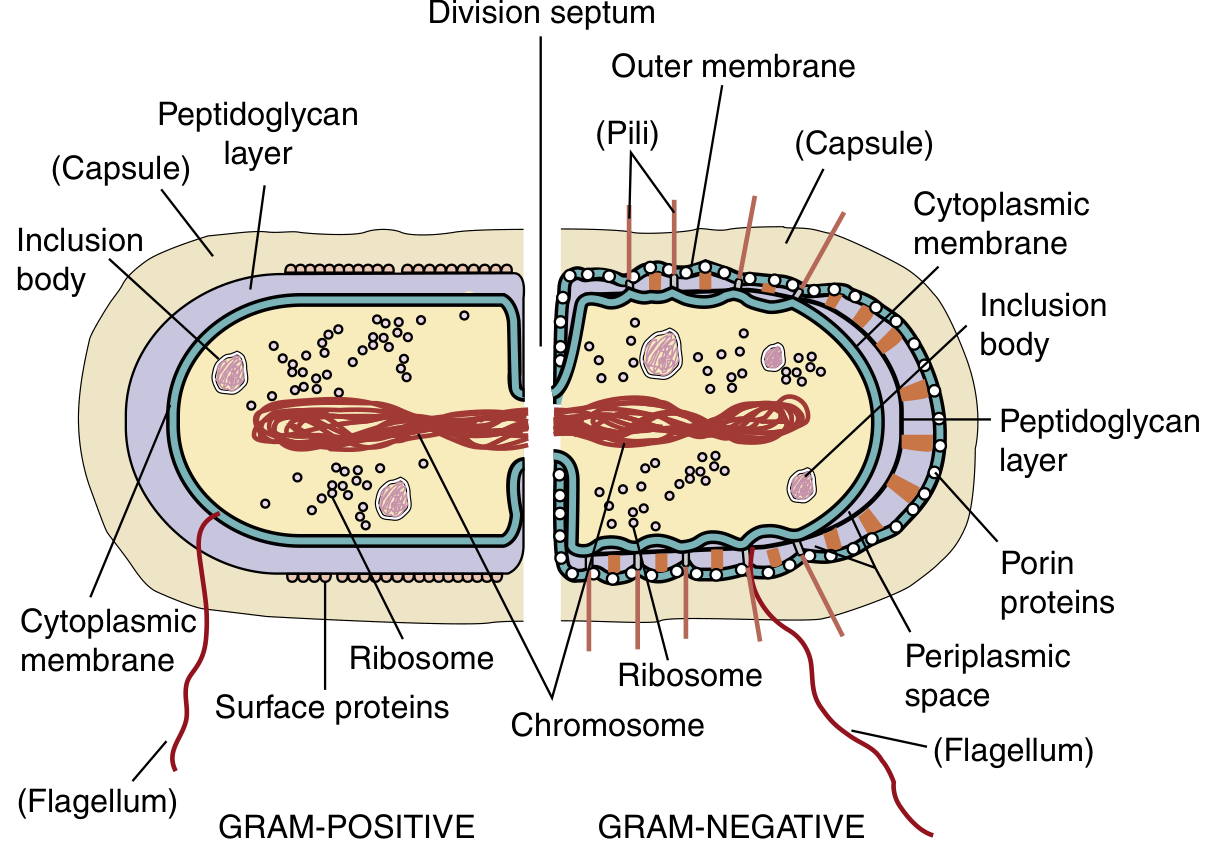
1. Gram Staining Result
| Feature | Gram-Positive | Gram-Negative |
|---|---|---|
| Color after staining | Purple/violet | Pink/red |
| Reason | Thick peptidoglycan traps crystal violet-iodine complex | Thin peptidoglycan + outer membrane - decolorizer washes out crystal violet |
| Counterstain (Safranin) | Not visible (masked by purple) | Taken up - appears red/pink |
The Gram stain was described in 1884 by Danish physician Hans Christian Gram. The decolorizer (acetone-alcohol) extracts the purple iodine-dye complex from Gram-negative cells, while Gram-positive bacteria retain it. An intact cell wall is necessary for a positive Gram reaction.
2. Cell Wall Structure (Most Important Difference)
| Feature | Gram-Positive | Gram-Negative |
|---|---|---|
| Peptidoglycan layer | Thick (150-500 Å), multilayered, ~90% of cell wall | Thin (single layer), ~10% of cell wall |
| Outer membrane | Absent | Present - contains LPS (lipopolysaccharide/endotoxin) |
| Periplasmic space | Absent (or minimal) | Present - between inner and outer membranes; contains enzymes (beta-lactamases, etc.) |
| Teichoic acid | Present (wall teichoic acid + lipoteichoic acid - LTA) | Absent |
| Lipoteichoic acid (LTA) | Present - activates innate immune responses | Absent |
| Porin proteins | Absent | Present in outer membrane - allow passage of small molecules |
| Lipopolysaccharide (LPS) | Absent | Present - major endotoxin; causes fever, septic shock |
3. Cell Wall Components in Detail
Gram-Positive Cell Wall Components:
- Peptidoglycan - multiple layers of glycan chains (GlcNAc + MurNAc) cross-linked by peptide bridges
- Teichoic acid - polyribitol or glycerol phosphate cross-linked to peptidoglycan; strengthens wall; sequesters calcium ions
- Lipoteichoic acid - lipid-anchored teichoic acid; activates innate host immunity (binds TLR-2)
- Surface proteins - bound to peptidoglycan or teichoic acid (e.g., Protein A of S. aureus)
Gram-Negative Cell Wall Components:
- Thin peptidoglycan - one to two layers only
- Periplasmic space - contains transport proteins, degradative enzymes (including beta-lactamases that destroy penicillin)
- Outer membrane - lipid bilayer; acts as barrier to many antibiotics
- LPS (Lipopolysaccharide) - consists of:
- Lipid A (endotoxin - toxic component)
- Core polysaccharide
- O-antigen (outer polysaccharide chain - used for serotyping)
- Porin proteins - channel proteins (e.g., OmpC, OmpF) that allow passage of small hydrophilic molecules
4. Comprehensive Comparison Table
| Feature | Gram-Positive | Gram-Negative |
|---|---|---|
| Gram stain color | Purple | Pink/Red |
| Peptidoglycan | Thick (multilayer) | Thin (single layer) |
| Outer membrane | Absent | Present |
| LPS / Endotoxin | Absent | Present (Lipid A) |
| Teichoic acid | Present | Absent |
| Lipoteichoic acid | Present | Absent |
| Periplasmic space | Absent | Present |
| Porins | Absent | Present |
| Toxins produced | Mainly exotoxins | Mainly endotoxin (LPS); some exotoxins |
| Sensitivity to penicillin | Generally more sensitive | Generally more resistant (outer membrane barrier; beta-lactamases in periplasm) |
| Sensitivity to lysozyme | More susceptible (thick PG is the main target) | Less susceptible (outer membrane protects PG) |
| Sensitivity to detergents | Less sensitive | More sensitive (outer membrane disrupted) |
| Examples | S. aureus, S. pyogenes, S. pneumoniae, Bacillus, Clostridium, Listeria | E. coli, Klebsiella, Pseudomonas, Salmonella, H. influenzae, Neisseria |
5. Clinical Relevance
| Aspect | Gram-Positive | Gram-Negative |
|---|---|---|
| Septic shock mediator | Lipoteichoic acid + peptidoglycan fragments (via TLR-2) | LPS/Lipid A (via TLR-4) - more potent endotoxin |
| Antibiotic resistance mechanism | Beta-lactamase (secreted extracellularly) | Beta-lactamase sequestered in periplasmic space (more efficient); also outer membrane limits drug entry |
| Treatment challenge | MRSA (methicillin-resistant) | Multi-drug resistance (ESKAPE pathogens) |
| Penicillin activity | Works well (targets PG cross-linking; no outer membrane barrier) | Reduced (must penetrate outer membrane) |
| Vancomycin activity | Works (binds D-Ala-D-Ala terminus of PG) | Does NOT work - cannot cross outer membrane |
Innate immunity
innate immunity components diagram cells barriers complement TLR
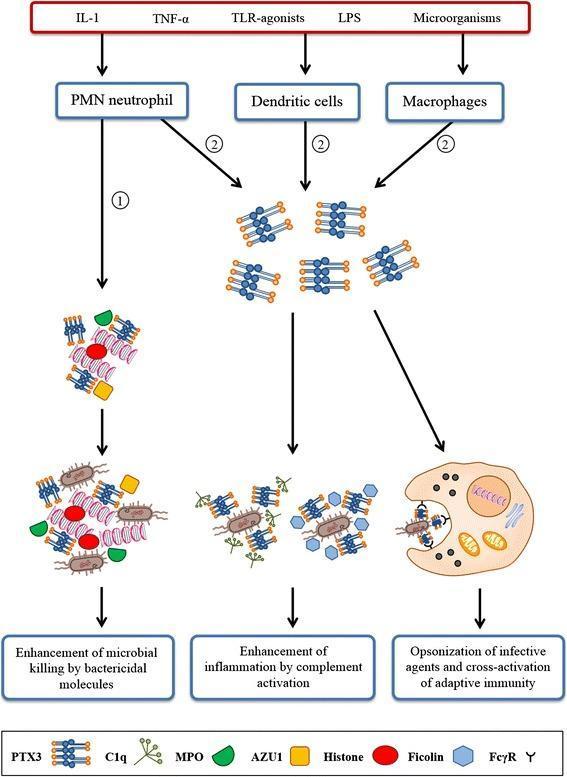
This pathophysiology diagram illustrates the role of Pentraxin 3 (PTX3) in the human innate immune response. The schematic outlines a signaling pathway initiated by pro-inflammatory stimuli, including IL-1, TNF-alpha, TLR-agonists, LPS, and microorganisms. These triggers induce PTX3 release from three primary cell types: PMN neutrophils (via rapid release of stored granules), dendritic cells, and macrophages (via de novo synthesis). The diagram details three distinct downstream effector mechanisms: 1) Integration into Neutrophil Extracellular Traps (NETs) alongside C1q, MPO, AZU1, and histones to enhance microbial killing; 2) Interaction with C1q and Ficolins to trigger complement activation and enhance the inflammatory response; and 3) Opsonization of pathogens to facilitate recognition by Fc gamma receptors (Fc̳R) on phagocytes, promoting microbial clearance and bridging innate and adaptive immunity. Key molecular components are identified in a legend, including PTX3, C1q, MPO, AZU1, Histones, Ficolin, and Fc̳R. This visual is designed for medical education regarding the humoral arm of innate immunity and acute-phase protein functionality.
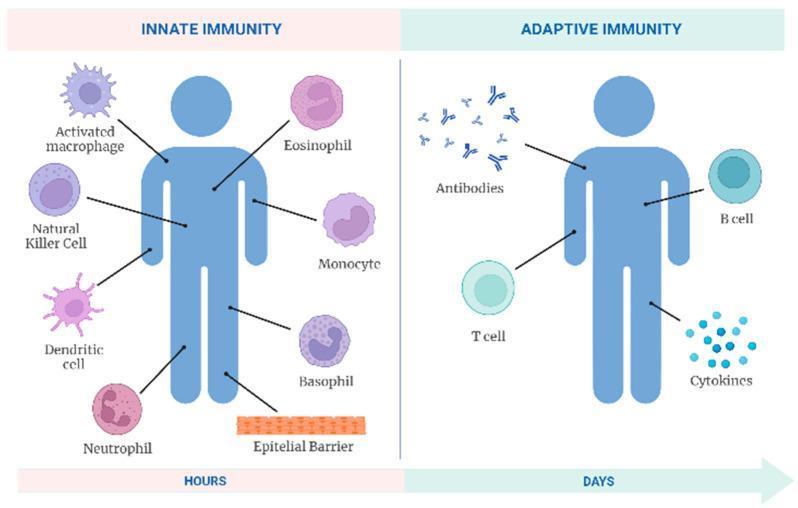
This medical infographic illustrates the cellular and humoral components of the human immune system, divided into 'Innate Immunity' and 'Adaptive Immunity'. The left panel depicts the innate system, highlighting rapid-response elements active within hours. Key components shown include physical epithelial barriers and a variety of leukocytes: activated macrophages (stellate morphology), natural killer cells, dendritic cells (showing characteristic cytoplasmic extensions), neutrophils (with multi-lobed nuclei), eosinophils, monocytes, and basophils. The right panel represents the adaptive system, which develops over days. It features specific lymphocytes—B cells and T cells—alongside humoral factors including Y-shaped antibodies and a signaling network of cytokines. The diagram serves as an educational summary of immunological defense mechanisms, emphasizing the temporal progression from non-specific immediate protection to targeted, long-term memory-based responses.
Innate Immunity
Definition
Key Properties - Comparison with Adaptive Immunity
| Feature | Innate Immunity | Adaptive Immunity |
|---|---|---|
| Onset | Immediate (minutes-hours) | Delayed (days-weeks) |
| Specificity | Broad (recognizes patterns shared by groups of microbes) | Highly specific (distinct epitopes) |
| Memory | None | Yes (faster, stronger on re-exposure) |
| Receptors | Germline-encoded, limited diversity | Somatically rearranged, vast diversity |
| Self-discrimination | Recognizes "danger signals" | Precise self/non-self discrimination |
| Components | Barriers, phagocytes, NK cells, complement, cytokines | T cells, B cells, antibodies |
Components of Innate Immunity
1. Physical and Chemical Barriers (First Line)
| Barrier | Mechanism |
|---|---|
| Skin (epidermis) | Mechanical barrier; low pH (acid mantle); sebaceous gland fatty acids; keratin layer |
| Mucous membranes | Mucus traps microbes; ciliary action (mucociliary escalator) sweeps out pathogens |
| Respiratory tract | Cough/sneeze reflex; mucociliary clearance |
| GI tract | Gastric acid (pH 1-2); bile salts; digestive enzymes; peristalsis |
| Antimicrobial peptides | Defensins produced by epithelial cells and neutrophils; disrupt microbial membranes |
| Lysozyme | In tears, saliva, mucus; cleaves peptidoglycan of bacterial cell walls |
| Lactoferrin | Sequesters iron; bacteriostatic |
| Normal flora | Compete with pathogens for nutrients and attachment sites |
2. Pattern Recognition Receptors (PRRs) - Key Concept
- PAMPs (Pathogen-Associated Molecular Patterns) - structures unique to microbes (e.g., LPS, peptidoglycan, flagellin, viral dsRNA, CpG DNA)
- DAMPs (Damage-Associated Molecular Patterns) - signals from stressed/dying host cells (e.g., HMGB1, ATP, uric acid crystals)
| Receptor Family | Location | Recognizes | Action |
|---|---|---|---|
| Toll-like receptors (TLRs) | Cell surface + endosomes | LPS (TLR4), peptidoglycan (TLR2), dsRNA (TLR3), flagellin (TLR5), CpG DNA (TLR9) | Activates NF-κB → cytokines, co-stimulatory molecules |
| NOD-like receptors (NLRs) | Cytoplasm | Bacterial fragments (NOD1, NOD2); also forms inflammasome (NLRP3) | Inflammasome → caspase-1 → IL-1β, IL-18 |
| RIG-I-like receptors (RLRs) | Cytoplasm | Viral RNA | Type I interferons (IFN-α/β) |
| C-type lectin receptors | Cell surface | Fungal β-glucans, mannose | Phagocytosis, cytokines |
| DNA sensors (cGAS-STING) | Cytoplasm | Cytosolic dsDNA | Type I interferons |
TLR signaling pathway: Ligand binding → TIR domain dimerization → MyD88 adaptor → IRAK → TRAF6 → NF-κB activation → pro-inflammatory cytokines (TNF, IL-1, IL-6, IL-12)
3. Cellular Components
A. Neutrophils (PMNs)
- First cells recruited to infection site (within minutes-hours)
- Phagocytose and kill bacteria via:
- Oxidative burst (NADPH oxidase → superoxide, H₂O₂, HOCl)
- Granule contents (elastase, myeloperoxidase, defensins, lactoferrin)
- NETs (Neutrophil Extracellular Traps) - chromatin + granule proteins that trap bacteria
B. Macrophages
- Tissue-resident sentinels (Kupffer cells in liver, microglia in brain, alveolar macrophages in lungs)
- Key functions:
- Phagocytosis and intracellular killing
- Produce pro-inflammatory cytokines (TNF, IL-1, IL-6, IL-12)
- Antigen presentation to T cells (link to adaptive immunity)
- Produce reactive oxygen species (ROS) and nitric oxide (NO via iNOS)
- Wound healing and tissue repair
C. Dendritic Cells (DCs)
- Present at epithelial surfaces and most tissues - act as "sentinels"
- Capture antigens → process → present to T cells via MHC II
- Critical bridge between innate and adaptive immunity
- Produce large amounts of Type I interferons (plasmacytoid DCs)
D. Natural Killer (NK) Cells
- Large granular lymphocytes; part of innate immunity but are lymphocytes
- Kill virus-infected cells and tumor cells WITHOUT prior sensitization
- Mechanism of recognition - "missing self" hypothesis:
- Normal cells express MHC class I → inhibits NK killing
- Virus-infected/tumor cells downregulate MHC I → NK cells activate and kill
- Kill via: Perforin-granzyme pathway + Fas-FasL interaction
- Produce IFN-γ which activates macrophages
E. Mast Cells and Basophils
- Tissue-resident mast cells (skin, GI, respiratory tract)
- Release histamine, prostaglandins, leukotrienes upon activation
- Important in allergy, parasitic infections, and early inflammation
F. Eosinophils
- Important against parasites (helminths)
- Release toxic granule proteins (MBP, ECP, EPO) that damage parasite membranes
G. Innate Lymphoid Cells (ILCs)
- ILC1 → IFN-γ (intracellular pathogens)
- ILC2 → IL-4, IL-5, IL-13 (helminths, allergy)
- ILC3 → IL-17, IL-22 (extracellular bacteria, fungi)
4. Humoral Components (Plasma Proteins)
A. Complement System
- Three activation pathways:
- Classical pathway - activated by antigen-antibody complexes (C1q)
- Lectin pathway - MBL (mannose-binding lectin) binds microbial mannose
- Alternative pathway - spontaneous C3 hydrolysis on microbial surfaces
- All converge on C3 convertase → C3b (opsonin) → C5 convertase → MAC (membrane attack complex)
- Functions: Opsonization (C3b), Chemotaxis (C3a, C5a), Lysis (MAC/C5b-9), Anaphylatoxins (C3a, C5a cause mast cell degranulation)
B. Acute Phase Proteins
- Produced by liver in response to IL-6, IL-1, TNF
- CRP (C-reactive protein) - binds phosphocholine on bacteria → activates complement + opsonizes
- MBL (Mannose-binding lectin) - activates lectin pathway
- Serum amyloid A - opsonin
- Fibrinogen, ferritin - limit iron availability to bacteria
C. Cytokines and Chemokines
- TNF-α - fever, endothelial activation, septic shock at high levels
- IL-1 - fever ("endogenous pyrogen"), acute phase response
- IL-6 - fever, hepatic acute phase protein production
- IL-12 - activates NK cells; drives Th1 adaptive response
- Type I Interferons (IFN-α/β) - antiviral; induce ISGs (interferon-stimulated genes) in neighboring cells; upregulate MHC I; activate NK cells
- IFN-γ (from NK cells) - activates macrophages (classical activation)
- Chemokines (IL-8/CXCL8) - recruit neutrophils to infection site
5. Inflammation - The Innate Immune Response in Action
- Microbe breaches barrier → recognized by tissue macrophages/DCs via PRRs
- Pro-inflammatory cytokines (TNF, IL-1, IL-6) released
- Endothelial cells upregulate selectins → neutrophil rolling
- Chemokines (IL-8) → neutrophil chemotaxis and firm adhesion (ICAM-1/LFA-1)
- Neutrophils transmigrate → phagocytose and kill microbes
- Complement activated → opsonization, MAC formation
- Resolution OR progression to adaptive immune response
Role of Innate Immunity in Activating Adaptive Immunity
- DCs activated by PRRs upregulate co-stimulatory molecules (B7/CD80/86) → present antigen to naive T cells
- Cytokine environment shapes T-cell differentiation:
- IL-12 + IFN-γ → Th1 (cell-mediated, intracellular pathogens)
- IL-4 → Th2 (antibody, extracellular/parasites)
- IL-6 + TGF-β → Th17 (extracellular bacteria/fungi)
- TGF-β → Tregs (suppression)
- Without innate activation, adaptive immunity is anergic (no co-stimulation = no T-cell activation)
Summary Diagram of Innate Immunity
MICROBE INVADES
      ↓
Barriers broken → PAMPs recognized by PRRs (TLRs, NLRs, RLRs)
      ↓
CELLULAR ARM                    HUMORAL ARM
  Neutrophils                     Complement (C3b opsonin, MAC)
  Macrophages  → Phagocytosis     Acute Phase Proteins (CRP, MBL)
  NK cells     → Kill infected    Cytokines (TNF, IL-1, IL-6)
  DCs          → APC              Interferons (antiviral)
      ↓
INFLAMMATION
      ↓
Bridge to ADAPTIVE IMMUNITY (via DCs + cytokines)