
Guyton & Hall (Cardiac Failure and Body Fluid Regulation chapters Explained in concise manner with diagrams and chart
Reading File
Finding Sources
Finding Sources
Finding Sources
Finding Sources
Finding Sources
Finding Sources
Reading File
Finding Sources
Reading File
Reading File
Reading File
Reading File
Loading Image
Loading Image
Loading Image
Loading Image
I now have all the content needed for a comprehensive, well-illustrated answer. Let me compile it.
Guyton & Hall: Cardiac Failure & Body Fluid Regulation — Concise Notes with Diagrams
Source: Guyton and Hall Textbook of Medical Physiology, 14th Ed.
PART 1: CARDIAC FAILURE (Chapter 22)
1. Overview: What Is Cardiac Failure?
Cardiac failure (heart failure) occurs when the heart cannot pump enough blood to meet the body's metabolic needs. Two core consequences occur immediately:
- Reduced cardiac output - decreased tissue perfusion
- Venous damming - blood backs up, raising venous/atrial pressure
2. Acute Heart Failure - Circulatory Changes
Fig. 22.1 - Progressive changes after acute myocardial infarction:
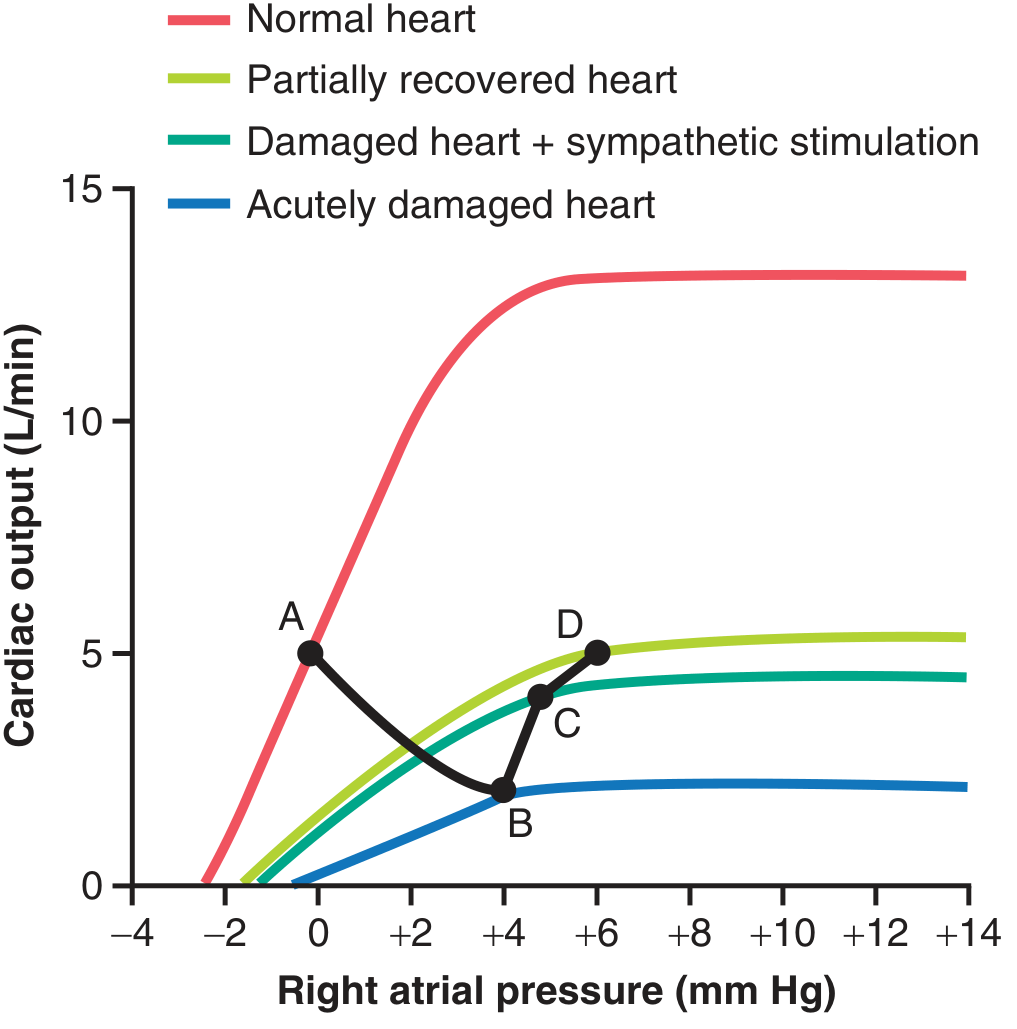
| Point | State | Cardiac Output | Right Atrial Pressure |
|---|---|---|---|
| A | Normal | 5 L/min | 0 mmHg |
| B | Immediately after MI | ~2 L/min | +4 mmHg |
| C | After sympathetic compensation | ~4 L/min | +5 mmHg |
| D | After renal fluid retention (days) | ~5 L/min | +6 mmHg |
Interpretation: The heart progresses from acute depression (B) toward partial recovery through compensatory mechanisms.
3. Compensatory Mechanisms in Heart Failure
A. Immediate - Sympathetic Nervous System (seconds)
- Baroreceptor reflex activated by low BP
- Sympathetic stimulation: strengthens damaged myocardium
- Increases venous tone → raises mean systemic filling pressure from ~7 to 12-14 mmHg
- Heart rate increases
- Peripheral vasoconstriction maintains BP
B. Intermediate - Renal Fluid Retention (hours to days)
- Low cardiac output → decreased renal blood flow
- Kidneys retain salt and water
- Blood volume expands
- Increased venous return shifts operating point up the cardiac function curve
- This is the chronic compensation phase
C. Myocardial Recovery and Hypertrophy (weeks)
- Non-infarcted myocardium hypertrophies
- Cardiac output may recover to near-normal if damage is limited
- Full "compensated heart failure" = normal resting output, but no cardiac reserve
4. Summary: Compensated vs. Decompensated Heart Failure
ACUTE MI
    |
    ↓ Cardiac Output  +  ↑ Venous Pressure
    |
    ├─→ SYMPATHETIC ACTIVATION (seconds)
    │       ↑ HR, ↑ contractility, ↑ venous tone
    │
    ├─→ RENAL FLUID RETENTION (hours–days)
    │       ↑ Blood volume → ↑ venous return
    │
    ├─→ CARDIAC HYPERTROPHY (weeks)
    │       ↑ Pumping power
    │
    ├─→ COMPENSATED HEART FAILURE
    │       Normal CO at rest; No exercise reserve
    │
    └─→ DECOMPENSATED (if fluid retention exceeds cardiac ability)
            Progressive ↑ RAP → Edema → Death
5. Decompensated Heart Failure
When the heart is so weak that extra fluid only raises venous pressure without improving output - a vicious cycle:
- ↑ Venous pressure → ↑ capillary pressure → fluid leaks into interstitium (edema)
- Fluid retention continues → further overload
- Cardiac output falls further
- Death from cardiogenic shock or pulmonary edema
Key marker: The cardiac function curve becomes flat - preload increases no longer raise output.
6. Edema in Heart Failure
Peripheral Edema (Right or Biventricular Failure)
- Long-term renal fluid retention → ↑ blood volume
- ↑ Venous pressure → fluid filtered into interstitium faster than lymphatics can drain
- Location: dependent (ankles, legs)
Pulmonary Edema (Left Heart Failure)
- Left ventricle fails → blood dams in pulmonary circulation
- Pulmonary capillary pressure rises above ~28 mmHg (plasma oncotic pressure)
- Fluid floods alveoli
- Can cause death rapidly - another lethal vicious cycle
| Type | Mechanism | Location |
|---|---|---|
| Right HF | ↑ Systemic venous pressure | Legs, ascites |
| Left HF | ↑ Pulmonary capillary pressure | Lungs |
| Biventricular | Both | Generalized |
7. Unilateral Left Heart Failure
- Left ventricle fails independently
- Blood dams in pulmonary circulation
- Pulmonary edema develops rapidly
- Right ventricle continues pumping blood → worsens pulmonary congestion
- Eventually right heart also fails (biventricular failure)
8. Cardiogenic Shock (Low-Output Cardiac Failure)
A severe form where cardiac output falls to critically low levels:
Vicious Cycle of Deterioration:
↓ Cardiac Output
       ↓
↓ Coronary perfusion pressure
       ↓
Further myocardial ischemia
       ↓
↓ Cardiac Output (further decline)
- Mortality is very high
- Treatment: inotropic agents (dopamine, dobutamine), mechanical support (intra-aortic balloon pump), revascularization
9. Cardiac Reserve
- Normal heart can increase output 4-7x during exercise
- In compensated HF: resting output is normal, but no reserve remains
- Classes of HF by reserve:
| NYHA Class | Symptoms | Cardiac Reserve |
|---|---|---|
| I | None at rest or exertion | Mildly reduced |
| II | Slight limitation on exertion | Moderately reduced |
| III | Marked limitation | Severely reduced |
| IV | Symptoms at rest | Near zero |
10. High-Output Cardiac Failure
Paradoxically elevated CO, yet the body is in "failure":
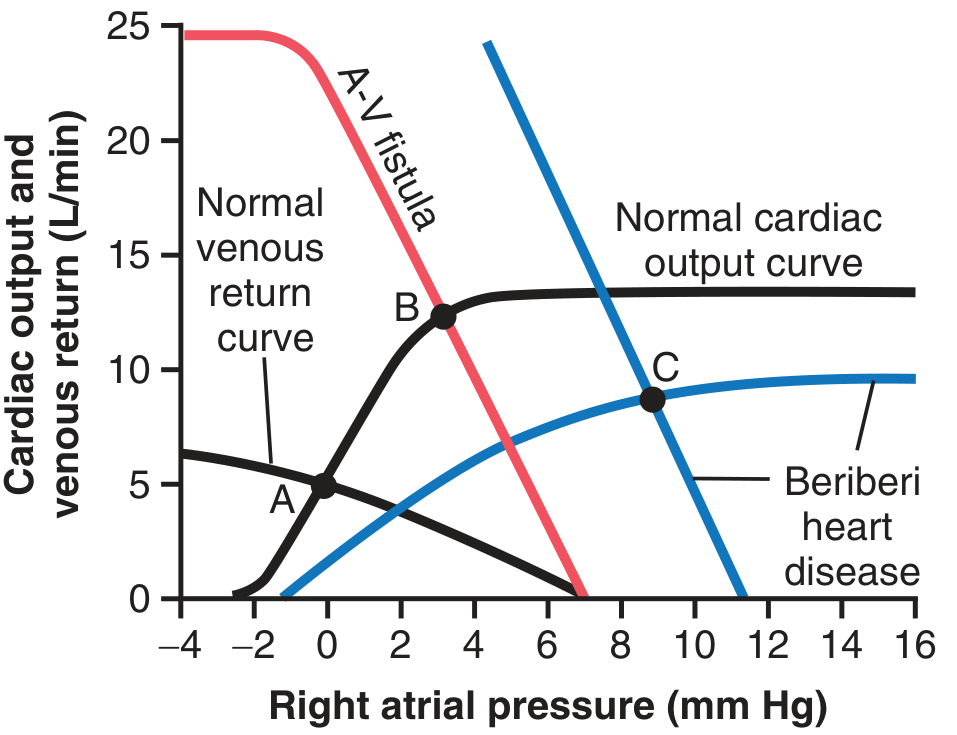
| Cause | Mechanism | CO | Right Atrial Pressure |
|---|---|---|---|
| A-V Fistula | ↓ Systemic vascular resistance → ↑ venous return | ↑↑ (~12.5 L/min) | Mildly elevated |
| Beriberi | Thiamine deficiency → peripheral vasodilation + cardiac weakening + fluid retention | ↑↑ (~65% above normal) | Markedly elevated |
11. Treatment of Heart Failure (Summary)
| Drug Class | Mechanism | Effect |
|---|---|---|
| ACE Inhibitors / ARBs | Block angiotensin II → ↓ renal Na retention | ↓ Fluid overload, ↓ afterload |
| Beta-blockers | ↓ Sympathetic overstimulation | Prevent cardiac remodeling |
| Loop Diuretics (furosemide) | ↑ Na/K/Cl excretion | ↓ Fluid volume, ↓ edema |
| Aldosterone antagonists | Block aldosterone → ↓ Na retention | ↓ Fluid retention |
| Digoxin | ↑ Intracellular Ca²⁺ → ↑ contractility | ↑ Cardiac output |
| ARNI (Sacubitril/Valsartan) | Augment natriuretic peptides + block Ang II | ↓ Mortality in HFrEF |
PART 2: BODY FLUID REGULATION (Chapter 25 & 30)
1. Body Fluid Compartments (Chapter 25)
Fig. 25.1 - Body fluid compartment diagram (70 kg male):
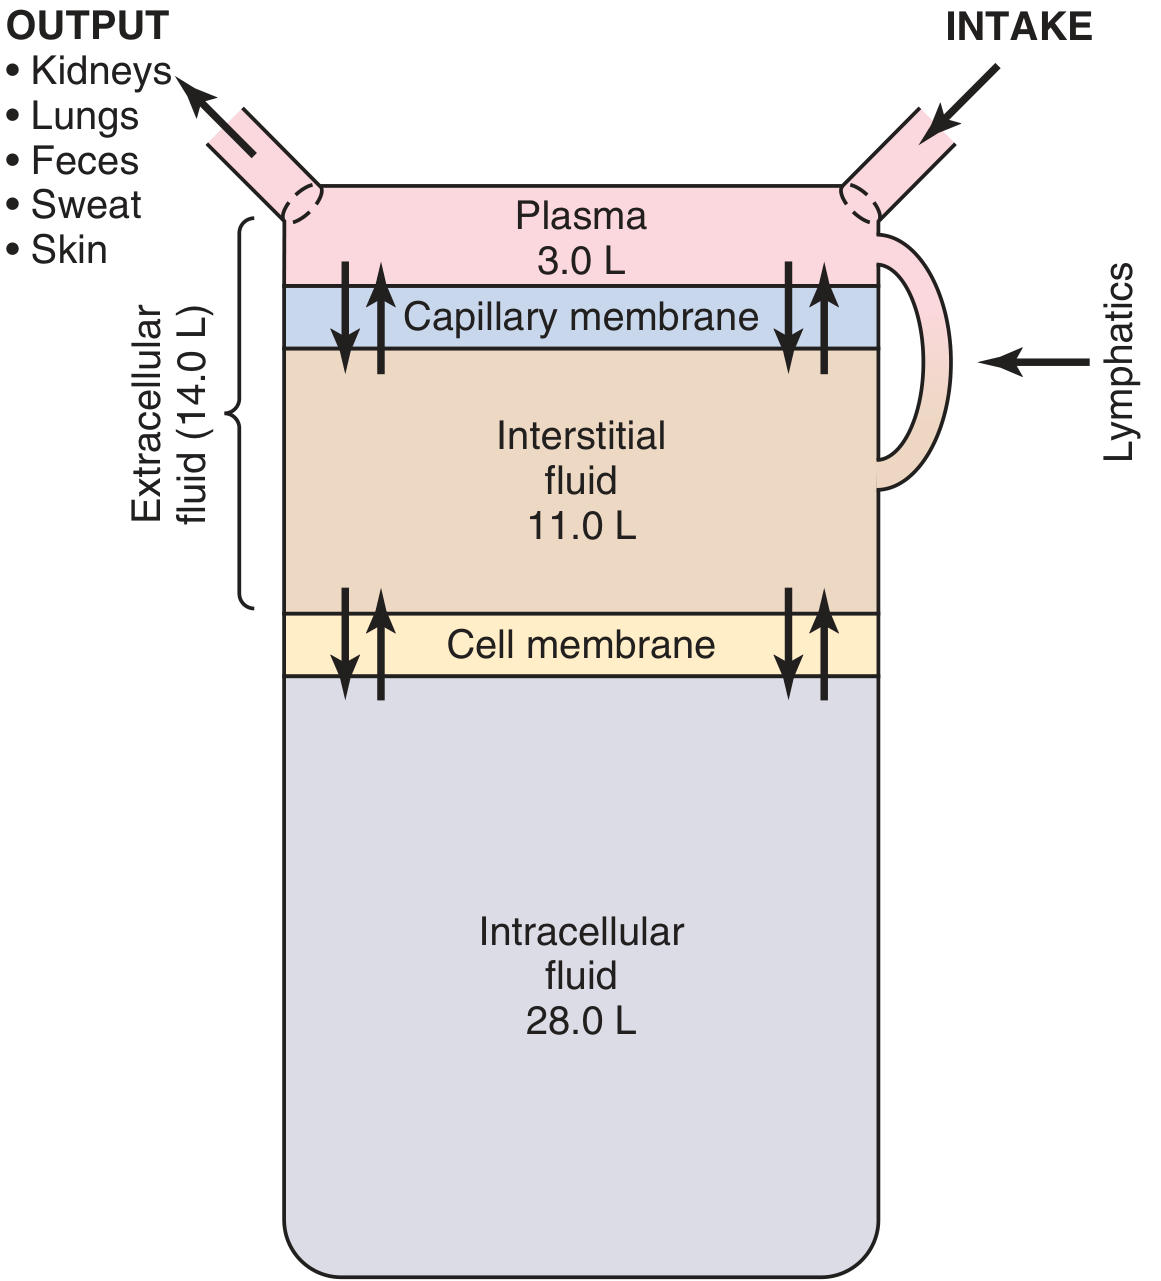
| Compartment | Volume | % Body Weight |
|---|---|---|
| Total Body Water | 42 L | 60% |
| Intracellular Fluid (ICF) | 28 L | 40% |
| Extracellular Fluid (ECF) | 14 L | 20% |
| - Plasma | 3 L | 4% |
| - Interstitial Fluid | 11 L | 16% |
| Transcellular Fluid | 1-2 L | ~2% |
Transcellular fluid = synovial, peritoneal, pericardial, cerebrospinal, intraocular
Sex/Age Variation:
- Women: ~50% body weight as water (more fat)
- Premature/newborn: 70-75%
- Elderly: decreases with aging
2. The Renal-Body Fluid Feedback System (Chapter 30)
This is the master long-term regulator of blood volume and blood pressure:
↑ Fluid Intake
      ↓
↑ Blood Volume
      ↓
↑ Cardiac Output
      ↓
↑ Arterial Pressure
      ↓
PRESSURE NATRIURESIS (kidneys excrete more Na⁺ and water)
      ↓
↓ Blood Volume → ↓ Cardiac Output → BP normalizes
Key principle: Even a small rise in arterial pressure causes a large increase in urinary output - this gives the system enormous gain.
3. Blood Volume Stability Despite Variable Fluid Intake
Fig. 30.15 - Blood volume vs. daily fluid intake:
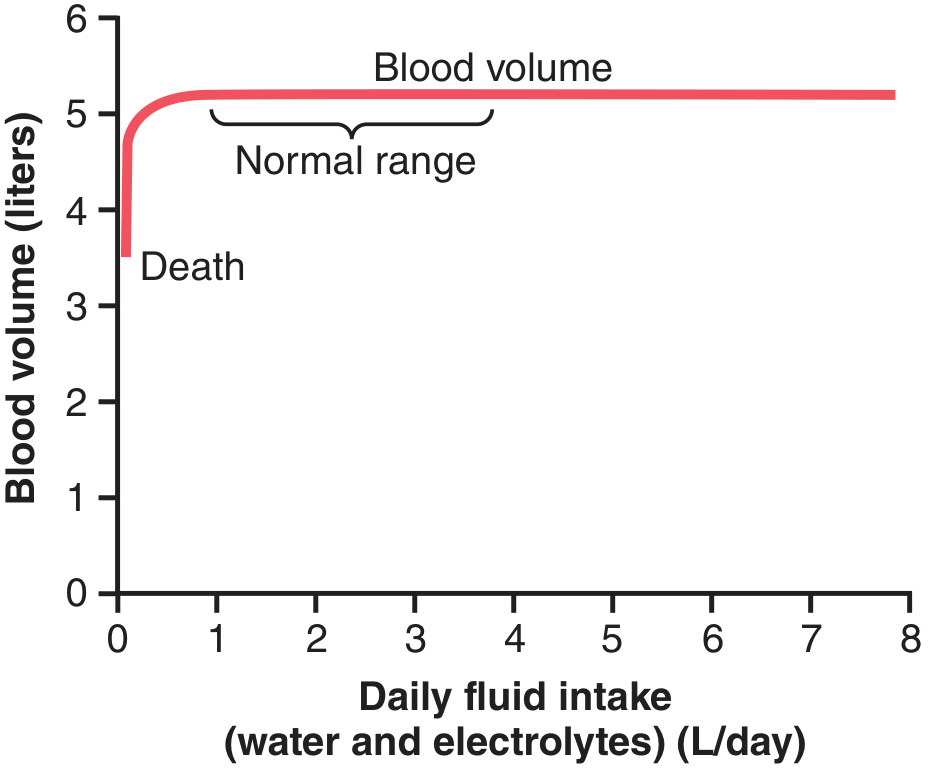
- Blood volume stays remarkably constant (around 5 L) across a wide range of daily fluid intakes (1-8 L/day)
- Only at very low intake (approaching death) does blood volume drop critically
4. Hormonal Factors Augmenting Renal-Body Fluid Control
| Hormone | Stimulus | Action | Effect |
|---|---|---|---|
| Aldosterone (adrenal cortex) | Ang II, ↑ K⁺, ↓ volume | ↑ Na⁺ reabsorption in collecting duct | ↑ Blood volume |
| ADH (Vasopressin) | ↑ Osmolarity, ↓ volume | ↑ Water reabsorption (aquaporins) | ↑ Blood volume, ↓ osmolarity |
| Angiotensin II | ↓ Renal perfusion → ↑ renin | ↑ Na⁺ reabsorption; stimulates aldosterone | ↑ Blood volume |
| ANP (Atrial Natriuretic Peptide) | ↑ Atrial stretch (↑ volume) | ↑ Na⁺/water excretion | ↓ Blood volume |
| BNP (Brain Natriuretic Peptide) | Ventricular stretch | Similar to ANP | ↓ Blood volume |
5. RAAS Axis in Detail
↓ Renal perfusion pressure
         ↓
Juxtaglomerular cells release RENIN
         ↓
Angiotensinogen → Angiotensin I (by renin)
         ↓ (ACE in lungs)
Angiotensin II
    ├─→ Vasoconstriction (↑ BP)
    ├─→ Stimulates Aldosterone → ↑ Na⁺ retention
    ├─→ Stimulates ADH release → ↑ water retention
    └─→ Direct tubular Na⁺ reabsorption
6. Abnormal Fluid Volume States
A. Increased Blood Volume in Heart Disease (Guyton block 4, line 2111)
- Heart failure → ↓ CO → ↓ renal blood flow → RAAS activation → Na⁺ and water retention
- ECF volume expands by liters → edema, hypertension
- "The kidneys are the culprit in long-term hypertension"
B. Edema Formation - Starling Forces (Capillary Level)
Net filtration = Kf × [(Pc - Pi) - σ(πc - πi)]

Where:
  Pc = capillary hydrostatic pressure (↑ in HF = edema)
  Pi = interstitial hydrostatic pressure
  πc = plasma oncotic pressure (~28 mmHg)
  πi = interstitial oncotic pressure
  Kf = filtration coefficient
  σ = reflection coefficient
Causes of edema:
- ↑ Capillary pressure (HF, venous obstruction)
- ↓ Plasma proteins (liver disease, malnutrition)
- Lymphatic blockage
- ↑ Capillary permeability (inflammation, burns)
7. Intersection: Cardiac Failure and Body Fluid Regulation
The two topics overlap powerfully:
CARDIAC FAILURE
        ↓
↓ Cardiac Output → ↓ Renal Perfusion
        ↓
Activation of RAAS + ADH
        ↓
↑ Na⁺ and H₂O Retention → ↑ ECF Volume
        ↓
↑ Venous Return (helpful up to a point)
        ↓
If heart too weak: No further CO gain
        ↓
Fluid accumulates in lungs/periphery
        ↓
PULMONARY EDEMA / PERIPHERAL EDEMA
8. Pressure Natriuresis: The Long-Term Stabilizer
| Arterial Pressure | Urine Output | Effect |
|---|---|---|
| 50 mmHg | Near zero | Fluid retained |
| 100 mmHg (normal) | 1-2 mL/min | Balance |
| 150 mmHg | 4-8x normal | Fluid excreted rapidly |
| 200 mmHg | Very high | Rapid volume loss |
- This is why hypertension eventually "corrects itself" through natriuresis... but only if kidneys are healthy
- Impaired kidneys = salt-sensitive hypertension = permanent volume overload
9. Quick-Reference Summary Chart
| Feature | Cardiac Failure | Body Fluid Regulation |
|---|---|---|
| Primary abnormality | ↓ Myocardial contractility | Imbalance in intake vs. output |
| Key sensor | Baroreceptors, renal perfusion | Osmoreceptors, volume receptors |
| Major compensator | Sympathetic NS + kidneys | Kidneys (pressure natriuresis) |
| Hormones involved | RAAS, ADH, catecholamines | RAAS, ADH, ANP/BNP |
| End result | Edema, congestion | Volume homeostasis |
| Treatment target | Reduce preload/afterload, ↑ contractility | Diuretics, salt restriction |
- Guyton and Hall Textbook of Medical Physiology, 14th Ed. (ISBN 9780443111013), Chapters 22, 25, 30
This is a shared conversation. Sign in to Orris to start your own chat.