
Physiology of heart Cardiac cycle ECG Cardiac output Blood pressure regulation Hemodynamics Heart sounds & murmurs Microcirculation
Reading File
Now let me run all searches in parallel:
Finding Sources
Finding Sources
Finding Sources
Finding Sources
Finding Sources
Finding Sources
Finding Sources
Finding Sources
Now let me read the key physiology blocks in parallel:
Reading File
Reading File
Reading File
Reading File
Reading File
Reading File
I now have rich content from the textbooks. Let me also fetch the blood pressure regulation image and read key ECG + microcirculation content:
Loading Image
Reading File
Here is a complete, textbook-grounded reference on the physiology of the heart covering all seven topics you listed.
Physiology of the Heart
1. Cardiac Cycle
The cardiac cycle is the sequence of mechanical and electrical events that occurs with each heartbeat. It is divided into seven phases (Costanzo Physiology, 7th Ed.):
| Phase | Key Events | ECG | Valves | Heart Sound |
|---|---|---|---|---|
| A - Atrial Systole | Atria contract; final ventricular filling | P wave | Mitral open | S4 (if present) |
| B - Isovolumetric Ventricular Contraction | Ventricles contract; pressure rises; no change in volume | QRS | Mitral closes | S1 (lub) |
| C - Rapid Ventricular Ejection | Ventricular pressure peaks; blood ejected into aorta | ST segment | Aortic opens | - |
| D - Reduced Ventricular Ejection | Slower ejection; ventricular volume at minimum | T wave | - | - |
| E - Isovolumetric Ventricular Relaxation | Ventricles relax; pressure falls; no volume change | - | Aortic closes | S2 (dub) |
| F - Rapid Ventricular Filling | Passive filling from atria; ventricular pressure low | - | Mitral opens | S3 (if present) |
| G - Reduced Ventricular Filling (Diastasis) | Slow filling; heart rate determines duration | - | - | - |
Key pressures:
- Aortic pressure: ~80 mmHg (diastole) to ~120 mmHg (systole)
- Left ventricular pressure: 0 mmHg (diastole) rises to ~120 mmHg (systole)
- Left atrial pressure: low (~5 mmHg), with "a," "c," and "v" wave fluctuations
Wiggers diagram concept: All parameters (LV pressure, aortic pressure, LA pressure, ventricular volume, ECG, heart sounds) are plotted simultaneously against time and studied phase by phase.
2. Electrocardiogram (ECG)
The ECG records the sum of all cardiac action potentials at the body surface.
ECG Waveforms and Their Meaning
| Wave/Interval | Represents |
|---|---|
| P wave | Atrial depolarization |
| PR interval | Conduction through AV node (0.12-0.20 s) |
| QRS complex | Ventricular depolarization (~0.08-0.10 s) |
| ST segment | Ventricular plateau (phase 2 of action potential) |
| T wave | Ventricular repolarization |
| QT interval | Total ventricular electrical activity (rate-corrected QTc <0.44 s) |
Action Potential - ECG Correlation
- The SA node fires spontaneously (automaticity), depolarizing the atria → P wave
- Conduction slows in the AV node (creates PR interval delay; prevents atrial flutter from driving ventricles 1:1)
- The impulse travels down the Bundle of His → left and right bundle branches → Purkinje fibers → ventricular myocardium → QRS complex
- Repolarization of the ventricles proceeds from epicardium to endocardium (opposite direction to depolarization) → upright T wave
Normal Axis
- Normal QRS axis: -30° to +90°
- Left axis deviation: more negative than -30°
- Right axis deviation: more positive than +90°
3. Cardiac Output
Cardiac output (CO) = Stroke Volume (SV) × Heart Rate (HR)
- Normal CO ≈ 5,000 mL/min (SV ~70 mL × HR ~72 bpm)
- Cardiac index = CO ÷ body surface area (~2.5-4.0 L/min/m²)
- Ejection fraction (EF) = SV ÷ End-diastolic volume (EDV); normal ≥55%
Example (Costanzo Physiology): EDV 140 mL, ESV 70 mL → SV = 70 mL, CO = 70 × 75 = 5,250 mL/min, EF = 50%
Determinants of Stroke Volume
| Factor | Definition | Effect |
|---|---|---|
| Preload | EDV / ventricular filling (↑ venous return → ↑ SV) | Frank-Starling mechanism |
| Afterload | Resistance ventricle ejects against (aortic pressure / SVR) | ↑ afterload → ↓ SV |
| Contractility (inotropy) | Intrinsic force at given fiber length | ↑ contractility → ↑ SV |
Frank-Starling Law of the Heart
"The volume ejected by the ventricle depends on the volume present at the end of diastole." As EDV increases, sarcomere length increases toward optimal overlap, increasing force of contraction. This ensures that, in steady state, cardiac output equals venous return.
Regulation of Heart Rate (Chronotropy)
- Sympathetic (β1): ↑ HR, ↑ contractility
- Parasympathetic (vagus/M2): ↓ HR
- Baroreceptors: carotid sinus and aortic arch sense pressure and reflexively modulate HR
Measurement of CO
- Fick principle: CO = O₂ consumption ÷ (arterial O₂ content - venous O₂ content)
- Thermodilution: cold saline injection via pulmonary artery catheter (Swan-Ganz)
- Echocardiography: LVOT area × VTI × HR
4. Blood Pressure Regulation
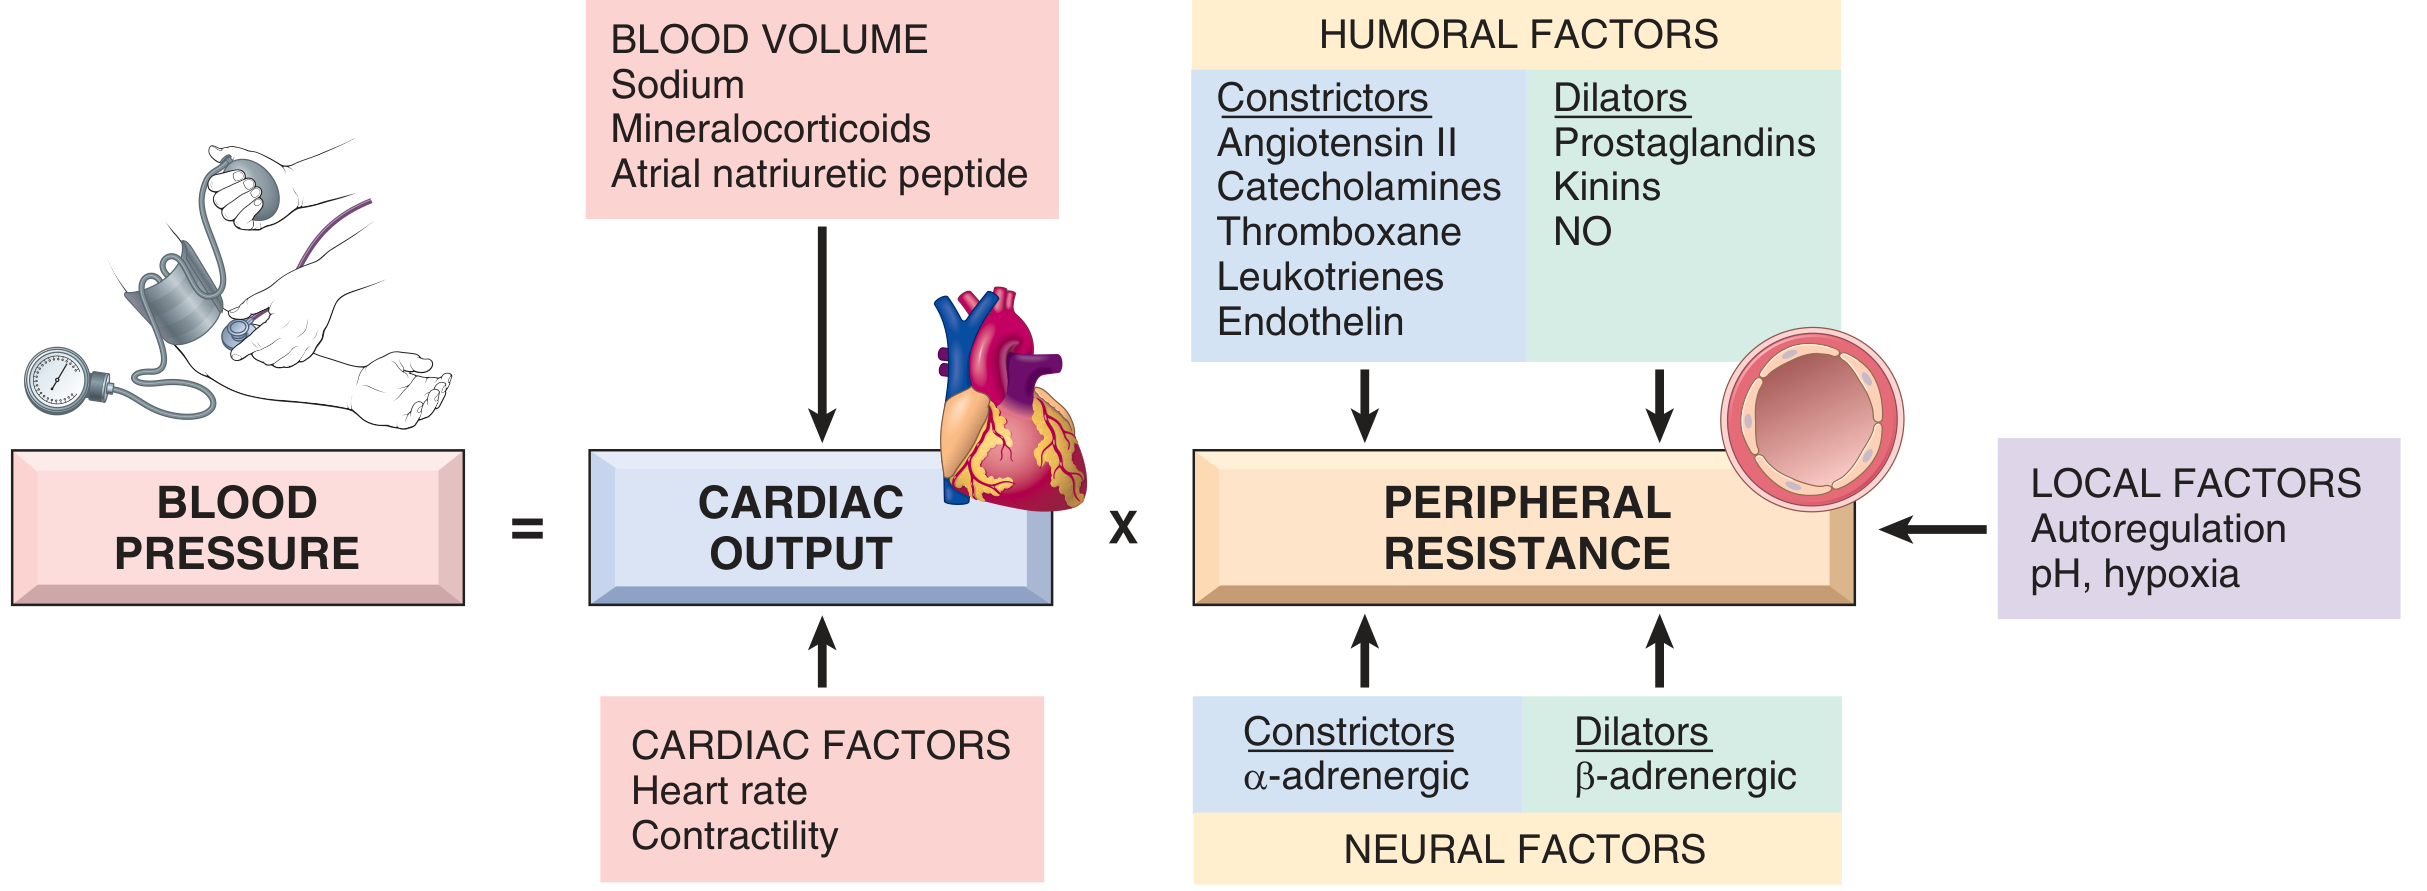
BP = Cardiac Output × Total Peripheral Resistance (TPR)
A. Neural Control
- Baroreceptor reflex (short-term): Carotid sinus and aortic arch stretch receptors → nucleus tractus solitarius (NTS) → vasomotor center → adjust HR, SV, and arteriolar tone
- ↑ BP → ↑ baroreceptor firing → vagus activation + sympathetic withdrawal → ↓ HR, ↓ contractility, vasodilation
- Sympathetic adrenergic tone: α1 receptors on arterioles → vasoconstriction; β1 on heart → ↑ HR & contractility
B. Humoral / Hormonal Control
| System | Stimulus | Effect |
|---|---|---|
| RAAS (renin-angiotensin-aldosterone) | ↓ BP, ↓ Na⁺, ↓ renal perfusion | Angiotensin II → vasoconstriction + aldosterone → Na⁺/water retention |
| ADH (vasopressin) | ↑ plasma osmolality, ↓ volume | Water retention + vasoconstriction (V1 receptors) |
| ANP/BNP | ↑ atrial stretch | Natriuresis, vasodilation, ↓ aldosterone |
| Catecholamines | Stress | α1: vasoconstriction; β1: ↑ CO |
| Nitric oxide (NO) | Endothelial shear stress | Potent vasodilation |
| Endothelin-1 | Endothelial injury | Potent vasoconstriction |
C. Renal (Long-term) Control
The kidney is the ultimate long-term regulator of BP through pressure natriuresis: ↑ BP → ↑ urinary Na⁺/water excretion → ↓ blood volume → ↓ CO → BP normalizes. Aldosterone fine-tunes this through ENaC channels in the collecting duct.
Vascular Function Curve & Venous Return
- Mean systemic filling pressure (~7 mmHg) drives venous return
- ↑ blood volume or ↑ venous tone → shifts vascular function curve rightward → ↑ venous return → ↑ CO (Frank-Starling)
- ↑ TPR (arteriolar constriction) → counterclockwise rotation of vascular function curve → ↓ venous return
5. Hemodynamics
Hemodynamics applies Ohm's Law and fluid mechanics to the circulation.
Fundamental Equation
Flow (Q) = Pressure difference (ΔP) ÷ Resistance (R)
Poiseuille's Law
R = 8ηL / πr⁴
Where η = viscosity, L = vessel length, r = radius
The radius has the dominant effect: halving vessel radius increases resistance 16-fold. This is why arterioles are the primary site of resistance regulation.
Key Parameters
| Parameter | Normal Value |
|---|---|
| Systolic BP | ~120 mmHg |
| Diastolic BP | ~80 mmHg |
| Mean arterial pressure (MAP) | ~93 mmHg (DBP + 1/3 pulse pressure) |
| Pulse pressure | ~40 mmHg (SBP - DBP) |
| Total peripheral resistance | ~1,200 dyne·s/cm⁵ |
| Central venous pressure | 0-8 mmHg |
Distribution of Resistance
- Arterioles account for ~60% of total resistance - the major site for BP regulation
- Capillaries: ~20% resistance, primary site of exchange
- Veins: low resistance; act as capacitance vessels (hold ~64% of blood volume)
Compliance
C = ΔV / ΔP
Veins are ~20× more compliant than arteries. Large arteries (aorta) act as a Windkessel: storing energy during systole and releasing it during diastole to maintain continuous capillary flow.
Laplace's Law
Wall tension (T) = Pressure (P) × Radius (r) (for a thin-walled sphere)
- Explains why a dilated, failing ventricle needs to generate much more wall tension to achieve the same pressure
- Explains aneurysm rupture risk: larger radius → greater wall tension
Reynolds Number
Re = ρvd / η
Re >2,000 → turbulent flow → audible murmurs and bruits. This is why anemia (↓η), hyperdynamic states, and stenotic valves cause murmurs.
6. Heart Sounds and Murmurs
Normal Heart Sounds
| Sound | Timing | Cause | Heard Best |
|---|---|---|---|
| S1 ("lub") | Beginning of systole | Closure of mitral + tricuspid (AV) valves | Apex (mitral area) |
| S2 ("dub") | End of systole | Closure of aortic + pulmonary (semilunar) valves | Right upper sternal border (aortic area) |
| S3 (ventricular gallop) | Early diastole, after S2 | Rapid ventricular filling; vibration of ventricular walls | Apex; physiological in <30 yrs; pathological = heart failure |
| S4 (atrial gallop) | Late diastole, before S1 | Atrial contraction against stiff ventricle | Apex; always pathological in adults; seen in LVH, MI |
S2 Splitting:
- Physiological/normal split: Aortic (A2) before pulmonary (P2); splits on inspiration (↑ venous return → ↑ RV stroke volume → delays P2)
- Wide fixed split: ASD (equalizes pressures; no respiratory variation)
- Paradoxical split: Aortic valve closes after pulmonary (LBBB, aortic stenosis); split narrows on inspiration
(Guyton and Hall Medical Physiology)
Cardiac Murmurs
Murmurs arise from turbulent blood flow (high Re) through:
- Stenotic or regurgitant valves
- Abnormal communications (VSD, PDA)
- Hyperdynamic states (anemia, fever, pregnancy)
| Murmur | Timing | Cause | Quality | Radiation |
|---|---|---|---|---|
| Aortic Stenosis | Systolic (ejection) | Calcified/bicuspid aortic valve | Harsh, crescendo-decrescendo | Neck (carotid) |
| Mitral Regurgitation | Pansystolic (holosystolic) | Mitral valve prolapse, ischemia, rheumatic | High-pitched blowing | Axilla |
| Aortic Regurgitation | Early diastolic | Aortic valve incompetence | High-pitched, blowing, decrescendo | Left sternal border |
| Mitral Stenosis | Mid-diastolic, low rumble | Rheumatic fever | Low-pitched rumble; opening snap | Minimal |
| PDA | Continuous ("machinery") | Patent ductus arteriosus | Continuous, under clavicle | - |
| VSD | Pansystolic | Ventricular septal defect | Harsh | Left sternal border |
Murmur grading (Levine 1-6): Grade 1 = barely audible; Grade 4+ = palpable thrill; Grade 6 = audible without stethoscope.
Right-sided murmurs (tricuspid, pulmonary) increase with inspiration (↑ venous return to right side).
7. Microcirculation
The microcirculation consists of arterioles, capillaries, and venules - the functional unit of exchange between blood and tissues.
Structure
- Arterioles (10-100 µm): have smooth muscle; regulate local blood flow via vasomotion
- Pre-capillary sphincters: gate blood flow into individual capillary beds; controlled by local metabolic factors
- Capillaries (5-10 µm diameter): single endothelial cell layer + basement membrane; ~1 µm wall thickness; RBCs must deform to pass
- Venules (10-200 µm): primary site of inflammatory extravasation (leukocyte rolling and diapedesis)
Starling Forces (Capillary Exchange)
Net filtration = Kf × [(Pc - Pi) - σ(πc - πi)]
| Force | Direction | Normal Value |
|---|---|---|
| Capillary hydrostatic pressure (Pc) | Filtration (out) | ~32 mmHg arterial end; ~15 mmHg venous end |
| Interstitial hydrostatic pressure (Pi) | Absorption (in) | ~-3 mmHg (slightly subatmospheric) |
| Plasma oncotic pressure (πc) | Absorption (in) | ~25 mmHg (mainly albumin) |
| Interstitial oncotic pressure (πi) | Filtration (out) | ~8 mmHg |
- At the arterial end: hydrostatic force dominates → net filtration (fluid leaves capillary)
- At the venous end: oncotic force dominates → net reabsorption (fluid returns)
- ~90% of filtered fluid is reabsorbed; the remaining ~10% is returned via lymphatics
Edema Mechanisms
| Cause | Mechanism |
|---|---|
| ↑ capillary hydrostatic pressure | Heart failure, venous obstruction |
| ↓ plasma oncotic pressure | Hypoalbuminemia (cirrhosis, nephrotic syndrome, malnutrition) |
| ↑ capillary permeability | Inflammation, sepsis, burns |
| Lymphatic obstruction | Filariasis, tumor, post-surgery |
Local Regulation of Microvascular Flow
- Metabolic autoregulation: ↑ CO₂, ↓ O₂, ↓ pH, ↑ adenosine → vasodilation (matches flow to demand)
- Myogenic response: ↑ intraluminal pressure → smooth muscle contracts → protects capillaries from overperfusion
- Endothelium-derived factors: NO (vasodilator), prostacyclin (vasodilator), endothelin-1 (vasoconstrictor)
Quick Reference: Normal Values
| Parameter | Value |
|---|---|
| Heart rate | 60-100 bpm |
| Stroke volume | ~70 mL |
| Cardiac output | ~5 L/min |
| Ejection fraction | ≥55% |
| MAP | ~93 mmHg |
| PR interval | 0.12-0.20 s |
| QRS duration | <0.10 s |
| QTc | <0.44 s |
| CVP | 0-8 mmHg |
| PCWP | 6-12 mmHg |
Sources: Costanzo Physiology 7th Ed. | Guyton & Hall Textbook of Medical Physiology | Robbins & Kumar Basic Pathology | Miller's Anesthesia 10th Ed.
This is a shared conversation. Sign in to Orris to start your own chat.