
Explain ECG
Reading File
Now let me search the library for comprehensive ECG content, running parallel queries:
Finding Sources
Finding Sources
Reading File
Finding Sources
Reading File
Now let me get the detailed ECG interpretation section from Harrison's and Goldman-Cecil:
Reading File
Reading File
Reading File
Reading File
Reading File
Loading Image
Loading Image
Reading File
I now have a thorough body of information from Harrison's, Goldman-Cecil, Miller's Anesthesia, and Gray's Anatomy. Let me compose the full answer.
Electrocardiogram (ECG)
What Is an ECG?
An electrocardiogram (ECG) is a non-invasive recording of the electrical activity of the heart at the body surface. It captures differences in electrical potential generated by the heart between two recording sites. Because the heart's electrical events are directly linked to mechanical contraction, the ECG provides a window into both the electrophysiology and, indirectly, the mechanical function of the heart.
- Harrison's Principles of Internal Medicine, 22E, p. 1911
- Goldman-Cecil Medicine, p. 422
The Cardiac Conduction System (The Source of the ECG Signal)
Before reading an ECG, you need to understand the electrical "wiring" that generates the signal:
| Structure | Location | Function |
|---|---|---|
| SA node | Junction of SVC and right atrium (crista terminalis) | Primary pacemaker; spontaneously depolarizes at the highest rate |
| Bachmann bundle | Inter-atrial conducting tract | Speeds depolarization to the left atrium |
| AV node | Near coronary sinus opening, interventricular septum | Physiologic conduction delay (slows signal before it reaches ventricles) |
| Bundle of His | Lower border of membranous interventricular septum | Rapid-conduction bridge between AV node and bundle branches |
| Right & Left bundle branches | Right and left sides of interventricular septum | Carry impulse to respective ventricles |
| Left anterior/posterior fascicles | Divisions of left bundle branch | Subdivide activation of the large left ventricle |
| Purkinje fibers | Subendocardial network | Final distribution to ventricular cardiomyocytes; insulated from myocardium until contact points |
The AV valve rings are electrically insulated, so the AV node is normally the only electrical connection between atria and ventricles - this is critical for preventing re-entrant arrhythmias.
- Gray's Anatomy for Students, p. 414
- Goldman-Cecil Medicine, p. 422
ECG Paper and Calibration
The ECG is recorded on graph paper divided into 1 mm² boxes:
- Horizontal axis = time: at standard speed of 25 mm/s, each small box = 40 ms (0.04 s), each large box (5 small) = 200 ms (0.20 s)
- Vertical axis = voltage: standard calibration = 1 mV = 10 mm
Heart rate can be estimated by dividing 300 by the number of large boxes between consecutive R waves (or 1500 by the number of small boxes).
- Harrison's Principles of Internal Medicine, 22E, p. 1912
The ECG Waveforms and Intervals
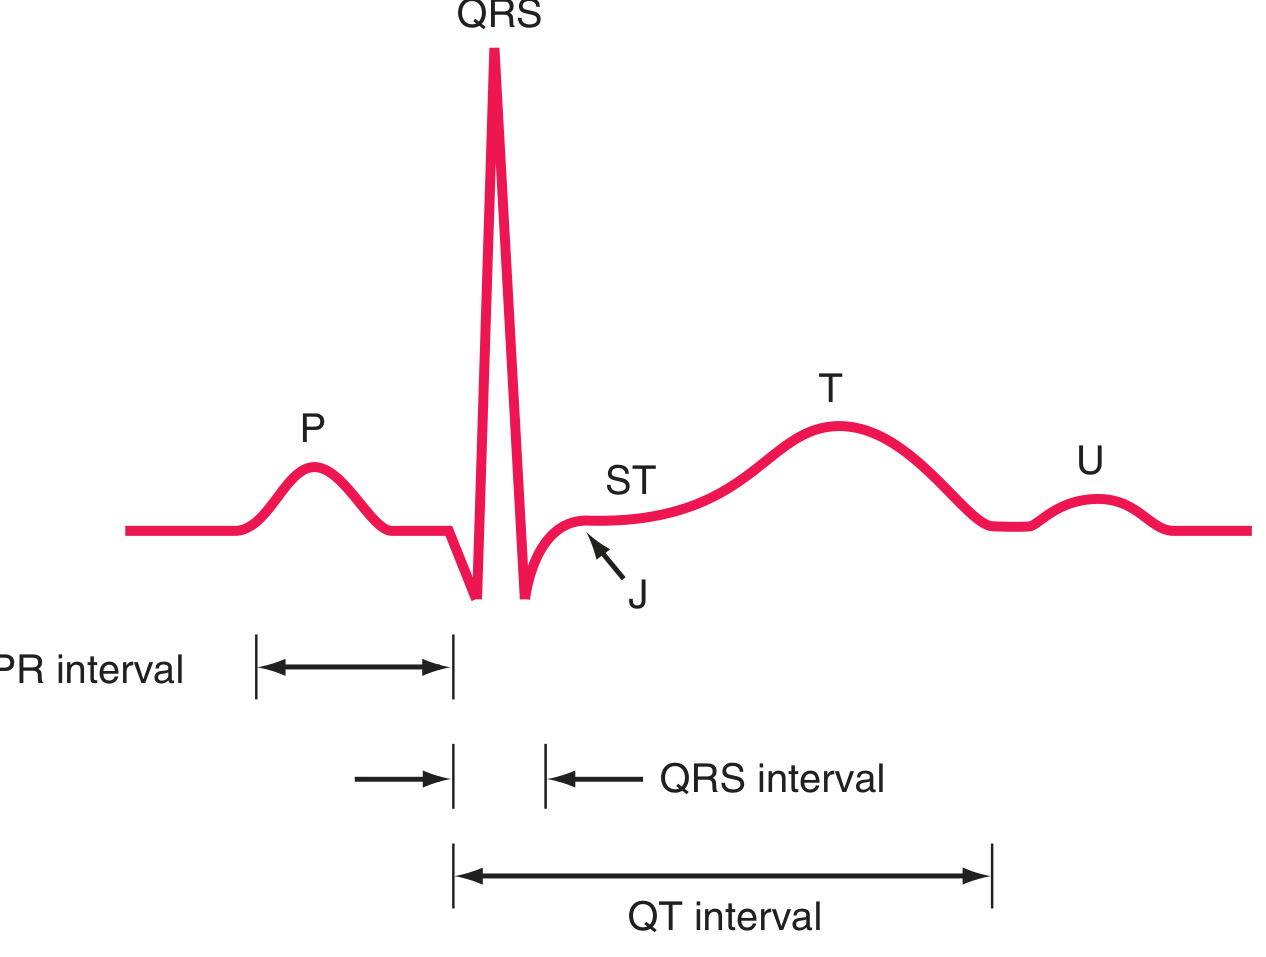
Here is a diagram showing all the key waves and intervals:
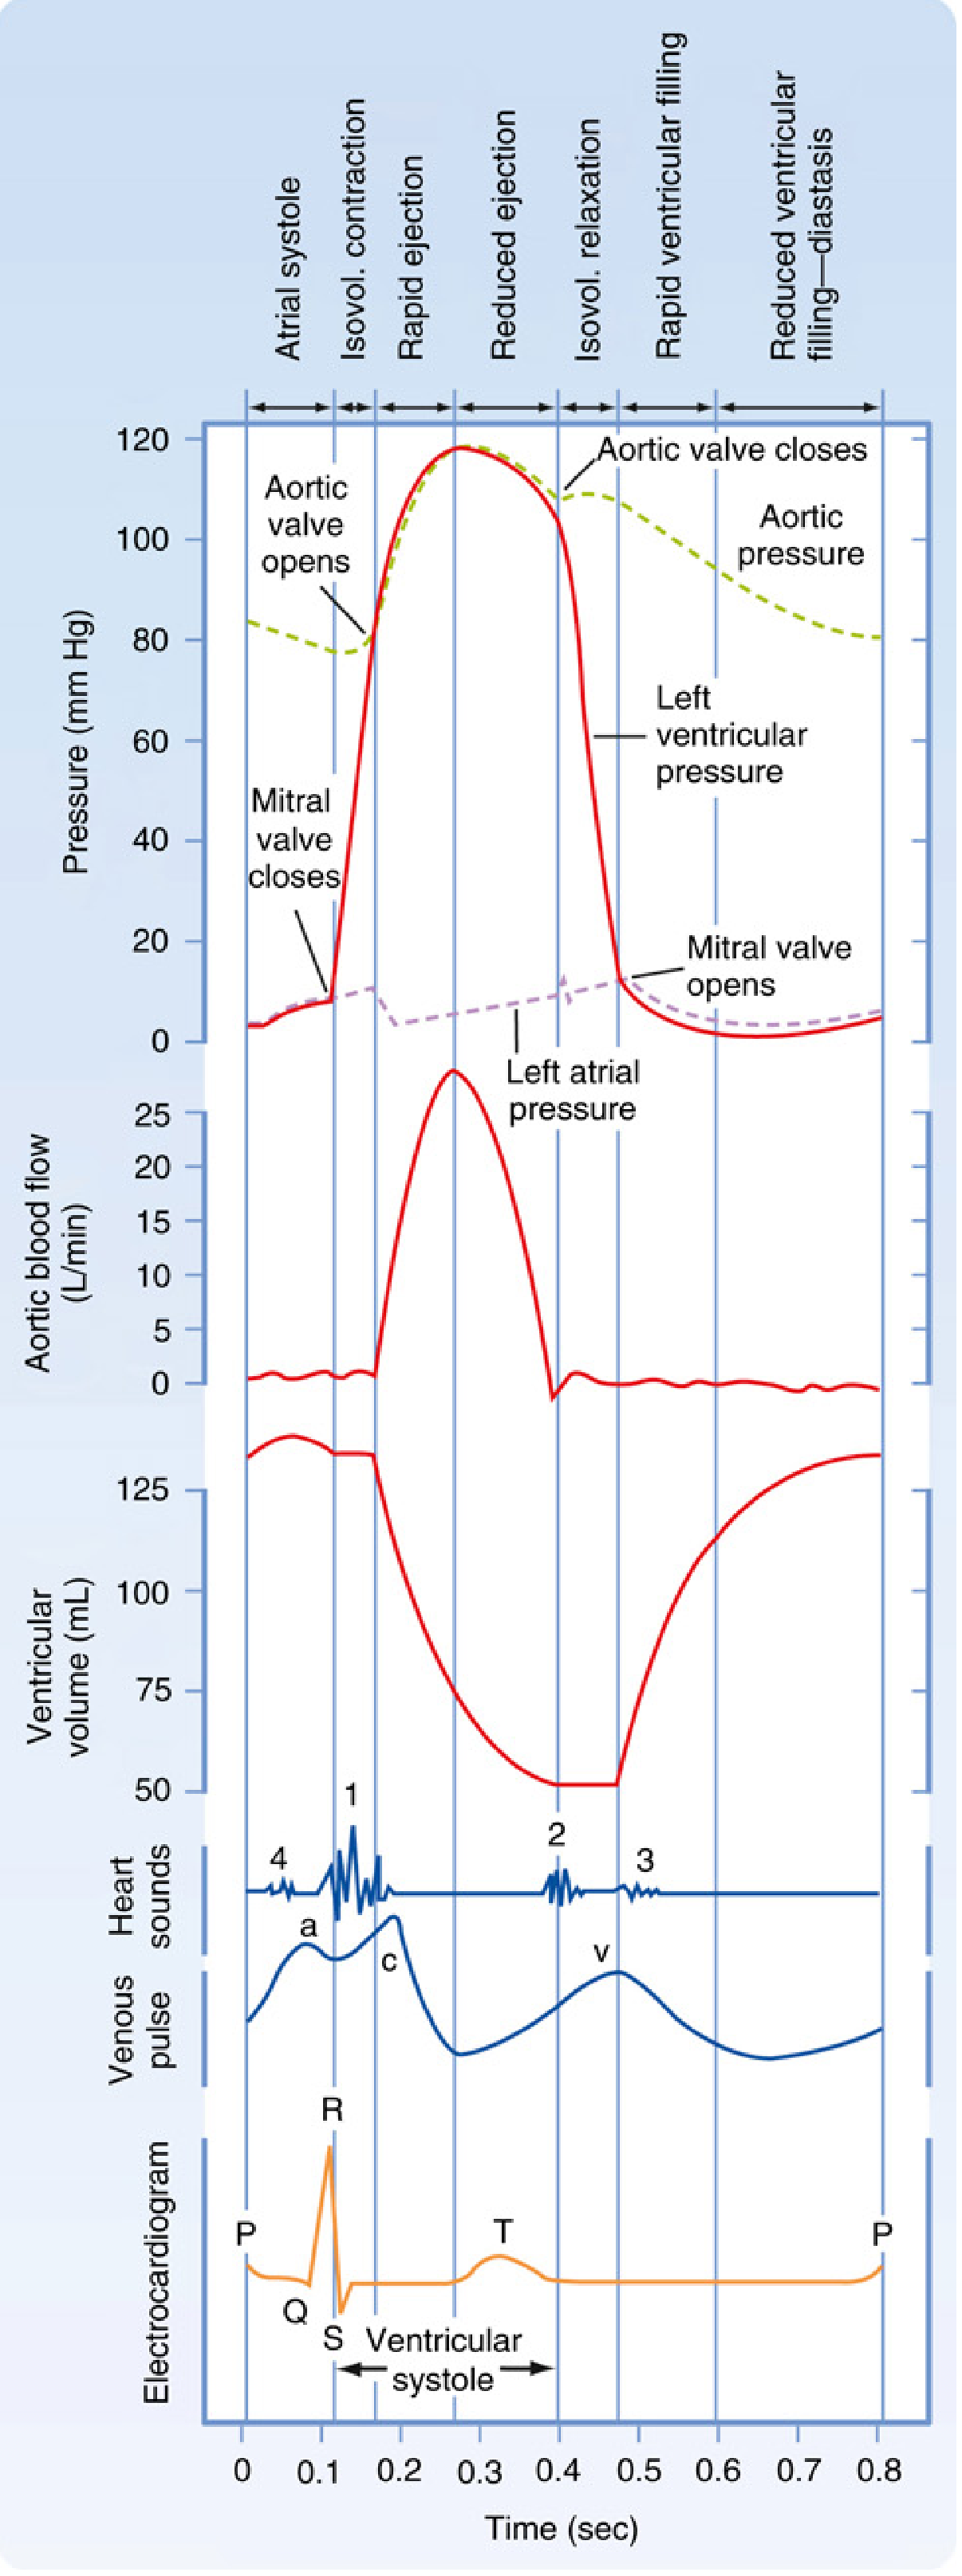
And below is a diagram showing how ECG events map to the cardiac cycle (ventricular pressure, volume, heart sounds):
P Wave
- Represents atrial depolarization
- Normally positive in lead II, negative in aVR (because the SA node impulse travels downward and to the patient's left)
- A biphasic P in V1 is normal: positive component = right atrial depolarization; small negative component = left atrial depolarization
- Atrial repolarization is buried under the QRS and usually not visible
PR Interval
- Measured from onset of P wave to onset of QRS
- Normal: 120-200 ms (3-5 small boxes)
- Represents conduction through atrial tissue, AV node, and His-Purkinje system
- Prolonged PR (>200 ms): first-degree AV block (usually AV nodal delay)
- Short PR: ventricular pre-excitation (Wolff-Parkinson-White), junctional rhythm, or enhanced AV nodal conduction
QRS Complex
- Represents ventricular depolarization
- Much larger amplitude than P wave due to the greater ventricular muscle mass
- Normal duration: 75-110 ms (up to ~3 small boxes)
- Naming convention: capital letters (Q, R, S) = amplitude ≥5 mm; lowercase (q, r, s) = amplitude <5 mm
- Q/q: initial negative deflection
- R/r: positive deflection
- S/s: negative deflection following a positive deflection
- QS pattern: entirely negative complex
- Prolonged QRS (>110 ms) indicates intraventricular or interventricular conduction delay (e.g., bundle branch block)
ST Segment
- Junction between end of QRS (J point) and beginning of T wave
- Corresponds to phase 2 (plateau) of the ventricular action potential
- Normally isoelectric (flat at baseline)
- ST elevation: transmural (epicardial) ischemia/injury, pericarditis, Brugada syndrome
- ST depression: subendocardial ischemia
T Wave
- Represents ventricular repolarization (phase 3 of action potential)
- Normally upright in most leads; inversion can indicate ischemia, hypertrophy, or other pathology
- Deep T-wave inversions in V1-V4 (Wellens sign) = severe LAD stenosis
QT Interval
- Measured from onset of QRS to end of T wave
- Reflects both ventricular depolarization and repolarization
- Inversely proportional to heart rate - must be corrected
- Bazett's formula: QTc = QT / √RR (in seconds)
- Upper normal limits: QTc ≤460 ms in women, ≤450 ms in men
- Prolonged QT: hypokalemia, hypocalcemia, drugs (amiodarone, antipsychotics), channelopathies - risk of torsades de pointes
- Shortened QT: hypercalcemia, digoxin, hereditary short QT syndrome
U Wave
-
Small deflection after T wave; normal variant, most prominent in V2-V3
-
Prominent U waves: hypokalemia, bradycardia
-
Inverted U waves: may indicate ischemia or left ventricular hypertrophy
-
Harrison's Principles of Internal Medicine, 22E, pp. 1911-1912
-
Goldman-Cecil Medicine, pp. 422-425
The 12 ECG Leads
The standard 12-lead ECG views the heart from 12 different "camera angles":
6 Limb (Frontal Plane) Leads
| Lead | Orientation |
|---|---|
| I | Left arm (+) vs. right arm (-); 0° |
| II | Left leg (+) vs. right arm (-); +60° |
| III | Left leg (+) vs. left arm (-); +120° |
| aVR | Right arm (+); -150° |
| aVL | Left arm (+); -30° |
| aVF | Left foot (+); +90° |
These are arranged on a hexaxial diagram to calculate the mean QRS electrical axis.
6 Precordial (Horizontal Plane) Leads
- V1, V2: right precordium (right ventricle view)
- V3, V4: transitional zone (septum)
- V5, V6: left precordium (left ventricle view)
A key principle: a depolarization wave moving toward the positive pole of a lead inscribes a positive (upward) deflection; moving away inscribes a negative (downward) deflection; moving perpendicular = biphasic.
Territorial Grouping (for Ischemia/Infarction)
| Territory | Leads | Artery |
|---|---|---|
| Inferior | II, III, aVF | RCA |
| Anterior | V1-V4 | LAD |
| Lateral | I, aVL, V5-V6 | LCx |
| Posterior | V1-V2 (reciprocal changes) | RCA/LCx |
- Harrison's Principles of Internal Medicine, 22E, p. 1912
Systematic Approach to ECG Interpretation
Harrison's recommends evaluating in this order:
- Rate - HR (bpm from RR interval)
- Rhythm - regular vs. irregular; identify P waves
- PR interval - AV conduction
- QRS interval - ventricular conduction
- QT/QTc intervals - repolarization
- Mean QRS axis - normal (-30° to +90°)
- P wave morphology - atrial enlargement?
- QRS voltages - hypertrophy?
- Precordial R-wave progression - V1 to V6 should increase
- Abnormal Q waves - old infarction?
- ST segments - ischemia/injury?
- T waves - ischemia, electrolyte abnormality?
- U waves - hypokalemia?
Key Pathological Patterns at a Glance
| Finding | Possible Causes |
|---|---|
| Prolonged PR | First-degree AV block, drugs (digoxin, beta-blockers) |
| Short PR + delta wave | Wolff-Parkinson-White (WPW) |
| Wide QRS (>120 ms) | LBBB, RBBB, ventricular rhythm, hyperkalemia, Na+-channel blocker toxicity |
| ST elevation | STEMI, pericarditis, Brugada, vasospasm (Prinzmetal's) |
| ST depression | Subendocardial ischemia, NSTEMI, LVH strain pattern |
| Q waves | Prior MI, cardiomyopathy, normal septal Q in lateral leads |
| Peaked T waves | Hyperkalemia (early), LVH |
| Prolonged QTc | Hypokalemia, hypocalcemia, hypomagnesemia, drugs, channelopathies |
| Osborn (J) wave | Hypothermia |
| Wellens T-wave pattern | Critical LAD stenosis |
Summary
The ECG records cardiac electrical activity through 12 leads, each offering a different spatial perspective on the same events. The sequence - SA node fires → atria depolarize (P wave) → AV node delays → ventricles depolarize (QRS) → ventricles repolarize (T wave) - is visible on every normal beat. By analyzing rate, rhythm, intervals, axis, and morphology of each waveform, the ECG reveals a wide range of diagnoses: arrhythmias, conduction blocks, ischemia, infarction, electrolyte abnormalities, drug effects, and structural heart disease.
Sources: Harrison's Principles of Internal Medicine 22E | Goldman-Cecil Medicine | Miller's Anesthesia 10e | Gray's Anatomy for Students
This is a shared conversation. Sign in to Orris to start your own chat.