
Whatson and crick model of dna biochemistry mbbs 1st year
Watson Crick DNA double helix model structure
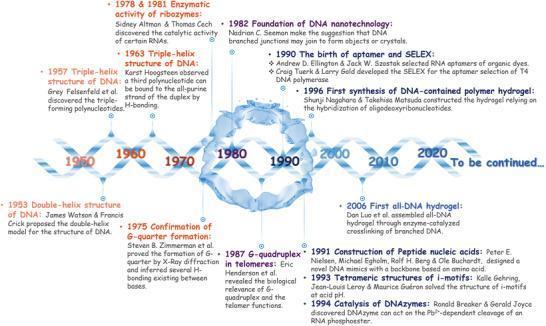
This infographic presents a horizontal timeline illustrating scientific milestones in DNA nanotechnology and nucleic acid hydrogels (NAHs) from 1950 to the 2020s. The timeline is visually anchored by a blue double-helix DNA strand, with decade markers serving as nodes for historical breakthroughs. Key historical points include the 1953 proposal of the double-helix structure by Watson and Crick, the discovery of triple-helix structures in 1957 and 1963, and the enzymatic activity of ribozymes (1978/1981). Transitioning into functional DNA nanotechnology, the timeline highlights the 1982 foundation of the field by Nadrian Seeman, the birth of aptamers and SELEX in 1990, and the construction of peptide nucleic acids (1991). Significant developments in hydrogel science are featured, specifically the first synthesis of a DNA-contained polymer hydrogel in 1996 by Nagahara and Matsuda, and the 2006 assembly of the first all-DNA hydrogel by Dan Luo et al. The diagram maps the progression from basic molecular biology to the engineering of smart, functionalized biomaterials for medical and diagnostic applications.
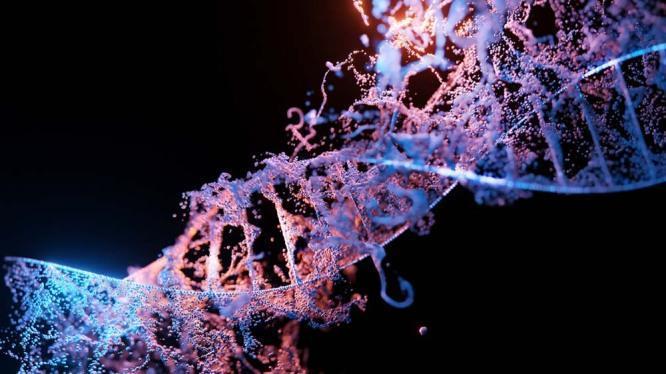
This medical illustration represents a molecular model of a deoxyribonucleic acid (DNA) double helix, categorized under genetics and molecular biology. The image features a stylized, high-contrast visualization where one phosphodiester backbone is depicted with a solid, light blue, segmented geometric structure, and the antiparallel strand is rendered as a nebulous, particulate cloud in shades of purple and orange. Horizontal rungs, representing nitrogenous base pairs (adenine-thymine and cytosine-guanine), connect the two strands across the central axis. The use of particulate textures and glowing elements suggests concepts of genetic instability, DNA damage, or the dynamic nature of replication and transcription. This artistic rendering is suitable for educational use in explaining basic DNA architecture, genomic medicine, or molecular pathology at an introductory to intermediate level.
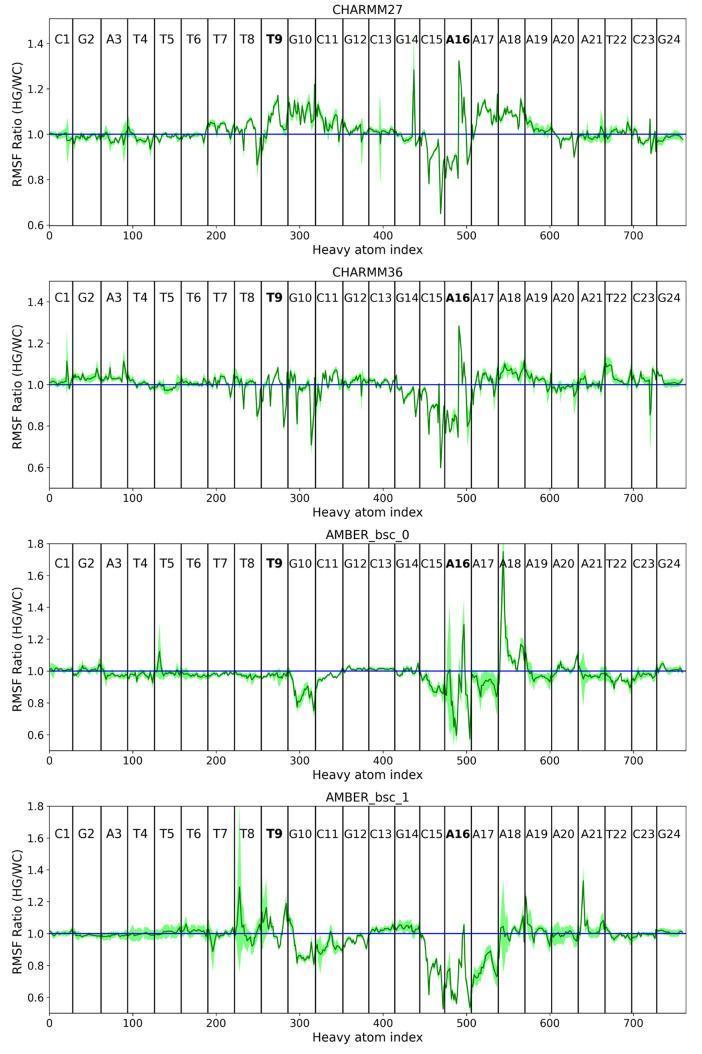
A comparison chart consisting of four vertically stacked subplots representing molecular dynamics simulation results for DNA duplexes using different force fields: CHARMM27, CHARMM36, AMBER_bsc_0, and AMBER_bsc_1. Each plot displays the Root Mean Square Fluctuation (RMSF) Ratio between Hoogsteen (HG) and Watson-Crick (WC) base pairing forms (y-axis) plotted against the Heavy Atom Index (x-axis, 0–700). Vertical black lines delineate specific base pairs (C1 through G24), with A16 and T9 highlighted as primary areas of interest. The data is shown as green line graphs with light green shading indicating 95% confidence intervals from five 50 ns trajectory segments; a horizontal blue line at y=1.0 serves as a baseline for equal fluctuation between HG and WC forms. The diagrams illustrate biophysical variations in DNA flexibility: CHARMM models show a decrease in the HG/WC ratio at A16 (increased HG fluctuations), while AMBER models show an increase at A16 (increased WC fluctuations), highlighting how different computational force fields model the entropic impact of Hoogsteen base pairing on B-DNA structural stability.
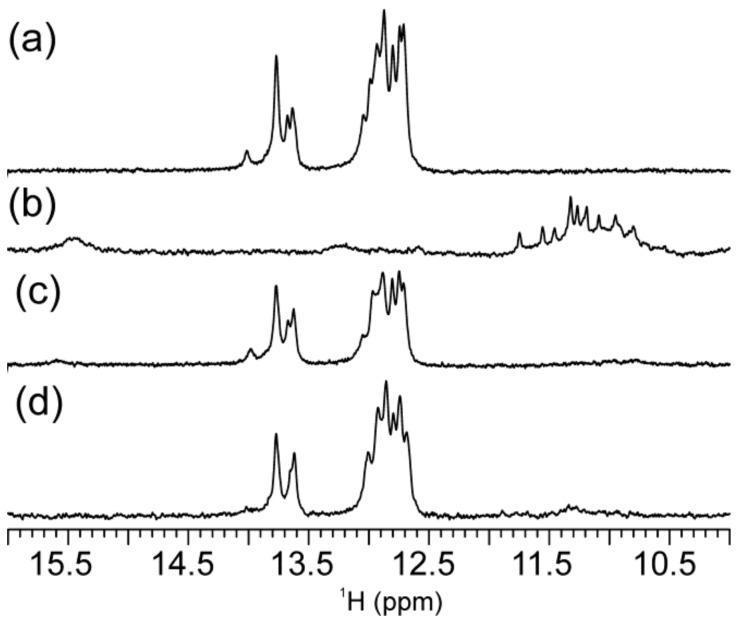
This diagnostic image displays four 1H-NMR (Proton Nuclear Magnetic Resonance) spectra, labeled (a) through (d), illustrating the imino proton region (10.5–15.5 ppm) of DNA oligonucleotides from the N-myc gene. The spectra demonstrate how biochemical conditions (pH and KCl concentration) influence DNA secondary structures. Spectra (a), (c), and (d) show prominent, well-resolved peaks between 12.5 and 14.0 ppm, which are characteristic fingerprints for Watson–Crick base-pairing in double-stranded helical structures. In contrast, spectrum (b), representing conditions of 100 mM KCl and pH 5.0, shows a marked reduction in Watson–Crick signals and the appearance of broad peaks between 10.5 and 12.0 ppm. Additionally, spectrum (b) displays a unique signal near 15.5 ppm, indicating the formation of C+ · C base pairs characteristic of i-motif structures. These visual variations illustrate the structural transition from a canonical duplex to non-canonical G-quadruplex and i-motif configurations under acidic and salt-stabilized conditions, making this a critical reference for molecular genetics and structural biology education.
Watson and Crick Model of DNA - Biochemistry (MBBS 1st Year)
Historical Background
Components of DNA (Building Blocks)
| Component | Details |
|---|---|
| Sugar | 2'-deoxyribose (5-carbon) |
| Phosphate group | Negatively charged; forms the backbone |
| Nitrogenous base | Purine (Adenine, Guanine) or Pyrimidine (Thymine, Cytosine) |
The Double Helix - Key Features
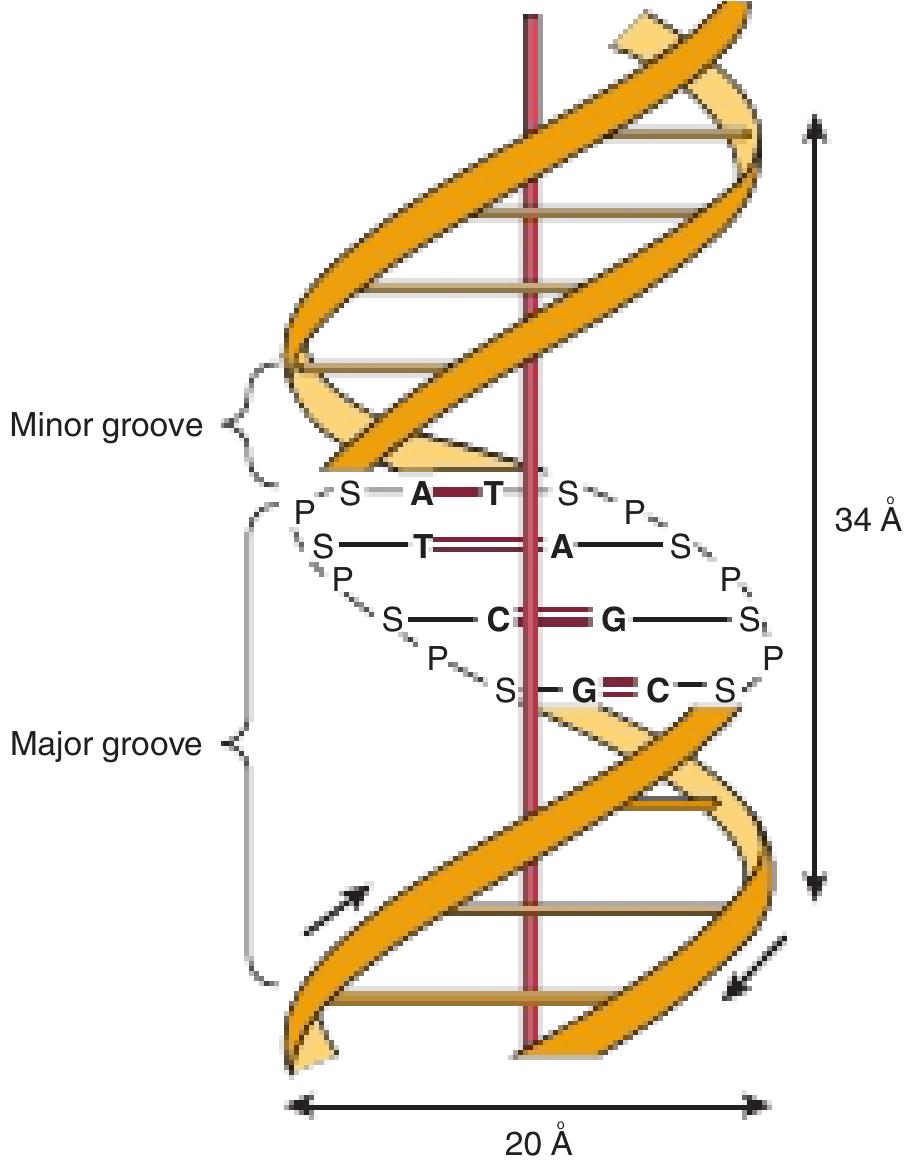
1. Two Antiparallel Strands
- DNA consists of two polynucleotide strands wound around a common central axis
- The two strands run antiparallel - one runs 5'→3' and the other runs 3'→5'
- The hydrophilic sugar-phosphate backbone is on the outside; the hydrophobic bases are stacked inside
2. Right-Handed Helix
- The helix is right-handed (B-form under physiological conditions) - looking down the axis, the base residues spiral clockwise
- The helix resembles a twisted ladder
3. Dimensions of B-DNA
| Parameter | Value |
|---|---|
| Diameter | 20 Å (2 nm) |
| Pitch (one complete turn) | 34 Å |
| Rise per base pair | 3.4 Å |
| Base pairs per turn | 10 |
4. Major and Minor Grooves
- The spatial relationship between the two strands creates a major (wide) groove and a minor (narrow) groove
- These grooves are important for protein-DNA interactions (e.g., transcription factors bind the major groove)
Chargaff's Rules and Base Pairing

| Base Pair | Type | Hydrogen Bonds |
|---|---|---|
| Adenine - Thymine (A=T) | Purine-Pyrimidine | 2 H-bonds |
| Guanine - Cytosine (G≡C) | Purine-Pyrimidine | 3 H-bonds |
- Only purine-pyrimidine pairing occurs (one 2-ring purine + one 1-ring pyrimidine) - this maintains the constant 20 Å diameter
- The base-pairing rules mean that knowing the sequence of one strand automatically defines the other (complementarity)
Overall Structure (from Thompson & Thompson Genetics)
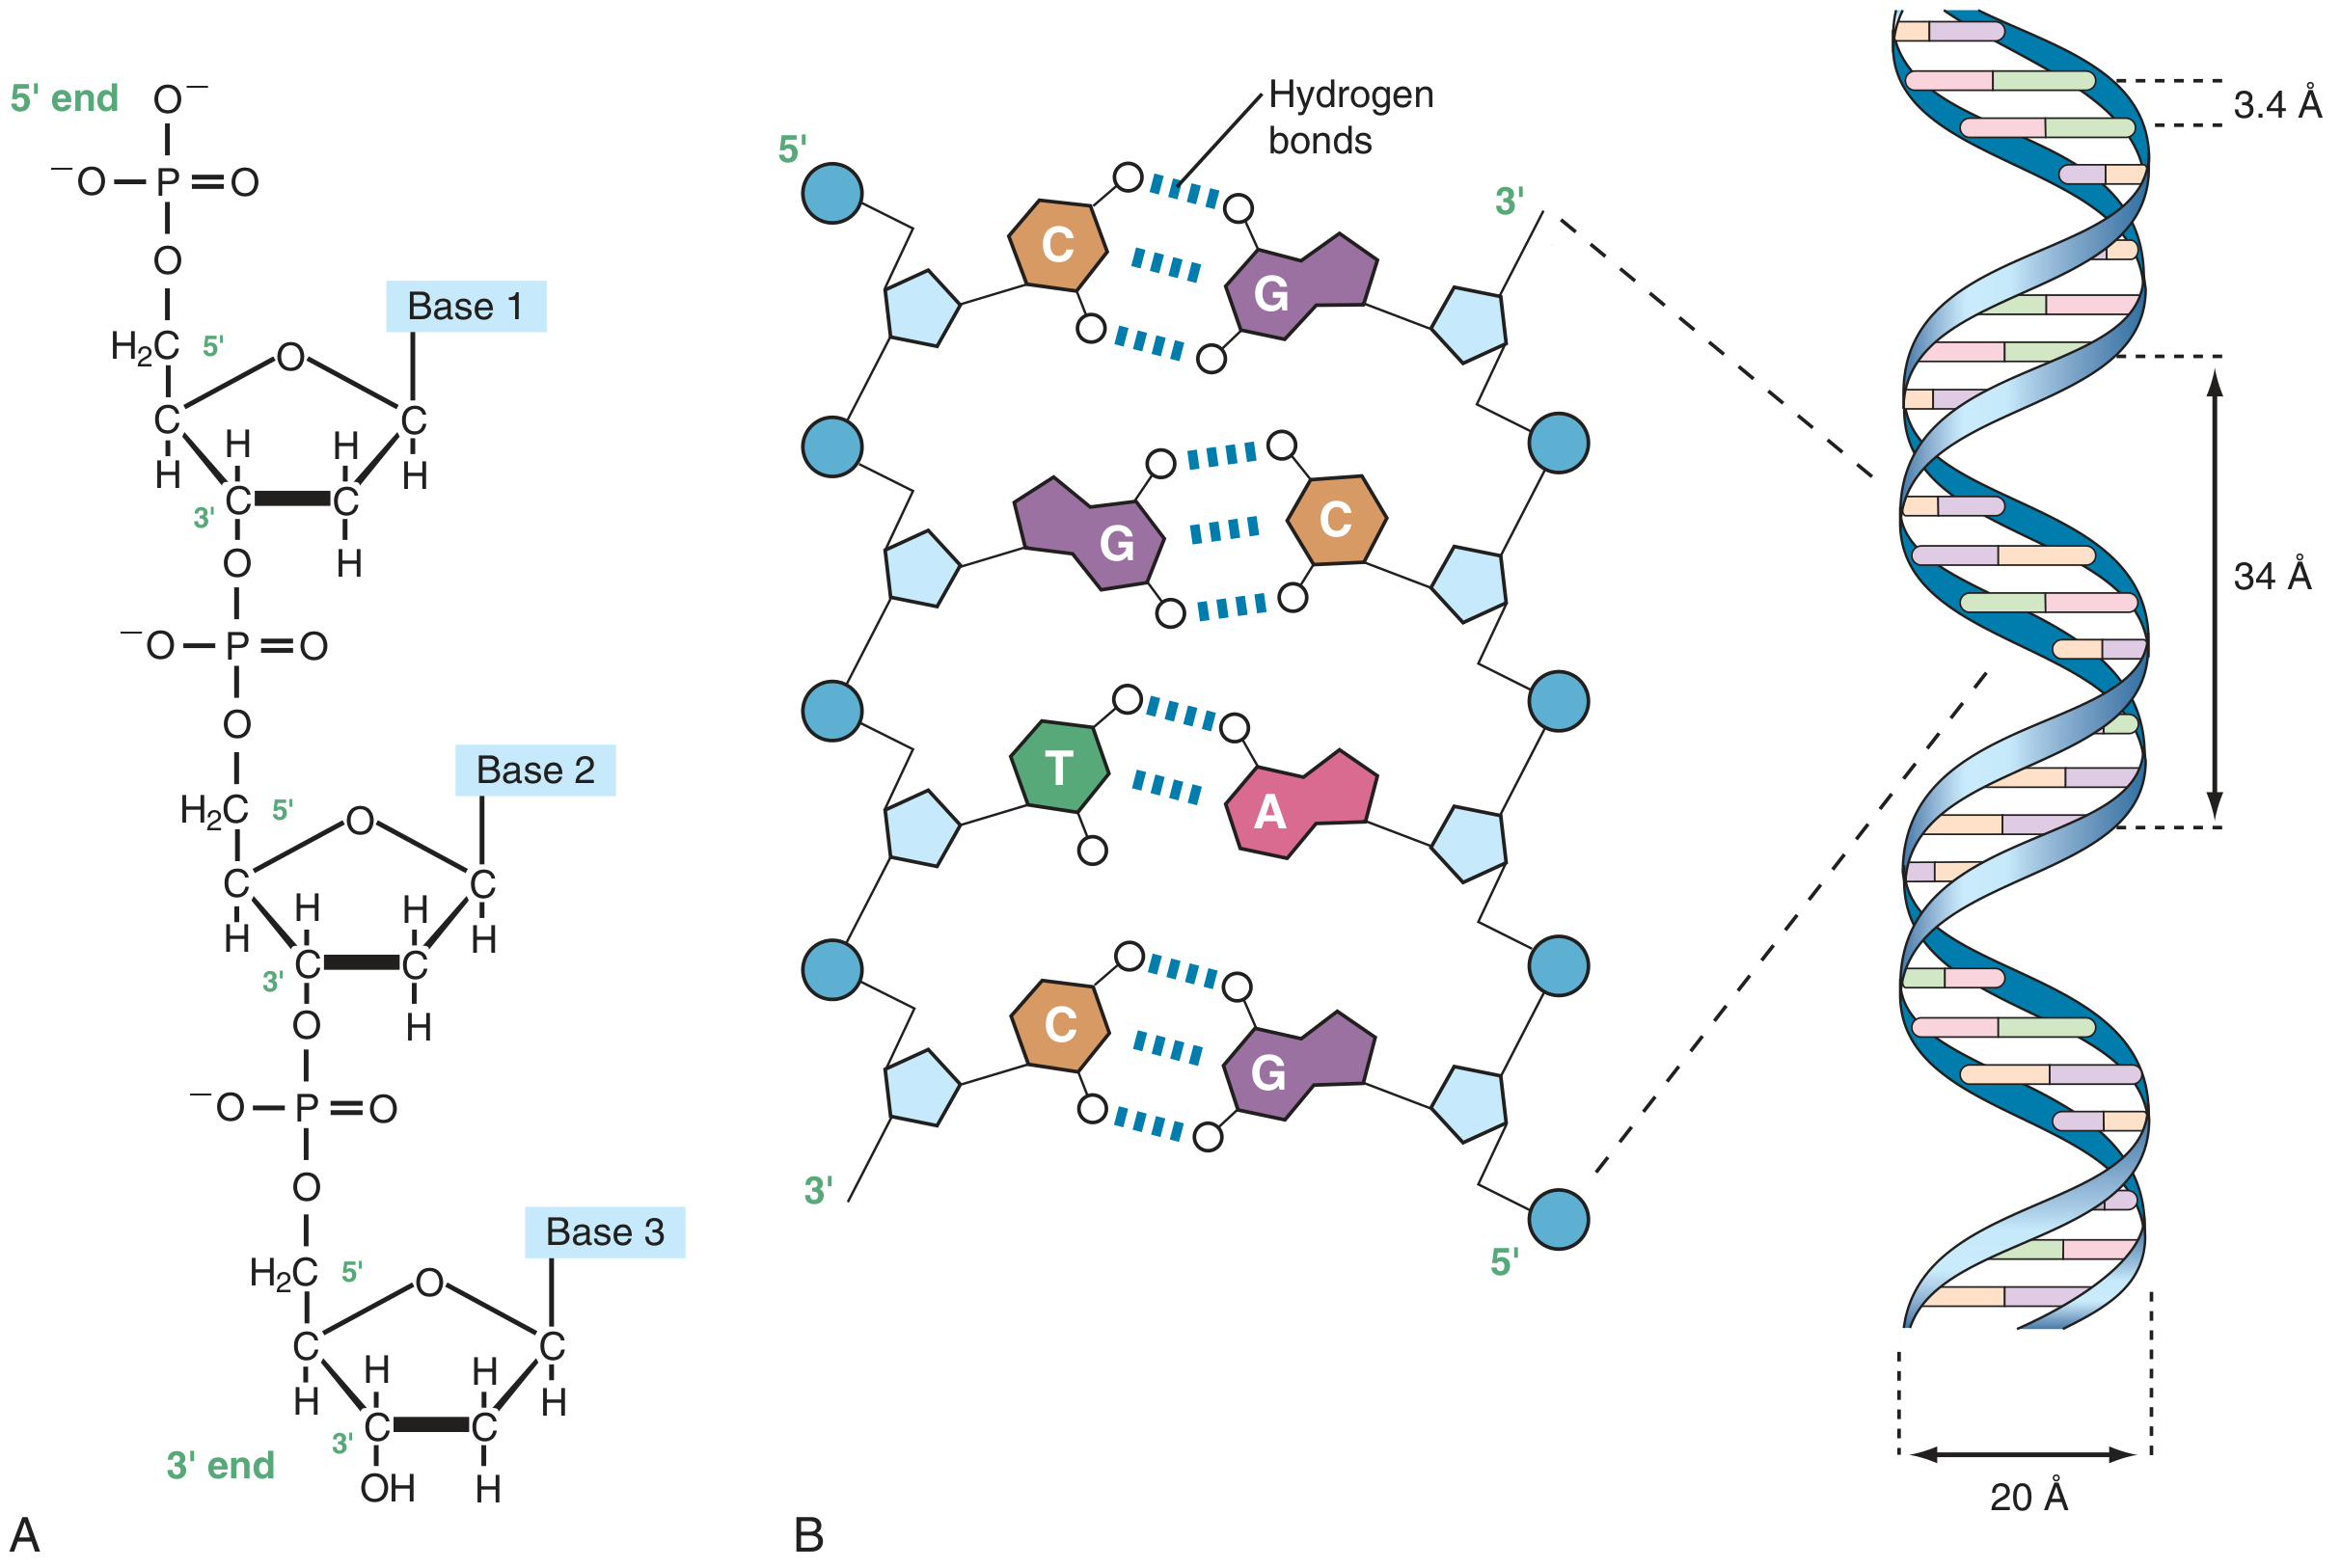
Template Strand vs. Coding Strand
- Template strand (noncoding strand) - this is the strand copied during RNA synthesis (transcription)
- Coding strand - matches the sequence of the RNA transcript (replacing T with U)
Forms of DNA
| Form | Features |
|---|---|
| B-DNA | Most common physiological form; right-handed; 10 bp/turn |
| A-DNA | Right-handed; more compact; 11 bp/turn; found in dehydrated conditions |
| Z-DNA | Left-handed; zigzag backbone; 12 bp/turn; found in GC-rich regions |
Why the Model is Biologically Important
- Explains heredity - complementary base pairing provides the mechanism for exact replication (each strand acts as a template)
- Explains genetic information storage - sequence of bases encodes protein-coding information
- Explains mutation - any change in base sequence = mutation
- Basis of central dogma - DNA → RNA → Protein
- Semiconservative replication - each daughter molecule retains one parental strand (proven by Meselson-Stahl experiment, 1958)
Exam Summary (Quick Recall)
| Feature | Value/Detail |
|---|---|
| Strands | 2, antiparallel |
| Helix type | Right-handed (B-form) |
| Diameter | 20 Å |
| Pitch | 34 Å |
| bp per turn | 10 |
| Rise per bp | 3.4 Å |
| A-T bond | 2 hydrogen bonds |
| G-C bond | 3 hydrogen bonds |
| Backbone location | Outside (hydrophilic) |
| Bases location | Inside (hydrophobic, stacked) |
| Grooves | Major (wide) + Minor (narrow) |
- Harper's Illustrated Biochemistry, 32nd Ed, Chapter 34, pp. 360-362
- Lippincott's Illustrated Reviews: Biochemistry, 8th Ed, Chapter 30, p. 1137
- Thompson & Thompson Genetics and Genomics in Medicine, 9th Ed, p. 30
- Watson JD, Crick FHC. Molecular structure of nucleic acids. Nature 1953;171:737-738