

give me simplified version of this figure which is easy to represent in university theory exam
A simplified flowchart diagram titled "Cytokine Networks in Periodontal Diseases" for university exam use. Clean white background, clear boxes and arrows, minimal clutter. Layout (top to bottom): TOP: One pink/salmon rounded box: "Pathogenic Subgingival Microbiota" with two arrows going down - left labeled "INNATE" and right labeled "ADAPTIVE" ROW 1 (two green boxes side by side): - Left: "Innate Cells (Macrophages, Fibroblasts, Mast cells, Epithelial cells)" - Right: "APCs (Langerhans cells, Dendritic cells, Macrophages)" - A bidirectional arrow between them labeled "IL-1β, IL-6 (Step 3)" From the left green box, a curved arrow back to itself labeled "Autocrine/Paracrine loops (Step 1)" From left green box, downward arrow to a blue box: "Upregulated Cytokine Secretion (IL-1β, TNF-α, IL-6, IL-8)" From right green box, downward arrow to a light yellow box: "Naive T cells (Th0 cells)" ROW 2: From "Upregulated Cytokine Secretion" box, two arrows going down-left: - Arrow 1 to orange box: "Vascular Changes + PMN Activation (IL-8, ICAM-1) → Innate Effector Functions" - Arrow 2 to orange box: "Osteoclast Recruitment (RANKL, IL-1β, PGE2) → Bone Resorption" ROW 2: From "Naive T cells (Th0)" box, four downward arrows to four teal boxes side by side, each labeled with the driving cytokines above the arrow: - "Th17 cells" (driven by IL-6, TGF-β, IL-21) - "Th2 cells" (driven by IL-4) - "Th1 cells" (driven by IFN-γ, IL-12) - "Treg cells" (driven by TGF-β, IL-2) Between Th17/Th2/Th1 boxes, small purple dashed arrows labeled "Plasticity (Step 4)" ROW 3: Arrows from T-cell boxes going down to three light blue effect boxes: - Th2 → "B-cell Responses / Humoral Immunity" (via IL-4, IL-5, IL-13) - Th1 → "Cell-Mediated Immunity" (via IFN-γ) - Treg → "Immune Suppression" (via TGF-β, IL-10) with flat-ended inhibitory arrows pointing to B-cell and Cell-mediated boxes ROW 4: Both "Innate Effector Functions" and all adaptive effect boxes converge with arrows to one wide green-to-red gradient box: "Individual Immune-Inflammatory Response (Step 8)" Final arrow pointing down to one wide orange box: "Connective Tissue Breakdown & Bone Resorption" Style: clean academic diagram, black text, color-coded boxes (pink=pathogen, green=immune cells, blue=cytokines, teal=T-cells, orange=effector outcomes), labeled numbered steps in yellow circles
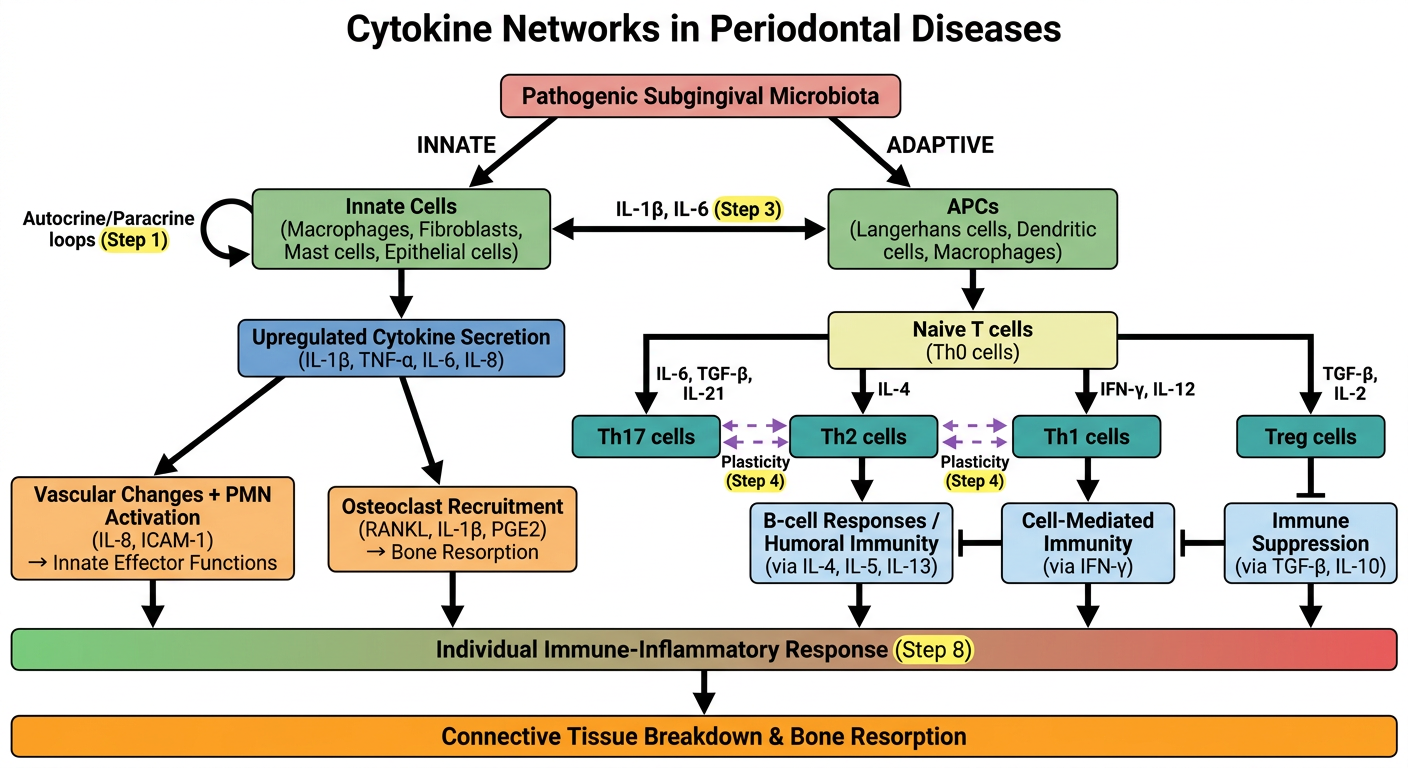
Cytokine Networks in Periodontal Diseases - Simplified
The Core Concept (One Line)
Step-by-Step Flow
- Bacteria activate macrophages, fibroblasts, mast cells, epithelial cells
- These release: IL-1β, TNF-α, IL-6, IL-8
- Sustained by autocrine/paracrine feedback loops
- IL-8, ICAM-1 → vascular changes + PMN (neutrophil) migration
- RANKL, IL-1β, PGE2 → osteoclast activation → bone resorption
- IL-1β and IL-6 activate APCs (dendritic cells, Langerhans cells, macrophages)
- APCs present antigen to naive Th0 cells
| T-cell | Driven by | Produces |
|---|---|---|
| Th17 | IL-6, TGF-β, IL-21 | IL-17, IL-23 |
| Th2 | IL-4 | IL-4, IL-5, IL-13 |
| Th1 | IFN-γ, IL-12 | IFN-γ |
| Treg | TGF-β, IL-2 | TGF-β, IL-10 |
- Note: T-cells show plasticity - Th17 can convert to Th1 (IL-12) or Th2 (IL-4)
- Th2 → B-cell responses / humoral immunity (antibodies)
- Th1 → Cell-mediated immunity
- Treg secretes TGF-β and IL-10 → suppresses Th1, Th2, macrophages
- IL-10 inhibits B-cell and cell-mediated responses (negative feedback)
- All innate + adaptive effector functions combine → Individual immune-inflammatory response → Connective tissue breakdown + bone resorption
Memory Aid for T-cell Cytokines
- "17 needs 6" - Th17 differentiation needs IL-6
- "1 fights in" - Th1 produces IFN-γ (interferon)
- "2 is for antibodies" - Th2 drives humoral/B-cell immunity
- "Reg suppresses" - Treg = suppression via IL-10 and TGF-β