
Prepare ppt on ecg for mbbs third year student - basics & hoe to read ecg reference life in fast lane
ECG electrocardiogram normal sinus rhythm PQRST waves diagram
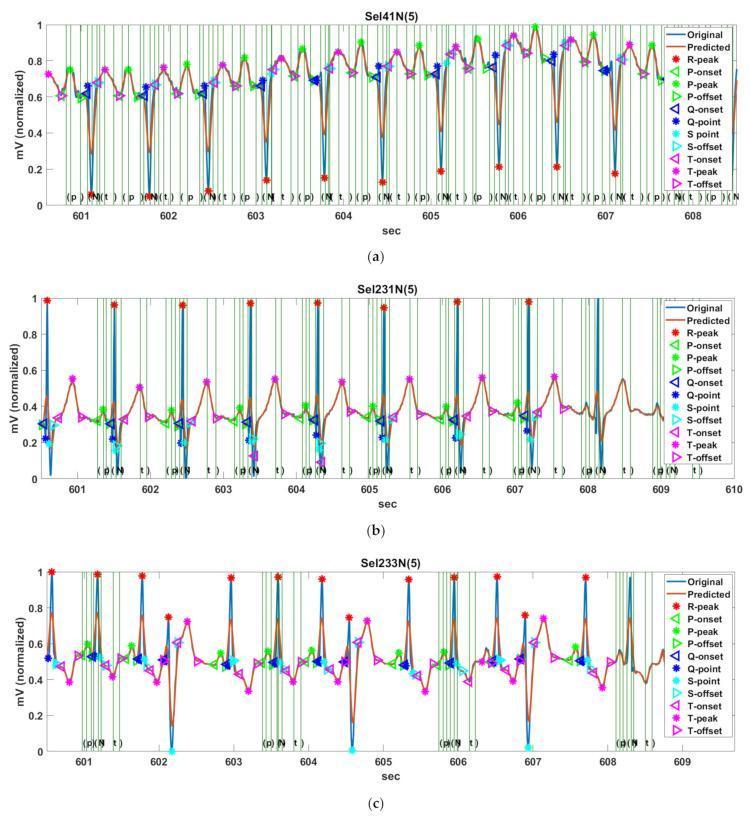
This diagnostic image displays three electrocardiogram (ECG) tracings, labeled (a) Sel41N(5), (b) Sel231N(5), and (c) Sel233N(5), illustrating fiducial point (FP) detection for PQRST complexes. Each panel plots normalized voltage (mV) against time (sec), featuring automated markers for R-peaks, P-waves, Q-points, S-points, and T-waves, including their respective onsets and offsets. Tracing (a) demonstrates inverted R-waves with prominent P- and T-waves, characteristic of high-risk cardiac states. Tracing (b) shows normal sinus rhythm with hyperacute T-waves, where the S-offset and T-onset are closely situated. Tracing (c) illustrates an arrhythmia rhythm with inverted T-waves and deep S-waves. Vertical green lines represent ground-truth annotations from the QT database, while colored icons (stars, triangles, circles) indicate predicted points such as P-peak (green asterisk), R-peak (red asterisk), and T-peak (pink asterisk). The image serves as an educational tool for evaluating algorithmic accuracy in identifying cardiac waveform morphology across diverse pathological rhythms including ST-segment changes and conduction abnormalities.
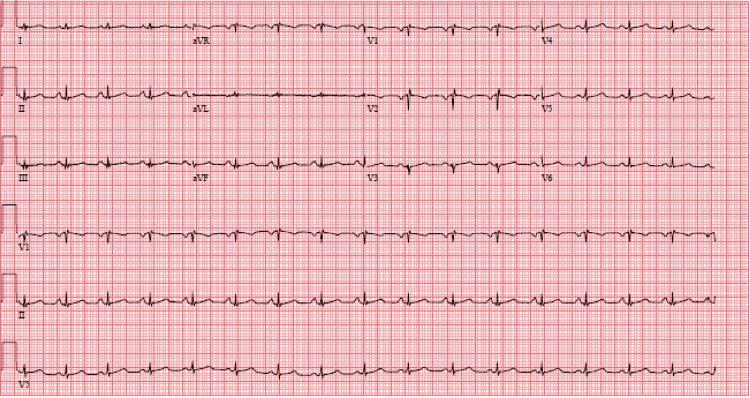
A standard 12-lead electrocardiogram (ECG) displayed on a red grid background, demonstrating a normal sinus rhythm with a heart rate of approximately 97 beats per minute. The primary diagnostic finding is generalized low voltage, characterized by QRS complex amplitudes of less than 5 mm (0.5 mV) in all limb leads (I, II, III, aVR, aVL, and aVF) and less than 10 mm (1.0 mV) across all precordial leads (V1-V6). The rhythm is regular with upright P waves in lead II and inverted P waves in aVR, each preceding a narrow QRS complex. There is subtle evidence suggesting possible left atrial enlargement. This ECG is representative of clinical conditions where electrical signal conduction to the surface electrodes is attenuated, such as large pericardial effusions or cardiac tamponade, particularly relevant in the context of post-viral inflammatory complications like COVID-19.
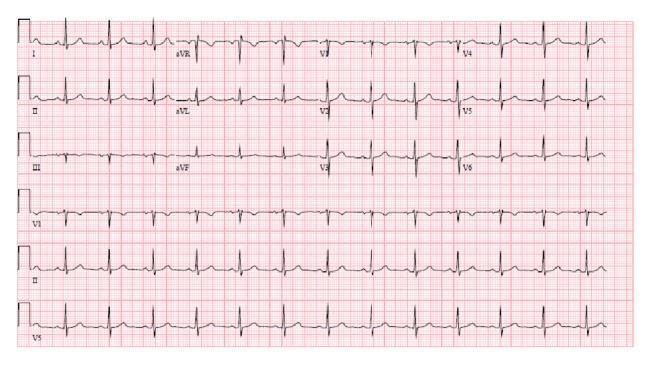
A standard 12-lead electrocardiogram (ECG) printed on pink grid paper, presenting a normal sinus rhythm at a rate of approximately 75 beats per minute. The tracing displays leads I, II, III (limb leads); aVR, aVL, aVF (augmented leads); and V1 through V6 (precordial leads). Each narrow QRS complex is preceded by a distinct, upright P wave in leads I, II, and aVF, signifying regular sinoatrial node conduction. The PR and QT intervals appear within normal physiological limits, and the QRS duration is not prolonged. T waves are concordant with the QRS complexes in the lateral leads, and there is no evidence of ST-segment elevation or depression, indicating an absence of acute ischemic changes. This ECG represents a stable postoperative cardiac rhythm following a permanent pacemaker implantation, demonstrating successful restoration of a regular heart rate and rhythm.
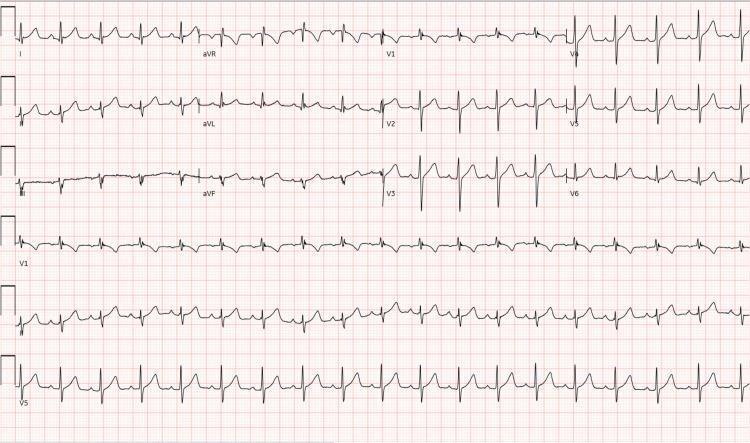
A standard 12-lead electrocardiogram (ECG) displayed in a multi-channel format, including rhythm strips at the bottom. The tracing demonstrates a normal sinus rhythm with a heart rate of approximately 82 beats per minute. P-wave morphology is normal and upright in leads I, II, and aVF, with a 1:1 AV relationship. QRS complexes are narrow (<120 ms) with normal R-wave progression in the precordial leads (V1-V6). No significant ST-segment deviations (elevation or depression), pathological Q waves, or T-wave inversions are observed. Notably, despite clinical context of severe hypokalemia (2.1 mmol/L) and thyrotoxicosis, this specific tracing lacks characteristic features of hypokalemia such as prominent U waves or ST-segment flattening. The ECG serves as an educational example of a regular sinus rhythm in a clinical case of thyrotoxic periodic paralysis.
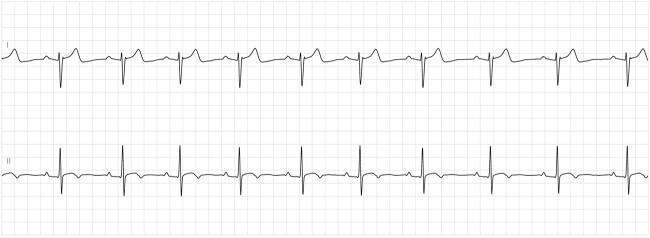
This diagnostic image displays a two-lead electrocardiogram (ECG) rhythm strip, likely from a Holter monitor, showing a regular sinus rhythm. The top tracing (Lead I) and bottom tracing (Lead II) demonstrate consistent PQRST morphology across a standard grid background. Each cardiac cycle consists of a visible P wave preceding a narrow QRS complex, followed by a symmetric T wave. The R-R intervals are regular, indicating a stable heart rate and rhythm. Clinically, this image serves as an educational example of normalized electrical conduction after recovery from high-grade atrioventricular block, specifically in the context of Lyme carditis treatment. The lack of PR prolongation or dropped beats highlights the resolution of the conduction delay. Key educational features include the 1:1 atrioventricular relationship and the absence of morphological abnormalities in the repolarization phase (T waves), confirming clinical stability upon discharge.
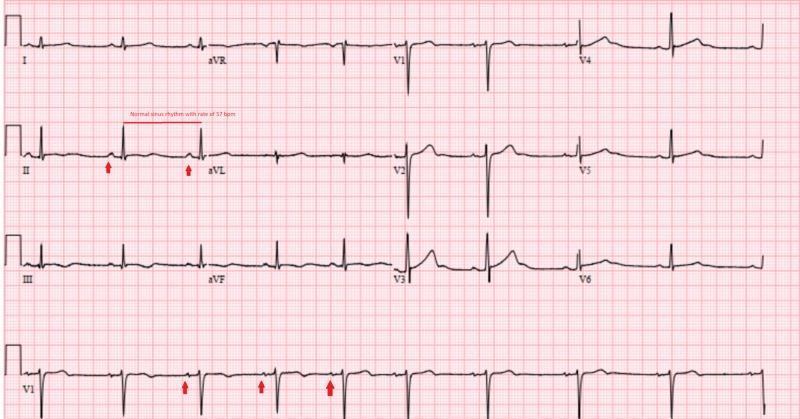
A standard 12-lead electrocardiogram (ECG/EKG) displayed on a pink grid, showing a normal sinus rhythm with a heart rate of approximately 57 beats per minute (bpm). The tracing includes the standard limb leads (I, II, III), augmented limb leads (aVR, aVL, aVF), and precordial leads (V1-V6). Red arrows in leads II and VI highlight clear P waves preceding each QRS complex, indicating sinus origin. The rhythm is regular with consistent R-R intervals and narrow QRS complexes. Precordial leads V1-V6 demonstrate normal R-wave progression, transitioning from a predominantly negative (S-wave dominant) morphology in V1 and V2 to a positive (R-wave dominant) morphology in V4 through V6. This tracing represents the resolution of cardiac arrhythmias (previously junctional bradycardia and A-V dissociation) following the correction of severe hypophosphatemia. The educational focus is on identifying normal sinus rhythm characteristics, including wave morphology and regular intervals in a clinical cardiology context.
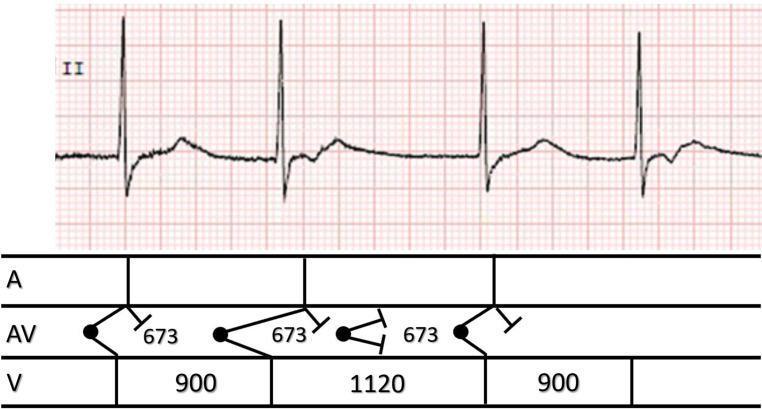
This diagnostic image contains a single-lead electrocardiogram (ECG) rhythm strip from lead II, paired with a corresponding ladder diagram to illustrate cardiac conduction. The ECG demonstrates group beating with variable R-R intervals (900ms and 1120ms), absence of normal sinus P waves, and the presence of retrograde P waves (inverted deflections following the QRS complexes). The visual evidence points to a junctional rhythm with retrograde atrial conduction and occasional reciprocal (echo) beats. The ladder diagram below the tracing provides a schematic representation of conduction across three levels: Atria (A), Atrioventricular node (AV), and Ventricles (V). It specifically denotes timing intervals (673ms, 900ms, 1120ms) and uses standard symbols to indicate points of origin (dots), antegrade and retrograde conduction pathways (angled lines), and conduction block (perpendicular bars). This material is designed for intermediate to advanced cardiovascular education, specifically focusing on complex arrhythmia interpretation and the electrophysiological mechanism of re-entrant junctional rhythms.
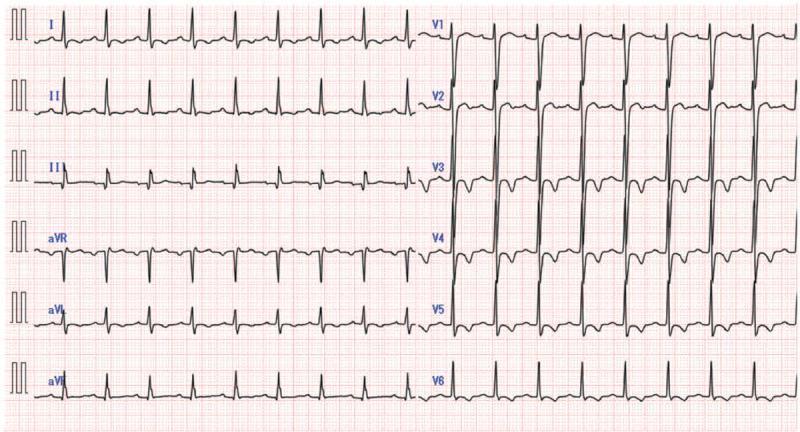
A standard 12-lead electrocardiogram (ECG) displayed on a grid of small (1mm) and large (5mm) squares. The tracing shows a normal sinus rhythm with a heart rate of approximately 75 beats per minute. Each QRS complex is preceded by a consistent P wave with a normal PR interval. The QRS complexes are narrow (<120 ms), and there is a normal R-wave progression in the precordial leads (V1-V6). The QTc interval is within the normal range (measured at 429 ms), indicating a resolution of prior prolongation. The limb leads (I, II, III, aVR, aVL, aVF) demonstrate a normal axis, with predominantly upright complexes in leads I and II. There are no signs of ST-segment elevation, ST-segment depression, or pathological Q waves. This ECG represents a stable electrophysiological state following the resolution of tricyclic antidepressant (TCA)-induced cardiotoxicity and tachyarrhythmias.
12 lead ECG placement chest leads limb leads electrode positions
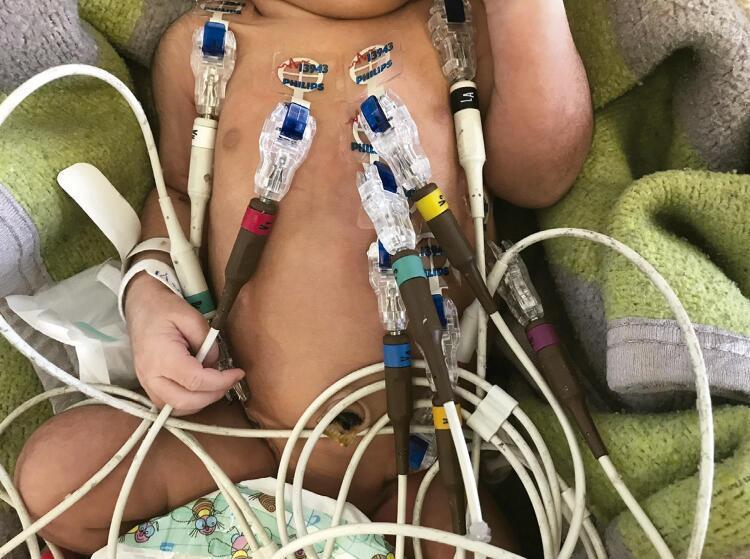
A clinical photograph illustrating the standardized placement of a 12-lead electrocardiogram (ECG) on a neonate. The image shows several electrodes secured to the newborn's skin using clear adhesive gel tabs (Philips brand). The electrode distribution follows neonatology guidelines to minimize motion artifacts: the four limb leads are positioned on the right and left shoulders and the right and left iliac crests, rather than the distal extremities. The precordial leads (V1-V6) are arranged across the anterior chest wall. Each electrode consists of a transparent plastic clip housing, a tapered brown connector with color-coded bands (including red, yellow, green, blue, and purple) for lead identification, and white cabling. The clinical context demonstrates the procedural adaptations required for neonatal cardiac monitoring, such as using torso placement for limb leads to improve signal-to-noise ratio in active infants.
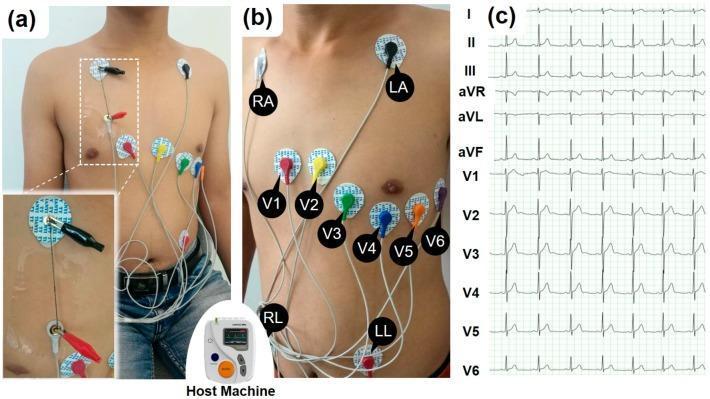
This composite educational graphic illustrates the procedural setup and resulting data for a standard 12-lead electrocardiogram (ECG/EKG). Panels (a) and (b) are clinical photographs demonstrating correct electrode placement on a male torso. The limb leads are positioned as RA (right arm/shoulder) and LA (left arm/shoulder) on the upper chest, with RL (right leg) and LL (left leg) on the lower abdomen. The precordial leads (V1-V6) follow the standard anatomical arc across the chest: V1 and V2 at the fourth intercostal space (right and left of the sternum), V4 at the fifth intercostal space (mid-clavicular line), and V3, V5, and V6 completing the transverse sequence toward the left axilla. Panel (a) includes an inset showing the experimental use of conductive carbon nanotube yarns (SWNT-CYs) connected via alligator clips to the electrodes. Panel (c) displays the resulting 12-lead ECG waveforms on a standard grid, labeled I, II, III, aVR, aVL, aVF, and V1-V6. Each lead shows distinct P-waves, QRS complexes, and T-waves, representing different electrical vectors of cardiac depolarization and repolarization.
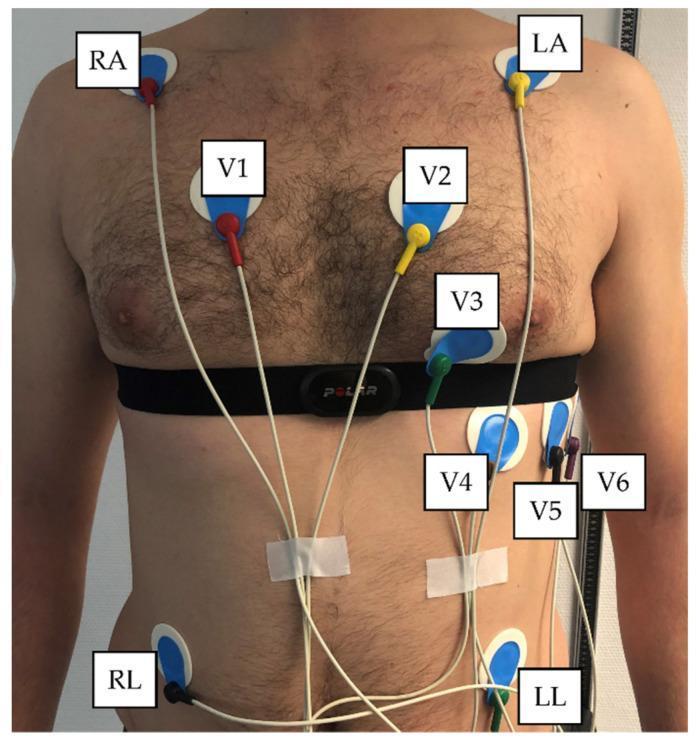
This procedural clinical photograph demonstrates the concurrent placement of a standard 12-lead electrocardiogram (ECG) and a Polar H10 heart rate sensor chest strap on a male subject. The image illustrates proper anatomical positioning for clinical and exercise physiology monitoring. The six precordial leads (V1-V6) are visible across the chest: V1 (4th intercostal space, right sternal border), V2 (4th intercostal space, left sternal border), V3 (midway between V2 and V4), V4 (5th intercostal space, mid-clavicular line), V5 (anterior axillary line), and V6 (mid-axillary line). The leads utilize standard color-coding (Red, Yellow, Green, Brown, Black, Violet). Limb leads are positioned at the shoulders (RA/LA) and the lower ribcage/abdominal area (RL/LL) to facilitate movement during testing. The Polar H10 chest strap is situated inferior to the pectoral muscles, intersecting the mid-precordial electrode line. This visual serves as an educational reference for electrode application in comparative heart rate variability (HRV) studies, highlighting the spatial relationship between traditional medical grade ECG sensors and wearable consumer fitness technology.
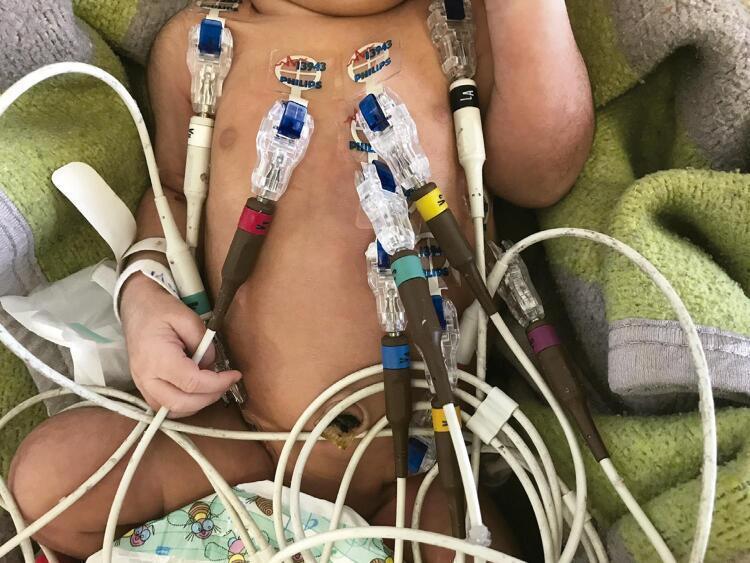
This clinical photograph demonstrates the specific electrode placement for a 12-lead electrocardiogram (ECG) on a neonate. To minimize motion artifact and signal noise common in newborns, the limb leads are repositioned: electrodes are placed on the right and left shoulders instead of the arms, and on the right and left iliac crests instead of the lower limbs. Precordial electrodes V1 through V6 are arranged across the anterior chest wall following standard anatomical landmarks. The image shows clear adhesive solid gel tab electrodes (Philips brand) connected via a system of color-coded brown 'grabber' style connectors (red, yellow, green, blue, and purple) to white insulated lead wires. This procedural setup illustrates specialized pediatric cardiovascular monitoring techniques designed to ensure high-quality diagnostic signals while accommodating neonatal anatomy and movement.
ECG heart block atrial fibrillation ST elevation MI arrhythmia
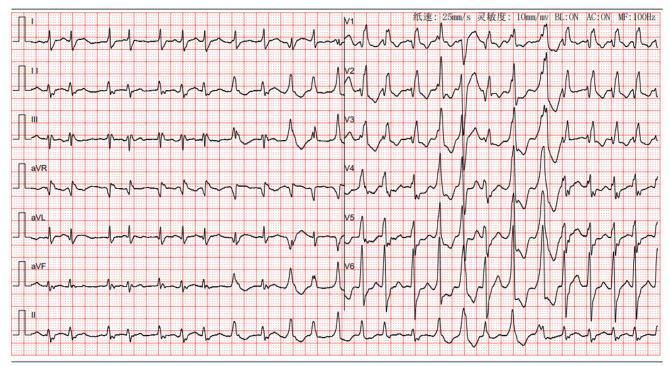
A standard 12-lead electrocardiogram (ECG) demonstrating a complex mixed arrhythmia in a patient with dilated cardiomyopathy and cardiogenic shock. The rhythm is irregularly irregular with the absence of discrete P waves, replaced by fine fibrillatory waves, characteristic of atrial fibrillation. Notable features include frequent premature ventricular complexes (PVCs) and a widened QRS duration (>120ms). Lead V1 shows a tall R wave followed by a deep S wave, and Lead V6 exhibits broad, slurred S waves, diagnostic of a complete right bundle branch block (RBBB). Significant ST-segment and T-wave abnormalities are visible across the precordial leads (V1-V6), likely representing secondary repolarization changes from the RBBB or underlying myocardial ischemia. The ECG indicates severe cardiac conduction system involvement and ventricular irritability in the context of acute decompensated heart failure.
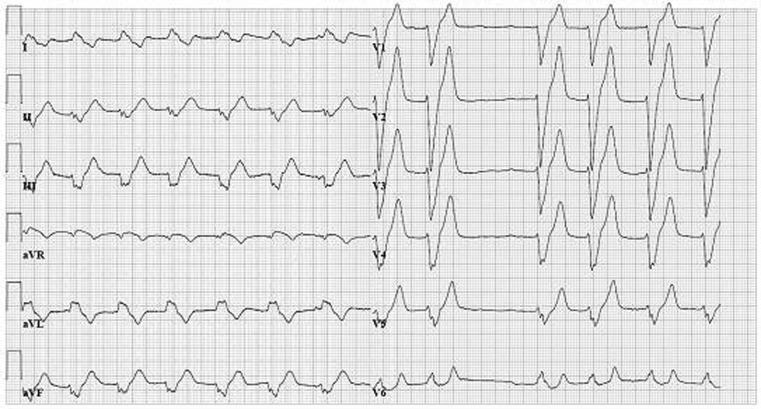
A 12-lead electrocardiogram (ECG) demonstrating the co-occurrence of atrial fibrillation and rate-dependent left bundle branch block (LBBB). The rhythm is irregularly irregular with an absence of discernible P waves, replaced by fine fibrillatory undulations of the baseline, characteristic of atrial fibrillation. The QRS complexes are significantly widened (greater than 120 ms), indicating an intraventricular conduction delay. In the precordial leads V1-V3, there is a predominantly negative, wide, and notched QRS morphology. The lateral leads (I, aVL, V5, and V6) show tall, broad, and slurred R-waves. Secondary ST-T wave changes are visible, including ST-segment depression and T-wave inversion in the lateral leads, which are discordant to the QRS polarity. This pattern is consistent with a complete left bundle branch block. The ECG serves as an educational example of how metabolic derangements, such as hyperkalemia, or physiological triggers like increased heart rate, can precipitate conduction abnormalities in a patient with underlying atrial arrhythmia.
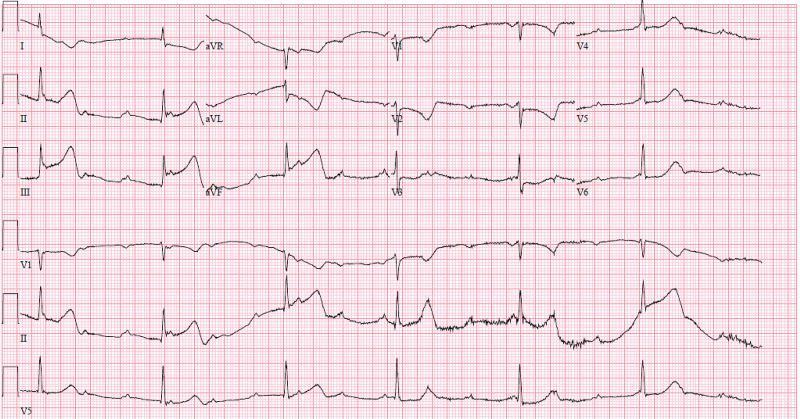
A standard 12-lead electrocardiogram (ECG) with rhythm strips (V1, II, V5) showing an acute inferior ST-elevation myocardial infarction (STEMI) complicated by high-grade atrioventricular (AV) block. Significant ST-segment elevation is present in the inferior leads (II, III, and aVF), with the magnitude of elevation in lead III exceeding that in lead II, suggesting a right coronary artery (RCA) occlusion. Reciprocal ST-segment depression and T-wave inversion are visible in the high lateral leads (I, aVL) and anterior lead V2. The rhythm analysis reveals complete heart block (third-degree AV block) characterized by atrioventricular dissociation, with an atrial rate significantly faster than the ventricular escape rate (approximately 37 bpm). The QRS complexes are wide, and P waves do not maintain a fixed relationship with the ventricular activity. This visual findings are pathognomonic for an inferior wall MI with ischemia to the AV node, commonly associated with a proximal RCA lesion.
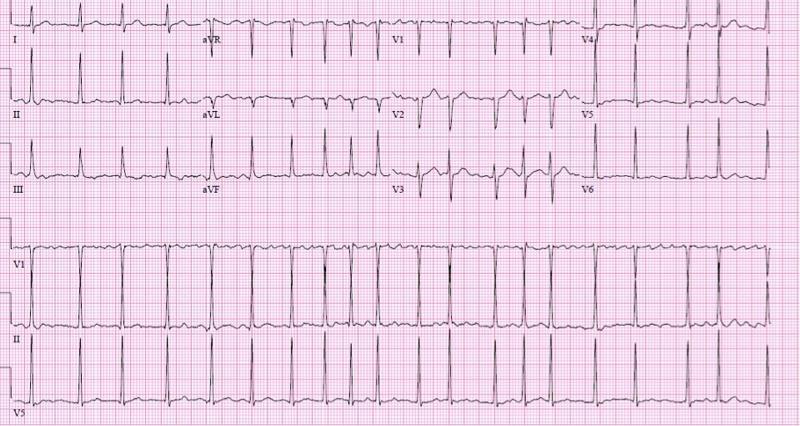
This diagnostic image is a 12-lead electrocardiogram (ECG) printed on standard pink grid paper, demonstrating atrial fibrillation (AF) with a rapid ventricular response (RVR). The tracing shows the standard 12 leads (I, II, III, aVR, aVL, aVF, V1-V6) in a multi-channel format, with three continuous rhythm strips (V1, II, and V5) at the bottom. Key diagnostic features include the absolute absence of organized P waves and an irregular, undulating fibrillatory baseline most prominent in lead V1. The ventricular rhythm is tachycardic and 'irregularly irregular,' characterized by varying R-R intervals. The QRS complexes are narrow (less than 120 ms), indicating supraventricular origin of conduction through the AV node. ST segments are generally isoelectric without acute ST-elevation or depression. This ECG is a classic clinical representation used to teach cardiac arrhythmia recognition, specifically the hemodynamic and electrical manifestations of AF with uncontrolled rapid heart rate.
Life in the Fast Lane ECG basics how to read ECG PQRST intervals 2024
ECG axis deviation left right cardiac axis hexaxial system
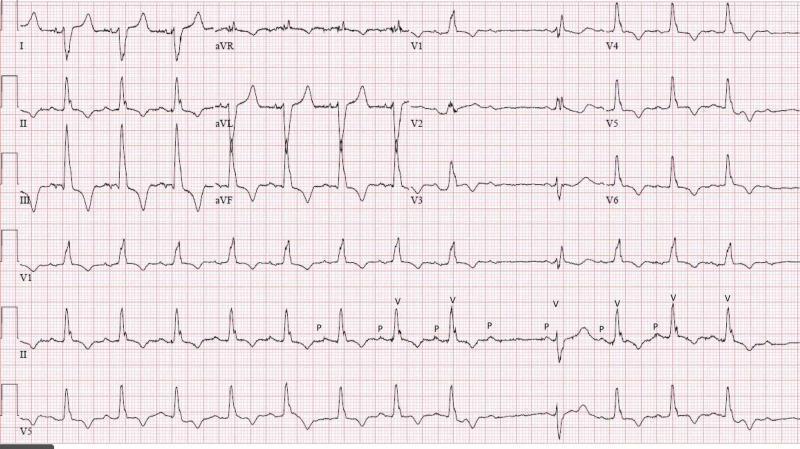
A standard 12-lead electrocardiogram (ECG) with rhythm strips (II, V1, V5) demonstrating complex cardiac conduction system disease. Key findings include a widened QRS complex (>120 ms) with an rSR' pattern in lead V1 and slurred S-waves in leads V5 and V6, diagnostic of a Right Bundle Branch Block (RBBB). The limb leads show a right axis deviation (negative QRS in lead I, positive in II and III), which, in combination with RBBB, is consistent with a bifascicular block (specifically RBBB and Left Posterior Fascicular Block). The rhythm strip in lead II is annotated with 'P' and 'V' to highlight atrioventricular dissociation features. It clearly demonstrates Second-degree AV block Mobitz Type II, evidenced by intermittent non-conducted P-waves ('dropped QRS') without progressive PR-interval lengthening. Additionally, the tracing shows a prolonged QTc interval. This ECG illustrates an incomplete trifascicular block, signifying advanced multi-fascicular disease and infra-Hisian conduction failure.
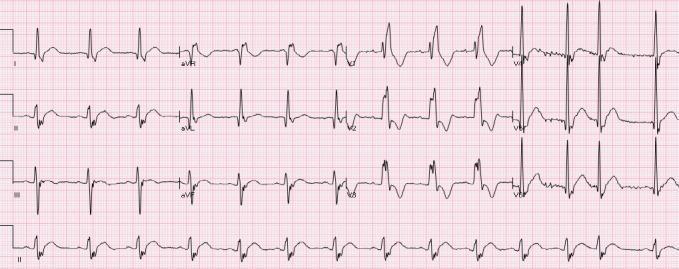
This diagnostic image is a 12-lead electrocardiogram (ECG) demonstrating a combination of conduction abnormalities and ST-segment deviations. The ECG shows a widened QRS complex with an rSR' pattern in the right precordial leads (V1-V3), characteristic of a Right Bundle Branch Block (RBBB). Concomitant left axis deviation is present, indicative of a Left Anterior Fascicular Block (LAFB), together forming a bifascicular block pattern. Notably, there is mild, diffuse ST-segment elevation (STE) visible in the lateral leads (I, aVL, V4-V6) and inferior leads (II, aVF). In the clinical context of non-ischemic dilated cardiomyopathy with negative cardiac biomarkers, these ST-segment changes represent a chronic, non-ischemic ST-elevation (NISTE) pattern rather than acute myocardial infarction. The ST segments appear relatively stable and are associated with secondary repolarization changes from the intraventricular conduction delay. This tracing serves as an educational example of how baseline conduction defects and cardiomyopathy can simulate or mask ischemic patterns, emphasizing the importance of clinical correlation and comparison with prior ECGs in diagnosis.
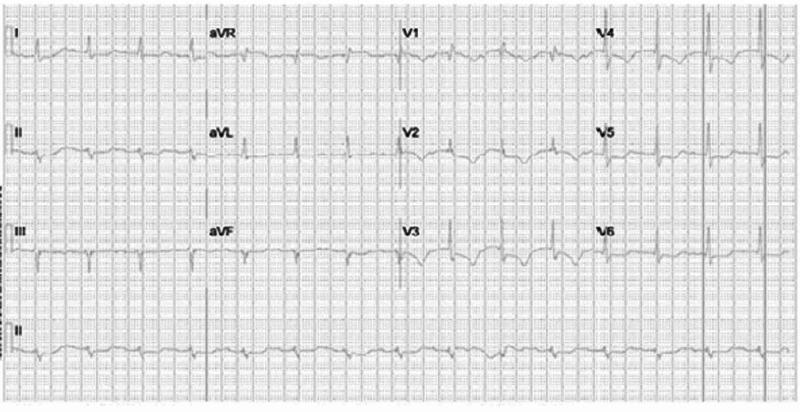
A 12-lead electrocardiogram (ECG) demonstrating a bifascicular block pattern. The tracing shows a sinus rhythm with several key conduction abnormalities. The limb leads reveal a marked left axis deviation (LAD), characterized by a predominantly positive QRS complex in lead I and a negative QRS complex in leads II and aVF, consistent with a left anterior fascicular block (LAFB). In the precordial leads (V1-V6), there is evidence of an incomplete right bundle branch block (IRBBB), indicated by an rSr' pattern in lead V1 and slurred S waves in the lateral leads (V5, V6). The PR interval is slightly prolonged, suggesting an associated first-degree atrioventricular (AV) block. This combination of LAFB and IRBBB constitutes a bifascicular block, which in the clinical context of aortic root abscess or infective endocarditis, may indicate progressive involvement of the cardiac conduction system.
ECG bundle branch block left right LBBB RBBB pattern
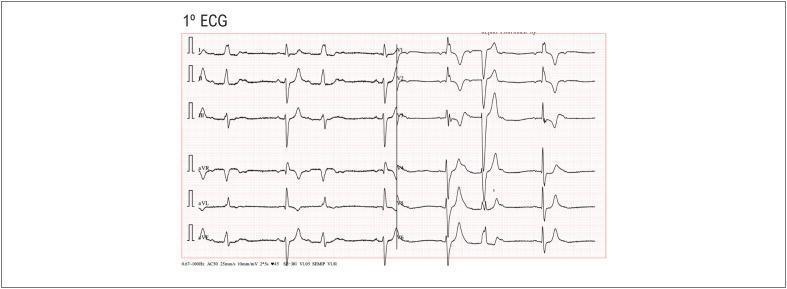
This diagnostic image is a 12-lead electrocardiogram (ECG) demonstrating a rare alternating bundle branch block pattern associated with second-degree atrioventricular (AV) block. The tracing reveals a beat-to-beat alternation in QRS morphology: one beat exhibits a Right Bundle Branch Block (RBBB) pattern (characterized by an rsR' 'rabbit ear' morphology in lead V1), while the subsequent beat displays a Left Bundle Branch Block (LBBB) pattern (notched or slurred R waves in lateral leads like V5-V6). Additionally, the ECG shows features of Mobitz Type I (Wenckebach) AV block, evidenced by progressive prolongation of the PR interval until a P wave fails to conduct to the ventricles, resulting in a dropped QRS complex. This combination suggests significant, multi-level disease of the infra-nodal conduction system (His-Purkinje system). The educational focus of this visual is the recognition of unstable intraventricular conduction delays and high-grade AV block patterns that often necessitate pacemaker intervention.
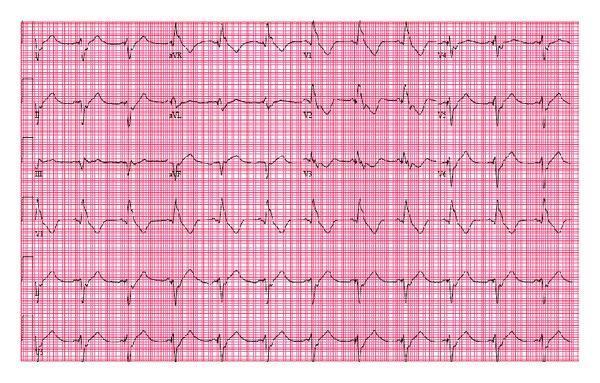
A standard 12-lead electrocardiogram (ECG) printed on red grid paper demonstrating a ventricular paced rhythm with a right bundle branch block (RBBB) morphology. Each cardiac cycle is preceded by a distinct vertical pacemaker spike immediately before the QRS complex. The QRS complexes are significantly widened (prolonged duration) across all leads. In the right precordial lead (V1), a prominent 'rsR' pattern or notched R-wave is visible, characteristic of RBBB. The lateral leads (I, aVL, V5, V6) show broad, slurred S-waves. The rhythm is irregularly irregular, consistent with underlying atrial fibrillation. The T-waves demonstrate secondary repolarization changes, appearing inverted or discordant with the primary QRS deflection in several leads. This tracing is clinically significant for demonstrating an atypical pacing pattern; while right ventricular pacing typically produces a left bundle branch block (LBBB) morphology, the RBBB pattern shown here may indicate lead malposition into the left ventricle or an interventricular septal defect.
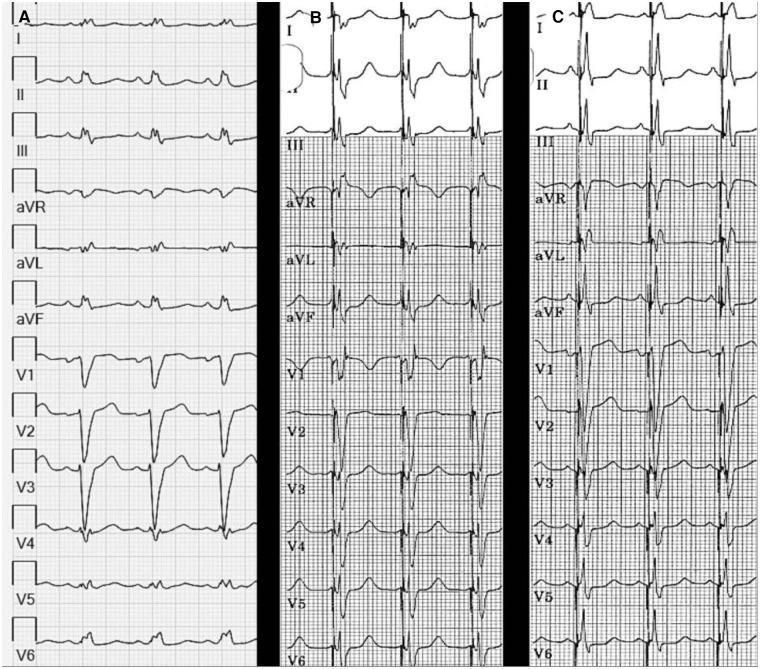
A comparison of three 12-lead electrocardiogram (ECG) strips (labeled A, B, and C) illustrating the effects of Left Bundle Branch Area Pacing (LBBAP) on ventricular activation. Panel A displays baseline sinus rhythm with Left Bundle Branch Block (LBBB), characterized by a wide QRS duration (156 ms), dominant S waves in V1-V3, and broad R waves in I, aVL, and V6. Panel B shows LBBAP with a short Atrioventricular (AV) delay of 40 ms, resulting in a reduced QRS duration of 128 ms and a Right Bundle Branch Block (RBBB) morphology in lead V1 (rSR' pattern), indicating left ventricular capture. Panel C demonstrates the normalization of the QRS complex (120 ms) by increasing the AV delay to 80 ms. This adjustment facilitates physiological fusion between the paced left ventricular activation and intrinsic anterograde conduction through the right bundle. The sequence highlights the transition from wide-complex dyssynchrony to a more narrow, synchronized ventricular activation pattern, with associated improvements in T-wave morphology and ST-segment alignment across the limb and precordial leads.
https://litfl.com/ecg-interpretation-the-basics
mkdir -p /tmp/workspace/ecg-ppt && ls /tmp/workspace/ecg-ppt/
~/ecg-ppt/build_ecg_ppt.py
import json, subprocess, base64
from io import BytesIO
from pptx import Presentation
from pptx.util import Inches, Pt, Emu
from pptx.dml.color import RGBColor
from pptx.enum.text import PP_ALIGN, MSO_ANCHOR
from pptx.oxml.ns import qn
from lxml import etree

# ── Colour palette ──────────────────────────────────────────────────────────
NAVY    = RGBColor(0x0D, 0x2B, 0x55)   # deep navy title bg
TEAL    = RGBColor(0x00, 0x8B, 0x8B)   # teal accent
RED     = RGBColor(0xC0, 0x39, 0x2B)   # ECG red / alert
WHITE   = RGBColor(0xFF, 0xFF, 0xFF)
LIGHT   = RGBColor(0xEA, 0xF4, 0xF4)   # very light teal bg
DARK    = RGBColor(0x1A, 0x1A, 0x2E)
YELLOW  = RGBColor(0xFF, 0xD7, 0x00)
GREEN   = RGBColor(0x1A, 0x8C, 0x5F)
ORANGE  = RGBColor(0xE6, 0x7E, 0x22)
LGRAY   = RGBColor(0xF2, 0xF2, 0xF2)

prs = Presentation()
prs.slide_width  = Inches(13.333)
prs.slide_height = Inches(7.5)

blank = prs.slide_layouts[6]

# ── Helper functions ─────────────────────────────────────────────────────────
def add_rect(slide, x, y, w, h, fill_color, alpha=None):
    shape = slide.shapes.add_shape(1, Inches(x), Inches(y), Inches(w), Inches(h))
    shape.line.fill.background()
    if fill_color:
        shape.fill.solid()
        shape.fill.fore_color.rgb = fill_color
    else:
        shape.fill.background()
    return shape

def add_text(slide, text, x, y, w, h, size=18, bold=False, color=WHITE,
             align=PP_ALIGN.LEFT, valign=MSO_ANCHOR.MIDDLE, wrap=True, italic=False):
    tb = slide.shapes.add_textbox(Inches(x), Inches(y), Inches(w), Inches(h))
    tf = tb.text_frame
    tf.word_wrap = wrap
    tf.vertical_anchor = valign
    tf.margin_left = Pt(4)
    tf.margin_right = Pt(2)
    tf.margin_top = Pt(2)
    tf.margin_bottom = Pt(2)
    p = tf.paragraphs[0]
    p.alignment = align
    run = p.add_run()
    run.text = text
    run.font.size = Pt(size)
    run.font.bold = bold
    run.font.italic = italic
    run.font.color.rgb = color
    run.font.name = "Calibri"
    return tb

def add_multiline_text(slide, lines, x, y, w, h, size=16, color=DARK,
                       bold_first=False, bullet_char="• ", line_spacing=1.2):
    """lines: list of (text, bold, color_override)  OR  just strings"""
    tb = slide.shapes.add_textbox(Inches(x), Inches(y), Inches(w), Inches(h))
    tf = tb.text_frame
    tf.word_wrap = True
    tf.margin_left = Pt(4)
    tf.margin_right = Pt(4)
    tf.margin_top = Pt(2)
    tf.margin_bottom = Pt(2)
    first = True
    for item in lines:
        if isinstance(item, str):
            txt, bld, col = item, False, color
        else:
            txt, bld, col = item[0], item[1], item[2] if len(item) > 2 else color
        if first:
            p = tf.paragraphs[0]
            first = False
        else:
            p = tf.add_paragraph()
        p.alignment = PP_ALIGN.LEFT
        from pptx.util import Pt as Ptx
        p.line_spacing = line_spacing
        run = p.add_run()
        run.text = txt
        run.font.size = Pt(size)
        run.font.bold = bld
        run.font.color.rgb = col
        run.font.name = "Calibri"
    return tb

def add_image_from_url(slide, url, x, y, w, h):
    try:
        result = json.loads(subprocess.check_output(
            ["python", "/tmp/skills/shared/scripts/fetch_images.py", url],
            timeout=20
        ))
        if result and result[0].get("base64"):
            raw = base64.b64decode(result[0]["base64"].split(",", 1)[1])
            slide.shapes.add_picture(BytesIO(raw), Inches(x), Inches(y), Inches(w), Inches(h))
            return True
    except Exception as e:
        print(f"Image fetch failed for {url}: {e}")
    return False

def add_divider(slide, y, color=TEAL, x=0.3, w=12.73):
    shape = slide.shapes.add_shape(1, Inches(x), Inches(y), Inches(w), Inches(0.04))
    shape.fill.solid()
    shape.fill.fore_color.rgb = color
    shape.line.fill.background()

def header_bar(slide, title, subtitle=None):
    """Top navy header bar with title"""
    add_rect(slide, 0, 0, 13.333, 1.1, NAVY)
    add_text(slide, title, 0.3, 0.05, 12, 0.7, size=32, bold=True, color=WHITE, align=PP_ALIGN.LEFT)
    if subtitle:
        add_text(slide, subtitle, 0.3, 0.72, 12, 0.38, size=14, bold=False, color=YELLOW, align=PP_ALIGN.LEFT)

def footer(slide, txt="ECG Basics | MBBS 3rd Year | Reference: Life in the Fast Lane (LITFL)"):
    add_rect(slide, 0, 7.15, 13.333, 0.35, NAVY)
    add_text(slide, txt, 0.3, 7.16, 12.5, 0.3, size=10, color=RGBColor(0xAA, 0xCC, 0xCC))

# ══════════════════════════════════════════════════════════════
# SLIDE 1 – Title / Cover
# ══════════════════════════════════════════════════════════════
slide = prs.slides.add_slide(blank)

# Full background
add_rect(slide, 0, 0, 13.333, 7.5, NAVY)

# ECG-line decoration (red zigzag feel via thin red strip)
add_rect(slide, 0, 3.2, 13.333, 0.08, RED)

# Title
add_text(slide, "ELECTROCARDIOGRAM (ECG)", 1.0, 0.8, 11.333, 1.0,
         size=40, bold=True, color=WHITE, align=PP_ALIGN.CENTER)
add_text(slide, "Basics & How to Read an ECG", 1.0, 1.7, 11.333, 0.8,
         size=28, bold=False, color=YELLOW, align=PP_ALIGN.CENTER)
add_divider(slide, 2.6, RED, 2.5, 8.333)
add_text(slide, "For MBBS 3rd Year Students", 1.0, 2.75, 11.333, 0.5,
         size=20, bold=False, color=LIGHT, align=PP_ALIGN.CENTER)
add_text(slide, "Reference: Life in the Fast Lane (LITFL) ECG Library", 1.0, 3.35, 11.333, 0.45,
         size=16, bold=False, color=RGBColor(0x90, 0xCA, 0xCA), align=PP_ALIGN.CENTER)

# Objectives box
add_rect(slide, 1.5, 4.1, 10.333, 2.8, RGBColor(0x12, 0x3A, 0x6A))
add_text(slide, "Learning Objectives", 1.6, 4.15, 10, 0.45, size=16, bold=True, color=YELLOW)
obj_lines = [
    "• Understand the basic principles of ECG",
    "• Identify the cardiac conduction system",
    "• Recognise PQRST waves & normal intervals",
    "• Apply a systematic 5-step ECG reading method",
    "• Identify common abnormal patterns",
]
add_multiline_text(slide, obj_lines, 1.6, 4.6, 10, 2.2, size=15, color=WHITE)
footer(slide)

# ══════════════════════════════════════════════════════════════
# SLIDE 2 – What is an ECG?
# ══════════════════════════════════════════════════════════════
slide = prs.slides.add_slide(blank)
add_rect(slide, 0, 0, 13.333, 7.5, LGRAY)
header_bar(slide, "What is an ECG?", "Recording the electrical activity of the heart from the body surface")

# Left column – definition
add_rect(slide, 0.3, 1.2, 6.0, 5.7, WHITE)
def_lines = [
    ("Definition", True, NAVY),
    ("An ECG (electrocardiogram) is a non-invasive test that records the electrical impulses generated by the heart as a series of waves on a calibrated paper.", False, DARK),
    ("", False, DARK),
    ("Why is it important?", True, NAVY),
    ("• Diagnoses arrhythmias, myocardial infarction, heart blocks", False, DARK),
    ("• Evaluates effects of drugs and electrolyte imbalances", False, DARK),
    ("• Monitors pacemaker function", False, DARK),
    ("• Screens for structural heart disease", False, DARK),
    ("", False, DARK),
    ("Standard ECG Paper", True, NAVY),
    ("• Small square = 1 mm = 0.04 sec (at 25 mm/s)", False, DARK),
    ("• Large square = 5 mm = 0.2 sec", False, DARK),
    ("• 1 mm vertical = 0.1 mV (standard gain 10 mm/mV)", False, DARK),
    ("• Paper speed: 25 mm/s (standard)  |  50 mm/s (fast)", False, DARK),
]
add_multiline_text(slide, def_lines, 0.35, 1.25, 5.85, 5.55, size=14, color=DARK)

# Right column – 12 leads overview
add_rect(slide, 6.6, 1.2, 6.4, 5.7, WHITE)
lead_lines = [
    ("The 12 Leads", True, NAVY),
    ("", False, DARK),
    ("Limb Leads (Frontal Plane)", True, TEAL),
    ("  I, II, III  — Bipolar (Einthoven's triangle)", False, DARK),
    ("  aVR, aVL, aVF — Augmented unipolar", False, DARK),
    ("", False, DARK),
    ("Precordial / Chest Leads (Horizontal Plane)", True, TEAL),
    ("  V1 — 4th ICS, right sternal border", False, DARK),
    ("  V2 — 4th ICS, left sternal border", False, DARK),
    ("  V3 — Between V2 and V4", False, DARK),
    ("  V4 — 5th ICS, mid-clavicular line", False, DARK),
    ("  V5 — Anterior axillary line", False, DARK),
    ("  V6 — Mid-axillary line", False, DARK),
    ("", False, DARK),
    ("Electrode colour coding (IEC)", True, TEAL),
    ("  RA = Red  |  LA = Yellow  |  RL = Black  |  LL = Green", False, DARK),
]
add_multiline_text(slide, lead_lines, 6.7, 1.25, 6.2, 5.55, size=13.5, color=DARK)
footer(slide)

# ══════════════════════════════════════════════════════════════
# SLIDE 3 – Cardiac Conduction System
# ══════════════════════════════════════════════════════════════
slide = prs.slides.add_slide(blank)
add_rect(slide, 0, 0, 13.333, 7.5, LGRAY)
header_bar(slide, "Cardiac Conduction System", "Understanding the electrical highway of the heart")

add_rect(slide, 0.3, 1.2, 8.2, 5.7, WHITE)
conduction = [
    ("Pathway of Impulse", True, NAVY),
    ("", False, DARK),
    ("1.  SA Node (Sinoatrial node)", True, TEAL),
    ("     • Located in right atrium, near SVC", False, DARK),
    ("     • Natural pacemaker: 60–100 bpm", False, DARK),
    ("     • Initiates the P wave (atrial depolarisation)", False, DARK),
    ("", False, DARK),
    ("2.  AV Node (Atrioventricular node)", True, TEAL),
    ("     • At base of right atrium / interatrial septum", False, DARK),
    ("     • Delays impulse ~0.1 sec → PR interval", False, DARK),
    ("     • Intrinsic rate: 40–60 bpm (if SA fails)", False, DARK),
    ("", False, DARK),
    ("3.  Bundle of His → Right & Left Bundle Branches", True, TEAL),
    ("     • Left bundle: anterior + posterior fascicles", False, DARK),
    ("", False, DARK),
    ("4.  Purkinje Fibres", True, TEAL),
    ("     • Rapid ventricular depolarisation → QRS complex", False, DARK),
    ("     • Intrinsic rate: 20–40 bpm", False, DARK),
]
add_multiline_text(slide, conduction, 0.35, 1.25, 7.9, 5.55, size=13.5)

add_rect(slide, 8.8, 1.2, 4.2, 5.7, RGBColor(0xE8, 0xF8, 0xF8))
mnemonic = [
    ("Memory Aid", True, NAVY),
    ("", False, DARK),
    ('"Some Atrial Bastards", "Have Bundles', True, RED),
    ("Purkinje"", True, RED),
    ("", False, DARK),
    ("SA → AV → Bundle of His", False, DARK),
    ("→ Bundle Branches", False, DARK),
    ("→ Purkinje fibres", False, DARK),
    ("", False, DARK),
    ("ECG correlation:", True, NAVY),
    ("P wave = Atrial depolar.", False, DARK),
    ("PR interval = AV delay", False, DARK),
    ("QRS = Ventricular depolar.", False, DARK),
    ("ST segment = Plateau phase", False, DARK),
    ("T wave = Ventricular repolar.", False, DARK),
]
add_multiline_text(slide, mnemonic, 8.9, 1.3, 4.0, 5.5, size=13.5)
footer(slide)

# ══════════════════════════════════════════════════════════════
# SLIDE 4 – The PQRST Waveform
# ══════════════════════════════════════════════════════════════
slide = prs.slides.add_slide(blank)
add_rect(slide, 0, 0, 13.333, 7.5, LGRAY)
header_bar(slide, "The PQRST Waveform", "Anatomy of a single cardiac cycle on ECG")

# Left: wave descriptions
add_rect(slide, 0.3, 1.2, 7.5, 5.7, WHITE)
wave_lines = [
    ("P Wave — Atrial Depolarisation", True, RED),
    ("  Duration: 60–120 ms  |  Amplitude: <2.5 mm in limb leads", False, DARK),
    ("  Upright in I, II, aVF; inverted in aVR", False, DARK),
    ("", False, DARK),
    ("PR Interval — AV Conduction Time", True, TEAL),
    ("  Normal: 120–200 ms (3–5 small squares)", False, DARK),
    ("  >200 ms → 1st degree AV block", False, DARK),
    ("  <120 ms → Pre-excitation (WPW)", False, DARK),
    ("", False, DARK),
    ("QRS Complex — Ventricular Depolarisation", True, RED),
    ("  Duration: 60–100 ms (<2.5 small squares)", False, DARK),
    ("  >120 ms → Bundle branch block / ventricular rhythm", False, DARK),
    ("  Q wave: <40 ms wide, <25% of R amplitude (pathological if larger)", False, DARK),
    ("", False, DARK),
    ("ST Segment — Plateau (Early Repolarisation)", True, TEAL),
    ("  Should be isoelectric (at baseline)", False, DARK),
    ("  Elevation >1 mm → STEMI  |  Depression → ischaemia", False, DARK),
    ("", False, DARK),
    ("T Wave — Ventricular Repolarisation", True, RED),
    ("  Upright in I, II, V3-V6; inverted in aVR (normal)", False, DARK),
    ("  Tall peaked T → Hyperkalaemia", False, DARK),
    ("", False, DARK),
    ("QT Interval — Total Ventricular Activity", True, TEAL),
    ("  QTc normal: <440 ms (men), <460 ms (women)", False, DARK),
    ("  Prolonged QTc → risk of Torsades de Pointes", False, DARK),
]
add_multiline_text(slide, wave_lines, 0.35, 1.25, 7.2, 5.55, size=12.5)

# Right: image placeholder + interval table
add_rect(slide, 8.0, 1.2, 5.0, 2.8, RGBColor(0xE8, 0xF8, 0xF8))
add_text(slide, "Normal ECG Tracing\n(12-lead sinus rhythm)", 8.05, 1.3, 4.9, 2.6,
         size=14, color=NAVY, align=PP_ALIGN.CENTER)

# Quick reference box
add_rect(slide, 8.0, 4.15, 5.0, 2.75, WHITE)
qr_lines = [
    ("Quick Reference — Normal Values", True, NAVY),
    ("Interval       Normal Range", True, DARK),
    ("──────────────────────────", False, RGBColor(0xAA, 0xAA, 0xAA)),
    ("PR interval    0.12 – 0.20 s", False, DARK),
    ("QRS duration   0.06 – 0.10 s", False, DARK),
    ("QT interval    0.35 – 0.44 s", False, DARK),
    ("QTc (men)      < 440 ms", False, DARK),
    ("QTc (women)    < 460 ms", False, DARK),
    ("P-wave dur.    0.06 – 0.12 s", False, DARK),
]
add_multiline_text(slide, qr_lines, 8.05, 4.2, 4.8, 2.6, size=13)
footer(slide)

# ══════════════════════════════════════════════════════════════
# SLIDE 5 – 12-Lead Electrode Placement (with real image)
# ══════════════════════════════════════════════════════════════
slide = prs.slides.add_slide(blank)
add_rect(slide, 0, 0, 13.333, 7.5, LGRAY)
header_bar(slide, "12-Lead ECG — Electrode Placement", "Correct placement is essential for accurate interpretation")

add_rect(slide, 0.3, 1.2, 5.5, 5.7, WHITE)
placement_lines = [
    ("Standard Lead Positions", True, NAVY),
    ("", False, DARK),
    ("Precordial Leads", True, TEAL),
    ("V1 — 4th ICS, right sternal border", False, DARK),
    ("V2 — 4th ICS, left sternal border", False, DARK),
    ("V3 — Between V2 and V4", False, DARK),
    ("V4 — 5th ICS, mid-clavicular line", False, DARK),
    ("V5 — Anterior axillary line (same level as V4)", False, DARK),
    ("V6 — Mid-axillary line (same level as V4)", False, DARK),
    ("", False, DARK),
    ("Limb Leads", True, TEAL),
    ("RA — Right arm (or right shoulder)", False, DARK),
    ("LA — Left arm (or left shoulder)", False, DARK),
    ("RL — Right leg (neutral/ground electrode)", False, DARK),
    ("LL — Left leg", False, DARK),
    ("", False, DARK),
    ("Common Errors to Avoid", True, RED),
    ("• V1/V2 placed too high (→ false anterior MI pattern)", False, DARK),
    ("• Limb lead reversal (→ inverted lead I in LA-RA swap)", False, DARK),
    ("• Poor skin contact → artefact", False, DARK),
]
add_multiline_text(slide, placement_lines, 0.35, 1.25, 5.3, 5.55, size=13)

# Image of lead placement
img_url = "https://cdn.orris.care/cdss_images/pmc_clinical_VQA_1e88b075f27ce3ba49cd487a109a06da14834c0aa3553e90f79f489d5eb82230.jpg"
added = add_image_from_url(slide, img_url, 6.1, 1.2, 6.9, 5.7)
if not added:
    add_rect(slide, 6.1, 1.2, 6.9, 5.7, RGBColor(0xDD, 0xEE, 0xEE))
    add_text(slide, "12-Lead ECG\nElectrode Placement\n(V1–V6 + Limb Leads)", 6.2, 2.5, 6.7, 2.5,
             size=20, color=NAVY, align=PP_ALIGN.CENTER)
footer(slide)

# ══════════════════════════════════════════════════════════════
# SLIDE 6 – Systematic Approach: 5 Steps (LITFL method)
# ══════════════════════════════════════════════════════════════
slide = prs.slides.add_slide(blank)
add_rect(slide, 0, 0, 13.333, 7.5, LGRAY)
header_bar(slide, "How to Read an ECG — Systematic 5-Step Approach",
           "Always use a systematic method — never skip steps | Reference: LITFL ECG Library")

steps = [
    ("1", "RATE", "300 / number of large squares between R-R\n• Normal: 60–100 bpm\n• >100 = Tachycardia | <60 = Bradycardia\n• Irregular rhythms: count R waves in 10s strip × 6", TEAL),
    ("2", "RHYTHM", "Is it Regular or Irregular?\n• Regular: measure R-R intervals (constant?)\n• Regularly irregular (repeating pattern)\n• Irregularly irregular (AF, multifocal PAC)\n• Is there a P wave before every QRS?", TEAL),
    ("3", "AXIS", "Normal axis: −30° to +90°\n• Lead I (+), aVF (+) → Normal axis\n• Lead I (+), aVF (−) → Left axis deviation\n• Lead I (−), aVF (+) → Right axis deviation\n• Lead I (−), aVF (−) → Extreme axis", NAVY),
    ("4", "WAVEFORMS", "Assess P, Q, R, S, T waves & intervals\n• P wave: morphology, size, presence\n• PR interval: 120–200 ms\n• QRS: width, morphology, axis\n• ST segment: elevation / depression\n• T wave: morphology, inversion", NAVY),
    ("5", "DIAGNOSIS", "Synthesise findings into a diagnosis\n• Describe rate, rhythm, axis\n• Note any abnormalities\n• Correlate with clinical context\n• State your primary ECG interpretation", RED),
]

x_positions = [0.25, 2.9, 5.55, 8.2, 10.85]
for i, (num, title, body, col) in enumerate(steps):
    x = x_positions[i]
    # Number circle
    add_rect(slide, x, 1.15, 2.4, 0.55, col)
    add_text(slide, f"STEP {num}  {title}", x + 0.05, 1.18, 2.3, 0.5,
             size=13, bold=True, color=WHITE, align=PP_ALIGN.CENTER)
    # Body box
    add_rect(slide, x, 1.75, 2.4, 5.35, WHITE)
    add_multiline_text(slide, body.split("\n"), x + 0.07, 1.8, 2.28, 5.2,
                       size=12.5, color=DARK)

footer(slide)

# ══════════════════════════════════════════════════════════════
# SLIDE 7 – Calculating Heart Rate
# ══════════════════════════════════════════════════════════════
slide = prs.slides.add_slide(blank)
add_rect(slide, 0, 0, 13.333, 7.5, LGRAY)
header_bar(slide, "Step 1 — Calculating Heart Rate", "Two methods: Regular vs Irregular rhythms")

# Regular rhythm box
add_rect(slide, 0.3, 1.2, 6.0, 5.7, WHITE)
rate_reg = [
    ("Regular Rhythms — Rule of 300", True, NAVY),
    ("", False, DARK),
    ("Method:", True, TEAL),
    ("  300 ÷ number of large squares between two R peaks", False, DARK),
    ("", False, DARK),
    ("Quick Memorisation Table:", True, TEAL),
    ("  1 large sq  = 300 bpm", False, DARK),
    ("  2 large sq  = 150 bpm", False, DARK),
    ("  3 large sq  = 100 bpm  (upper normal limit)", False, DARK),
    ("  4 large sq  =  75 bpm  (normal)", False, DARK),
    ("  5 large sq  =  60 bpm  (lower normal limit)", False, DARK),
    ("  6 large sq  =  50 bpm  (bradycardia)", False, DARK),
    ("  7 large sq  =  43 bpm", False, DARK),
    ("  8 large sq  =  38 bpm", False, DARK),
    ("  10 large sq =  30 bpm", False, DARK),
    ("", False, DARK),
    ('Mnemonic: "300 – 150 – 100 – 75 – 60 – 50"', True, RED),
]
add_multiline_text(slide, rate_reg, 0.35, 1.25, 5.8, 5.55, size=13.5)

# Irregular rhythm box
add_rect(slide, 6.6, 1.2, 6.4, 5.7, WHITE)
rate_irr = [
    ("Irregular Rhythms", True, NAVY),
    ("", False, DARK),
    ("Method (6-second strip):", True, TEAL),
    ("  1. Count all R waves in a 10-second rhythm strip", False, DARK),
    ("  2. Multiply by 6  = beats per minute", False, DARK),
    ("", False, DARK),
    ("Alternative: 6-second method", True, TEAL),
    ("  Count R waves in 30 large boxes (= 6 sec)", False, DARK),
    ("  Multiply by 10  = bpm", False, DARK),
    ("", False, DARK),
    ("Rate Interpretation", True, NAVY),
    ("  Tachycardia   > 100 bpm", True, RED),
    ("  Normal           60 – 100 bpm", True, GREEN),
    ("  Bradycardia   < 60 bpm", True, ORANGE),
    ("", False, DARK),
    ("Important:", True, NAVY),
    ("  ECG runs at 25 mm/sec (standard)", False, DARK),
    ("  Rhythm strip = 10 seconds long", False, DARK),
    ("  Confirm calibration signal (10 mm = 1 mV)", False, DARK),
]
add_multiline_text(slide, rate_irr, 6.65, 1.25, 6.2, 5.55, size=13.5)
footer(slide)

# ══════════════════════════════════════════════════════════════
# SLIDE 8 – Cardiac Axis
# ══════════════════════════════════════════════════════════════
slide = prs.slides.add_slide(blank)
add_rect(slide, 0, 0, 13.333, 7.5, LGRAY)
header_bar(slide, "Step 3 — Cardiac Axis", "Direction of the mean electrical vector of ventricular depolarisation")

add_rect(slide, 0.3, 1.2, 6.0, 5.7, WHITE)
axis_lines = [
    ("What is the Cardiac Axis?", True, NAVY),
    ("The net direction of ventricular depolarisation in the frontal plane, expressed as degrees.", False, DARK),
    ("", False, DARK),
    ("Normal Axis: −30° to +90°", True, GREEN),
    ("", False, DARK),
    ("Quick Method — Use leads I and aVF", True, TEAL),
    ("", False, DARK),
    ("  Lead I (+), aVF (+)  → Normal axis", True, GREEN),
    ("  Lead I (+), aVF (−)  → Left Axis Deviation (LAD)", True, ORANGE),
    ("     Causes: LBBB, left ant. fascicular block,", False, DARK),
    ("     inferior MI, left ventricular hypertrophy", False, DARK),
    ("  Lead I (−), aVF (+)  → Right Axis Deviation (RAD)", True, RED),
    ("     Causes: RBBB, right vent. hypertrophy,", False, DARK),
    ("     left post. fascicular block, lateral MI", False, DARK),
    ("  Lead I (−), aVF (−)  → Extreme Axis (no-man's land)", True, RED),
    ("     Suggests ventricular tachycardia", False, DARK),
    ("", False, DARK),
    ("Precise axis: find the lead with smallest (most", False, DARK),
    ("isoelectric) QRS → axis is perpendicular to it", False, DARK),
]
add_multiline_text(slide, axis_lines, 0.35, 1.25, 5.8, 5.55, size=13)

add_rect(slide, 6.6, 1.2, 6.4, 5.7, RGBColor(0xE8, 0xF8, 0xF8))
axis_causes = [
    ("Causes — Left Axis Deviation", True, NAVY),
    ("• Left anterior fascicular block (LAFB) — most common", False, DARK),
    ("• Left bundle branch block (LBBB)", False, DARK),
    ("• Inferior wall MI", False, DARK),
    ("• Left ventricular hypertrophy (LVH)", False, DARK),
    ("• Ostium primum ASD, tricuspid atresia", False, DARK),
    ("• Wolff-Parkinson-White syndrome", False, DARK),
    ("• Pre-excitation", False, DARK),
    ("", False, DARK),
    ("Causes — Right Axis Deviation", True, NAVY),
    ("• Right bundle branch block (RBBB)", False, DARK),
    ("• Right ventricular hypertrophy (RVH)", False, DARK),
    ("• Left posterior fascicular block (LPFB)", False, DARK),
    ("• Lateral wall MI", False, DARK),
    ("• Chronic lung disease / cor pulmonale", False, DARK),
    ("• Pulmonary embolism (acute)", False, DARK),
    ("• Normal variant in tall thin individuals", False, DARK),
    ("• Wolff-Parkinson-White syndrome", False, DARK),
]
add_multiline_text(slide, axis_causes, 6.65, 1.25, 6.2, 5.55, size=13)
footer(slide)

# ══════════════════════════════════════════════════════════════
# SLIDE 9 – Normal ECG (image + features)
# ══════════════════════════════════════════════════════════════
slide = prs.slides.add_slide(blank)
add_rect(slide, 0, 0, 13.333, 7.5, LGRAY)
header_bar(slide, "Features of a Normal ECG", "Sinus rhythm — the template for all comparisons")

# Normal ECG image
img_url2 = "https://cdn.orris.care/cdss_images/pmc_clinical_VQA_18a11426f5021be529fd7d4fc63f580fdece7ad83d04171fdbbb45b7b4d62496.jpg"
added2 = add_image_from_url(slide, img_url2, 0.3, 1.2, 7.5, 4.0)
if not added2:
    add_rect(slide, 0.3, 1.2, 7.5, 4.0, RGBColor(0xDD, 0xEE, 0xEE))
    add_text(slide, "Normal 12-Lead ECG\n(Sinus Rhythm, HR ~75 bpm)", 0.35, 2.4, 7.4, 1.6,
             size=18, color=NAVY, align=PP_ALIGN.CENTER)

# Normal features checklist
add_rect(slide, 8.0, 1.2, 5.0, 4.0, WHITE)
norm_lines = [
    ("Normal Sinus Rhythm Criteria", True, NAVY),
    ("", False, DARK),
    ("✓ Rate 60–100 bpm", False, GREEN),
    ("✓ Regular R-R intervals", False, GREEN),
    ("✓ P wave before every QRS", False, GREEN),
    ("✓ Upright P in leads I, II, aVF", False, GREEN),
    ("✓ PR interval 0.12–0.20 sec", False, GREEN),
    ("✓ QRS < 0.12 sec (narrow)", False, GREEN),
    ("✓ Normal axis (−30° to +90°)", False, GREEN),
    ("✓ No ST deviation", False, GREEN),
    ("✓ T wave concordant with QRS", False, GREEN),
    ("✓ QTc within normal range", False, GREEN),
]
add_multiline_text(slide, norm_lines, 8.05, 1.25, 4.85, 3.9, size=14)

# Bottom strip
add_rect(slide, 0.3, 5.3, 12.7, 1.9, WHITE)
bottom_lines = [
    ("Leads to Know & Their Views", True, NAVY),
    ("Inferior wall: II, III, aVF  |  Lateral wall: I, aVL, V5, V6  |  Anterior wall: V1–V4  |  Septal: V1–V2  |  High lateral: I, aVL", False, DARK),
    ("Right ventricle: aVR, V1  |  Posterior wall: V7–V9 (or reciprocal in V1–V3)", False, DARK),
]
add_multiline_text(slide, bottom_lines, 0.35, 5.35, 12.5, 1.8, size=13.5)
footer(slide)

# ══════════════════════════════════════════════════════════════
# SLIDE 10 – Common Abnormalities: ST Changes & Ischaemia
# ══════════════════════════════════════════════════════════════
slide = prs.slides.add_slide(blank)
add_rect(slide, 0, 0, 13.333, 7.5, LGRAY)
header_bar(slide, "Common Abnormality 1 — Myocardial Ischaemia & Infarction",
           "LITFL Lecture 2: Myocardial ischaemia and infarction")

add_rect(slide, 0.3, 1.2, 6.0, 5.7, WHITE)
mi_lines = [
    ("ECG Changes in ACS", True, NAVY),
    ("", False, DARK),
    ("STEMI (ST-Elevation MI)", True, RED),
    ("• ST elevation ≥1 mm in ≥2 contiguous limb leads", False, DARK),
    ("• ST elevation ≥2 mm in ≥2 contiguous precordial leads", False, DARK),
    ("• New LBBB with ischaemic symptoms = STEMI equivalent", False, DARK),
    ("• Hyperacute T waves (very early)", False, DARK),
    ("• Subsequent Q wave formation (hours–days)", False, DARK),
    ("", False, DARK),
    ("NSTEMI / Unstable Angina", True, ORANGE),
    ("• ST depression ≥0.5 mm", False, DARK),
    ("• T-wave inversion in ischaemic leads", False, DARK),
    ("• Dynamic changes on serial ECG", False, DARK),
    ("", False, DARK),
    ("Localising the Infarct", True, TEAL),
    ("• Inferior (II, III, aVF)  → RCA territory", False, DARK),
    ("• Anterior (V1–V4)        → LAD territory", False, DARK),
    ("• Lateral (I, aVL, V5–V6) → LCx territory", False, DARK),
    ("• Posterior (tall R in V1) → PDA / RCA", False, DARK),
    ("• Right ventricle (V4R)    → Proximal RCA", False, DARK),
]
add_multiline_text(slide, mi_lines, 0.35, 1.25, 5.8, 5.55, size=13)

# Image: STEMI ECG
img_url3 = "https://cdn.orris.care/cdss_images/pmc_clinical_VQA_c8af7235147e5e8edc6e4e669c141a282c9d25ee85c10bb09a0316014979a678.jpg"
added3 = add_image_from_url(slide, img_url3, 6.5, 1.2, 6.5, 5.7)
if not added3:
    add_rect(slide, 6.5, 1.2, 6.5, 5.7, RGBColor(0xFF, 0xEE, 0xEE))
    add_text(slide, "ECG: Inferior STEMI\nwith 3rd Degree AV Block\n(ST elevation in II, III, aVF)", 6.6, 3.0, 6.3, 2.5,
             size=16, color=RED, align=PP_ALIGN.CENTER)
footer(slide)

# ══════════════════════════════════════════════════════════════
# SLIDE 11 – Arrhythmias
# ══════════════════════════════════════════════════════════════
slide = prs.slides.add_slide(blank)
add_rect(slide, 0, 0, 13.333, 7.5, LGRAY)
header_bar(slide, "Common Abnormality 2 — Arrhythmias",
           "LITFL Lectures 3 & 4: Conduction disease and Tachyarrhythmias")

add_rect(slide, 0.3, 1.2, 6.5, 5.7, WHITE)
arrhythmia_lines = [
    ("Bradyarrhythmias", True, NAVY),
    ("1st degree AV block", True, TEAL),
    ("  PR interval >200 ms; all P waves conduct", False, DARK),
    ("2nd degree — Mobitz I (Wenckebach)", True, TEAL),
    ("  Progressive PR lengthening → dropped QRS", False, DARK),
    ("2nd degree — Mobitz II (Hay)", True, TEAL),
    ("  Fixed PR; sudden non-conducted P waves", False, DARK),
    ("3rd degree (Complete Heart Block)", True, TEAL),
    ("  P & QRS completely dissociated", False, DARK),
    ("", False, DARK),
    ("Bundle Branch Blocks", True, NAVY),
    ("RBBB  —  rSR' in V1, slurred S in V5/V6", False, DARK),
    ("LBBB  —  broad notched R in V5/V6, QS in V1", False, DARK),
    ("         (LBBB: 'WiLLiaM  MaRRoW')", False, RGBColor(0x77, 0x00, 0x88)),
    ("", False, DARK),
    ("Tachyarrhythmias", True, NAVY),
    ("• Sinus tachycardia: >100 bpm, P before QRS", False, DARK),
    ("• Atrial fibrillation: irregularly irregular,", False, DARK),
    ("  no P waves, fibrillatory baseline", False, DARK),
    ("• Atrial flutter: saw-tooth pattern ~300/min,", False, DARK),
    ("  ventricular rate usually 150 (2:1 block)", False, DARK),
    ("• SVT (AVNRT): narrow complex, P buried in QRS", False, DARK),
    ("• VT: wide complex, regular, >100 bpm", False, DARK),
    ("• VF: chaotic — no identifiable waveforms", False, DARK),
]
add_multiline_text(slide, arrhythmia_lines, 0.35, 1.25, 6.3, 5.55, size=12.5)

# Right: two images
img_url4 = "https://cdn.orris.care/cdss_images/pmc_clinical_VQA_9e5af513f5fd1d1f2ae0a8739c308ee26ed76f01f452abadda0157b284cb5ad8.jpg"
added4 = add_image_from_url(slide, img_url4, 7.0, 1.2, 6.0, 2.75)
if not added4:
    add_rect(slide, 7.0, 1.2, 6.0, 2.75, RGBColor(0xEE, 0xF0, 0xFF))
    add_text(slide, "ECG: Atrial Fibrillation\n(Irregularly irregular, no P waves)", 7.1, 2.0, 5.8, 1.5,
             size=14, color=NAVY, align=PP_ALIGN.CENTER)

img_url5 = "https://cdn.orris.care/cdss_images/pmc_clinical_VQA_892df04a938a653bcea1c9217d0059dc05064e296a56c0595d77e1fcc425d881.jpg"
added5 = add_image_from_url(slide, img_url5, 7.0, 4.1, 6.0, 2.8)
if not added5:
    add_rect(slide, 7.0, 4.1, 6.0, 2.8, RGBColor(0xFF, 0xF0, 0xEE))
    add_text(slide, "ECG: AF with RBBB\n(Wide QRS + irregular rhythm)", 7.1, 5.0, 5.8, 1.5,
             size=14, color=RED, align=PP_ALIGN.CENTER)
footer(slide)

# ══════════════════════════════════════════════════════════════
# SLIDE 12 – Other Important Conditions
# ══════════════════════════════════════════════════════════════
slide = prs.slides.add_slide(blank)
add_rect(slide, 0, 0, 13.333, 7.5, LGRAY)
header_bar(slide, "Common Abnormality 3 — Other Key Conditions",
           "LITFL Lecture 5: Other cardiac conditions")

boxes = [
    ("Hyperkalaemia", [
        "• Peaked / tented T waves (early)",
        "• Widened QRS",
        "• Flattened / absent P waves",
        "• Sine wave pattern (severe)",
        "• Can mimic STEMI or LBBB",
    ], 0.3, 1.2, 3.8, 5.7, TEAL),
    ("Hypokalaemia", [
        "• Flattened / inverted T waves",
        "• Prominent U waves (after T)",
        "• Prolonged QU interval",
        "• Apparent QT prolongation",
        "• ST depression possible",
    ], 4.3, 1.2, 3.8, 5.7, TEAL),
    ("Pericarditis", [
        "• Saddle-shaped ST elevation",
        "  (widespread, all leads)",
        "• PR segment depression",
        "  (especially II, V5, V6)",
        "• No reciprocal ST depression",
        "• Sinus tachycardia common",
    ], 8.3, 1.2, 3.8, 5.7, NAVY),
    ("Pulmonary Embolism", [
        "• Sinus tachycardia (most common)",
        "• S1Q3T3 pattern (classic)",
        "• Right heart strain: RAD,",
        "  RBBB, RVH pattern",
        "• T-wave inversions V1–V4",
        "• P pulmonale",
    ], 0.3, 4.5, 3.8, 2.6, RED),  # will be overridden
]

# 4-quadrant layout
quadrant_data = [
    ("Hyperkalaemia", ["• Peaked / tented T waves (early)", "• Widened QRS", "• Flattened / absent P waves", "• Sine wave pattern (severe)", "• Can mimic STEMI or LBBB", "• Treat as emergency — K > 6.5"], TEAL, 0.3, 1.2, 6.2, 2.7),
    ("Hypokalaemia", ["• Flattened / inverted T waves", "• Prominent U waves (after T wave)", "• Apparent QT prolongation", "• ST depression possible", "• Risk of VT / Torsades"], TEAL, 6.8, 1.2, 6.2, 2.7),
    ("Pericarditis", ["• Widespread saddle-shaped ST elevation", "• PR segment depression (key feature)", "• No reciprocal ST depression (unlike MI)", "• Sinus tachycardia common", "• Pleuritic chest pain + friction rub"], NAVY, 0.3, 4.05, 6.2, 2.8),
    ("Pulmonary Embolism", ["• Sinus tachycardia (most common finding)", "• S1 Q3 T3 pattern (classic but rare)", "• Right heart strain: RAD, RBBB", "• T-wave inversions V1–V4", "• P pulmonale / peaked P waves"], RED, 6.8, 4.05, 6.2, 2.8),
]

for title, pts, col, x, y, w, h in quadrant_data:
    add_rect(slide, x, y, w, h, WHITE)
    add_rect(slide, x, y, w, 0.45, col)
    add_text(slide, title, x + 0.1, y + 0.04, w - 0.2, 0.4,
             size=14, bold=True, color=WHITE, align=PP_ALIGN.LEFT)
    add_multiline_text(slide, pts, x + 0.1, y + 0.5, w - 0.2, h - 0.6, size=13, color=DARK)
footer(slide)

# ══════════════════════════════════════════════════════════════
# SLIDE 13 – Worked Example / ECG Practice
# ══════════════════════════════════════════════════════════════
slide = prs.slides.add_slide(blank)
add_rect(slide, 0, 0, 13.333, 7.5, LGRAY)
header_bar(slide, "Worked Example — Applying the 5-Step Method",
           "Practice with a real ECG trace using the LITFL systematic approach")

# ECG image
img_url6 = "https://cdn.orris.care/cdss_images/pmc_clinical_VQA_886a8a151363dc38eefeb6d45ad858582ef334bd27a1cde94d7b55142c6fb1e6.jpg"
added6 = add_image_from_url(slide, img_url6, 0.3, 1.2, 7.5, 4.0)
if not added6:
    add_rect(slide, 0.3, 1.2, 7.5, 4.0, RGBColor(0xDD, 0xEE, 0xEE))
    add_text(slide, "12-Lead ECG\n(Normal Sinus Rhythm)", 0.35, 2.4, 7.4, 1.6, size=18, color=NAVY, align=PP_ALIGN.CENTER)

# Steps analysis
add_rect(slide, 8.0, 1.2, 5.0, 4.0, WHITE)
analysis = [
    ("ECG Analysis", True, NAVY),
    ("", False, DARK),
    ("Step 1 — RATE", True, TEAL),
    ("  ~82 bpm (4 large squares) → Normal", False, GREEN),
    ("Step 2 — RHYTHM", True, TEAL),
    ("  Regular, P before every QRS → Sinus", False, GREEN),
    ("Step 3 — AXIS", True, TEAL),
    ("  Lead I (+), aVF (+) → Normal axis", False, GREEN),
    ("Step 4 — WAVEFORMS", True, TEAL),
    ("  P wave normal  |  PR 0.16 s  |  QRS narrow", False, GREEN),
    ("  No ST changes  |  T wave upright", False, GREEN),
    ("Step 5 — DIAGNOSIS", True, TEAL),
    ("  Normal Sinus Rhythm", True, GREEN),
]
add_multiline_text(slide, analysis, 8.05, 1.25, 4.85, 3.9, size=13)

# Bottom practice tips
add_rect(slide, 0.3, 5.3, 12.7, 2.0, WHITE)
tips = [
    ("ECG Reading Tips for Exams & Clinical Practice", True, NAVY),
    ("1. Always use a systematic approach — never start with the diagnosis", False, DARK),
    ("2. Compare with previous ECGs when available  |  3. Correlate with clinical findings", False, DARK),
    ("4. In exams: describe rate → rhythm → axis → each wave/interval → interpretation", False, DARK),
]
add_multiline_text(slide, tips, 0.35, 5.35, 12.5, 1.85, size=13)
footer(slide)

# ══════════════════════════════════════════════════════════════
# SLIDE 14 – Summary & References
# ══════════════════════════════════════════════════════════════
slide = prs.slides.add_slide(blank)
add_rect(slide, 0, 0, 13.333, 7.5, NAVY)

add_text(slide, "Summary", 0.5, 0.2, 12.333, 0.7, size=34, bold=True, color=WHITE, align=PP_ALIGN.LEFT)
add_divider(slide, 0.95, TEAL)

add_rect(slide, 0.3, 1.1, 8.0, 4.5, RGBColor(0x12, 0x3A, 0x6A))
summary_lines = [
    ("Key Takeaways", True, YELLOW),
    ("", False, WHITE),
    ("✓ ECG records the heart's electrical activity — 12 leads", False, WHITE),
    ("✓ Understand the conduction pathway: SA → AV → Bundle → Purkinje", False, WHITE),
    ("✓ Know normal PQRST values and their physiological basis", False, WHITE),
    ("✓ Use the LITFL 5-step method: Rate → Rhythm → Axis → Waveforms → Diagnosis", False, WHITE),
    ("✓ Normal sinus rhythm: 60–100 bpm, regular, P before QRS, narrow QRS", False, WHITE),
    ("✓ STEMI: ST elevation in contiguous leads + clinical symptoms = emergency", False, WHITE),
    ("✓ AF: irregularly irregular, absent P waves, fibrillatory baseline", False, WHITE),
    ("✓ LBBB: WiLLiaM  |  RBBB: MaRRoW (V1 morphology)", False, WHITE),
    ("✓ Hyperkalaemia: peaked T waves → wide QRS → sine wave", False, WHITE),
]
add_multiline_text(slide, summary_lines, 0.35, 1.15, 7.8, 4.35, size=14, color=WHITE)

add_rect(slide, 8.6, 1.1, 4.4, 4.5, RGBColor(0x12, 0x3A, 0x6A))
ref_lines = [
    ("References & Resources", True, YELLOW),
    ("", False, WHITE),
    ("Primary Reference:", True, RGBColor(0xAA, 0xCC, 0xFF)),
    ("Life in the Fast Lane (LITFL)", False, WHITE),
    ("litfl.com/ecg-library", False, WHITE),
    ("", False, WHITE),
    ("LITFL ECG Lecture Series:", True, RGBColor(0xAA, 0xCC, 0xFF)),
    ("1. The Basics", False, WHITE),
    ("2. Ischaemia & Infarction", False, WHITE),
    ("3. Conduction Disease", False, WHITE),
    ("4. Tachyarrhythmias", False, WHITE),
    ("5. Other Cardiac Conditions", False, WHITE),
    ("", False, WHITE),
    ("Additional:", True, RGBColor(0xAA, 0xCC, 0xFF)),
    ("• Hampton's The ECG Made Easy", False, WHITE),
    ("• Dubin's Rapid Interpretation", False, WHITE),
]
add_multiline_text(slide, ref_lines, 8.65, 1.15, 4.2, 4.35, size=13, color=WHITE)

add_text(slide, "Thank You — Questions Welcome!", 0.5, 5.7, 12.333, 0.6,
         size=24, bold=True, color=YELLOW, align=PP_ALIGN.CENTER)
add_text(slide, "ECG Basics & Interpretation  |  MBBS 3rd Year  |  Reference: LITFL ECG Library (litfl.com)", 0.5, 6.35, 12.333, 0.45,
         size=13, color=RGBColor(0xAA, 0xCC, 0xCC), align=PP_ALIGN.CENTER)

# ── Save ─────────────────────────────────────────────────────
out_path = "/tmp/workspace/ecg-ppt/ECG_Basics_MBBS3rdYear.pptx"
prs.save(out_path)
print(f"Saved: {out_path}")
print(f"Slides: {len(prs.slides)}")
cd /tmp/workspace/ecg-ppt && python build_ecg_ppt.py 2>&1
~/ecg-ppt/build_ecg_ppt.py
Successfully replaced 1 instance(s) of the string in '/tmp/workspace/ecg-ppt/build_ecg_ppt.py'
cd /tmp/workspace/ecg-ppt && python build_ecg_ppt.py 2>&1
requests directly, which is pre-installed.~/ecg-ppt/build_ecg_ppt.py
Successfully replaced 1 instance(s) of the string in '/tmp/workspace/ecg-ppt/build_ecg_ppt.py'
cd /tmp/workspace/ecg-ppt && python build_ecg_ppt.py 2>&1
ls -lh /tmp/workspace/ecg-ppt/ECG_Basics_MBBS3rdYear.pptx && python3 -c " from pptx import Presentation prs = Presentation('/tmp/workspace/ecg-ppt/ECG_Basics_MBBS3rdYear.pptx') print(f'Total slides: {len(prs.slides)}') for i, slide in enumerate(prs.slides, 1): title = '' for shape in slide.shapes: if shape.has_text_frame: t = shape.text_frame.text.strip() if len(t) > 5 and len(t) < 80: title = t[:70] break print(f' Slide {i:2d}: {title}') "
ECG Basics MBBS3rdYear
Presentation · PPTX
What's in the presentation (14 slides)
| # | Slide | Content |
|---|---|---|
| 1 | Cover / Title | Learning objectives, course details |
| 2 | What is an ECG? | Definition, paper grid calibration, 12-lead overview, colour coding |
| 3 | Cardiac Conduction System | SA node → AV node → Bundle of His → Purkinje fibres, ECG correlates, mnemonic |
| 4 | PQRST Waveform | Each wave explained with normal values quick-reference table |
| 5 | 12-Lead Electrode Placement | Precordial (V1–V6) & limb lead positions, common placement errors |
| 6 | 5-Step Systematic Reading Method | Rate → Rhythm → Axis → Waveforms → Diagnosis (LITFL method) |
| 7 | Step 1: Heart Rate | Rule of 300, rate table, 6-second strip method for irregular rhythms |
| 8 | Step 3: Cardiac Axis | Leads I & aVF method, causes of LAD and RAD |
| 9 | Normal ECG Features | Normal sinus rhythm criteria, anatomical lead territories |
| 10 | Ischaemia & Infarction | STEMI vs NSTEMI, localising the infarct by territory, real ECG image |
| 11 | Arrhythmias | AV blocks, BBB, AF, atrial flutter, SVT, VT — with real ECG images |
| 12 | Other Conditions | Hyperkalaemia, Hypokalaemia, Pericarditis, Pulmonary Embolism |
| 13 | Worked Example | Step-by-step analysis of a real 12-lead ECG |
| 14 | Summary & References | Key takeaways + LITFL 5-lecture series references |
With reference from LITFL prepare ppt how to diagnose sinus rhythm & add in above ppt
https://litfl.com/ecg-rhythm-evaluation/
sinus rhythm ECG normal P wave before QRS regular rhythm
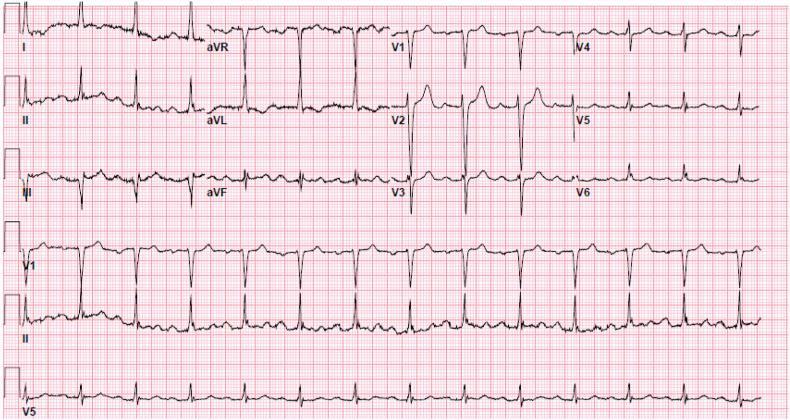
This diagnostic image is a 12-lead electrocardiogram (ECG) printed on standard pink grid paper, presenting a 10-second rhythm strip at the bottom for leads V1, II, and V5. The ECG demonstrates a regular sinus rhythm characterized by the presence of a P wave before every QRS complex, with P waves upright in leads I, II, and aVF. The primary diagnostic finding is a first-degree atrioventricular (AV) block, indicated by a consistently prolonged PR interval exceeding 200 milliseconds (5 small squares) throughout all leads. The QRS complexes are narrow and appear to have normal morphology and axis. No acute ST-segment elevations or depressions are visible, and T waves are generally upright and concordant with the QRS complexes, though baseline noise is present in some leads. This tracing is a classic educational example used to illustrate delayed conduction through the AV node while maintaining a 1:1 relationship between atrial and ventricular depolarization.
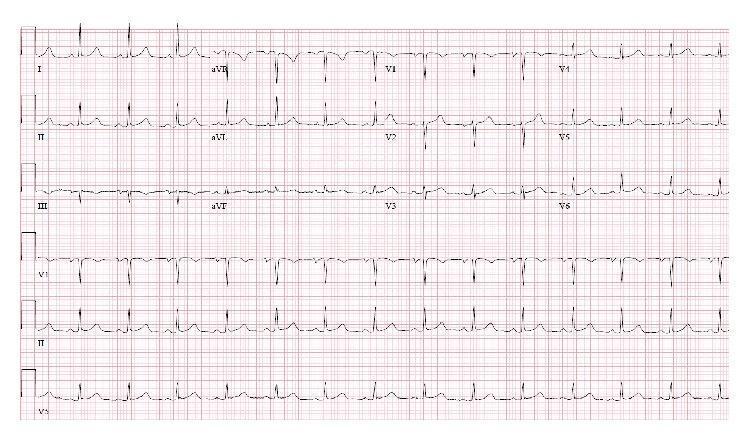
This diagnostic image is a standard 12-lead electrocardiogram (ECG) displayed on a red grid background. The tracing demonstrates a regular sinus rhythm at an approximate heart rate of 80–90 beats per minute. The rhythm exhibits normal P-wave morphology followed by a 1:1 atrioventricular conduction. The QRS complexes are narrow (duration < 120 ms) with normal axis and morphology across both limb (I, II, III, aVR, aVL, aVF) and precordial (V1–V6) leads. R-wave progression in the precordial leads appears normal. T waves are generally upright and concordant with the QRS complexes in most leads, with no evidence of acute ST-segment changes, pathological Q waves, or significant conduction delays. The tracing serves as a clinical illustration of resolved sinus bradycardia and restored normal sinus rhythm post-thyroidectomy for a massive multinodular goiter, demonstrating the absence of extrinsic mass effect on carotid sinus or autonomic structures.
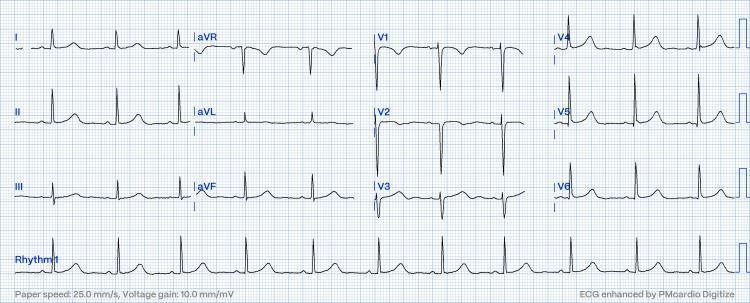
A standard 12-lead electrocardiogram (ECG) displayed on a grid with a paper speed of 25.0 mm/s and a voltage gain of 10.0 mm/mV. The tracing demonstrates a regular sinus rhythm with a physiologic heart rate. Distinct P waves are visible before every QRS complex, indicating a 1:1 atrioventricular conduction with a normal PR interval. The limb leads (I, II, III, aVR, aVL, aVF) show upright P and T waves in leads I and II, with a predominantly positive QRS in lead II consistent with a normal cardiac axis. The precordial leads (V1-V6) exhibit characteristic R-wave progression, transitioning from a small R-wave and deep S-wave in V1-V2 to a tall R-wave and minimal S-wave in V5-V6. No acute ST-segment elevations or T-wave inversions are present, signifying a resolution of previous conduction disturbances such as pseudo-Mobitz type II AV block. This diagnostic image serves as an educational example of a normal resting 12-lead ECG post-clinical intervention.
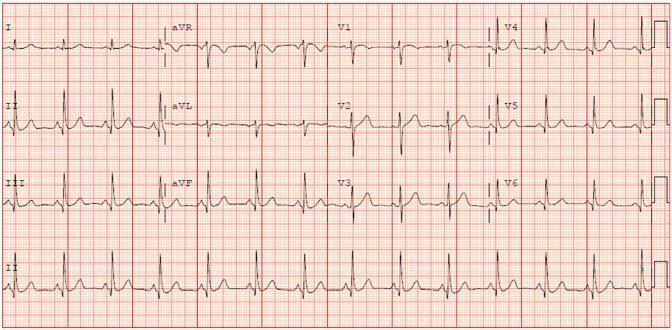
A standard 12-lead electrocardiogram (ECG) displayed on a red grid background with a rhythm strip (Lead II) at the bottom. The tracing demonstrates a normal sinus rhythm characterized by regular P waves preceding every QRS complex. The QRS complexes are narrow and uniform in morphology. Key findings include a slightly shortened PR interval and minimal, non-specific ST-segment depression localized in the inferior leads (II, III, and aVF). The T-waves remain generally upright across the precordial and limb leads, without evidence of significant inversion or hyperacute changes. The R-wave progression in the precordial leads (V1-V6) is normal. This diagnostic image is representative of basic cardiac electrophysiology monitoring, often used to assess for ischemia, conduction delays, or baseline rhythm disturbances in a clinical setting.
https://litfl.com/sinus-rhythm/
sinus bradycardia ECG slow heart rate P wave QRS
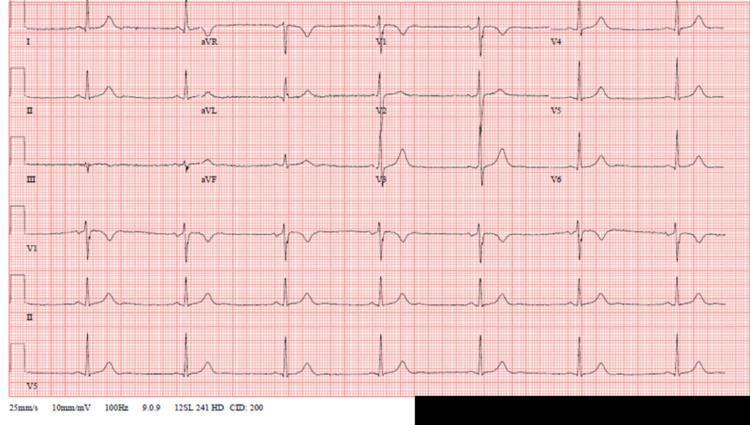
A standard 12-lead electrocardiogram (ECG) displayed on a red grid background with calibration set at 25 mm/s and 10 mm/mV. The tracing demonstrates a regular rhythm characterized by a slow heart rate (approximately 40-45 beats per minute), consistent with sinus bradycardia. Each QRS complex is preceded by a normal P wave with a constant PR interval (approximately 160-200 ms), indicating 1:1 atrioventricular conduction without evidence of AV blocks. The QRS complexes are narrow (under 120 ms) with normal morphology and a normal axis. ST segments are isoelectric throughout all leads (I, II, III, aVR, aVL, aVF, and V1-V6), and T waves appear normal in amplitude and direction without evidence of acute ischemia or electrolyte imbalances. This diagnostic image is used in cardiology and internal medicine to illustrate sinus bradycardia in a clinical setting.
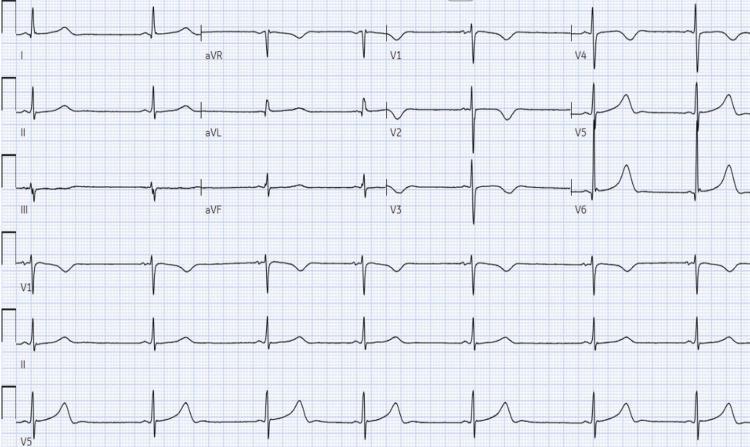
A 12-lead electrocardiogram (ECG) demonstrating marked sinus bradycardia and significant QT interval prolongation. The heart rate is notably slow, estimated between 30-35 beats per minute based on the wide spacing between QRS complexes. Each QRS complex is preceded by a P wave with a consistent PR interval, confirming a sinus rhythm. The QRS complexes exhibit normal morphology and narrow width, indicating preserved ventricular conduction. The most prominent diagnostic feature is the prolonged QT interval, which is visible across all leads, particularly in the precordial leads V4-V6. The T waves are generally upright and broad. There is no evidence of ST-segment elevation, depression, or pathological Q waves. In the context of the patient's history of Streptococcus pneumoniae meningitis and suspected intracranial hypertension, these findings may represent cardiac manifestations of neurological injury. This tracing serves as an educational example of how systemic or neurological conditions can influence cardiac repolarization and autonomic rate control.
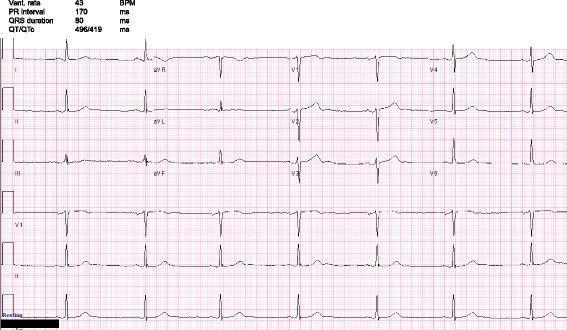
A 12-lead electrocardiogram (ECG) printed on standard grid paper demonstrating a primary finding of sinus bradycardia. The tracing displays leads I, II, III, aVR, aVL, aVF, and V1-V6, along with a continuous rhythm strip of lead II at the bottom. The ventricular rate is notably slow at approximately 43 beats per minute (BPM). Each QRS complex is preceded by a normal P wave with a consistent PR interval of 170 ms, confirming a sinus rhythm. The QRS duration is within normal limits at 80 ms, and the QTc interval is 419 ms. Waveform morphology across all leads shows no significant ST-segment elevation, ST-depression, or T-wave inversions. This diagnostic image is representative of symptomatic bradycardia, in this clinical context associated with medication-induced (clonidine) effects. The image is intended for medical education regarding heart rate interpretation and basic arrhythmia recognition.
sinus tachycardia ECG fast heart rate P wave before QRS narrow complex
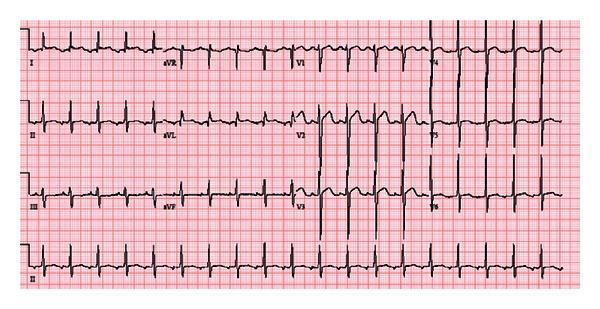
A 12-lead electrocardiogram (ECG) recorded at a heart rate of approximately 115 bpm, demonstrating a narrow QRS complex tachycardia. The QRS complexes are within normal duration (<120 ms) across all leads. P-wave morphology is distinctive, showing negative deflection (inversion) in leads II and aVL, while remaining upright (positive deflection) in leads III and aVF. These findings are clinically significant as they suggest a non-sinus atrial origin for the rhythm, specifically an ectopic atrial tachycardia likely originating from the left atrium. The ECG is presented on standard grid paper with standard limb and precordial lead arrangements (I, II, III, aVR, aVL, aVF, and V1-V6), with a rhythm strip of lead II at the bottom. The visual provides a diagnostic example of supraventricular tachycardia for medical educational analysis of P-wave polarity and atrial focus localization.
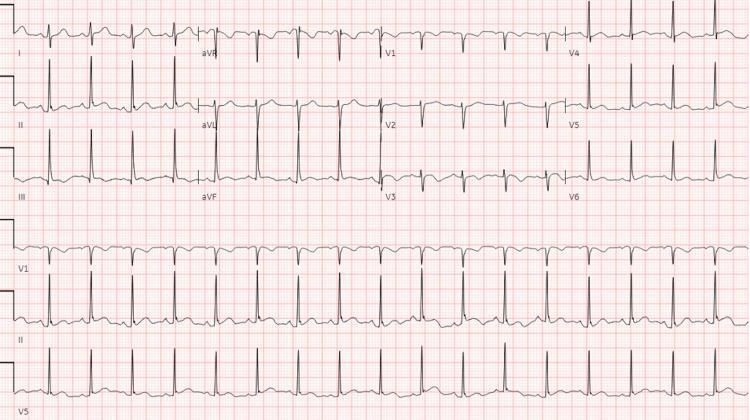
A standard 12-lead electrocardiogram (ECG) demonstrating sinus tachycardia. The tracing shows a regular rhythm with a heart rate exceeding 100 beats per minute, calculated at approximately 125 bpm based on R-R intervals of roughly 12 small boxes. Each narrow QRS complex is preceded by a normal, upright P wave in lead II, indicating a sinoatrial origin of the rhythm. The morphology of the QRS complexes, P waves, and T waves appears consistent across the limb leads (I, II, III, aVR, aVL, aVF) and precordial leads (V1-V6). No significant ST-segment elevation or depression is observed, and the axis appears normal. This diagnostic image illustrates a common physiological or pathological response to stress, pain, or underlying clinical conditions such as pulmonary embolism or cardiac masses, as mentioned in the clinical context. It is a foundational educational example for medical students and clinicians to recognize sinus tachycardia and differentiate it from other supraventricular tachycardias.
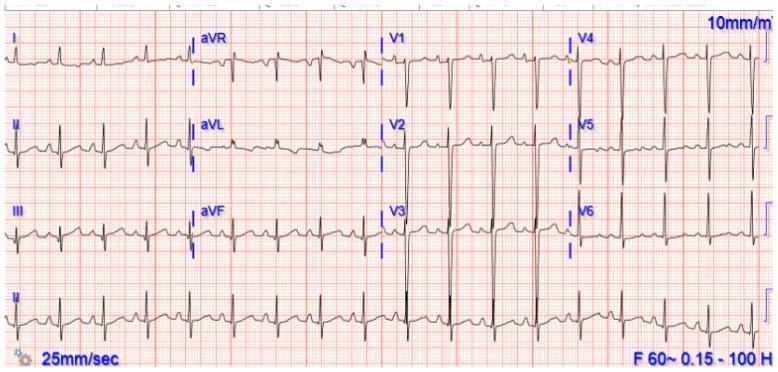
This diagnostic image is a 12-lead electrocardiogram (ECG) printed on standard grid paper at a speed of 25 mm/sec and calibration of 10 mm/mV. The tracing demonstrates a regular, narrow-complex rhythm with a heart rate exceeding 100 beats per minute, consistent with sinus tachycardia. P waves are identifiable before each QRS complex, indicating a sinus origin, though they are positioned close to the preceding T waves due to the rapid rate. The limb leads (I, II, III, aVR, aVL, aVF) show a normal electrical axis, with upright QRS complexes in leads I and II and inversion in lead aVR. Precordial leads (V1-V6) show normal R-wave progression. While ST segments and T waves are largely unremarkable, the high heart rate necessitates careful evaluation for subtle ischemia or conduction abnormalities. This ECG is representative of cardiovascular assessment in clinical scenarios like acute myocarditis, autonomic dysfunction, or compensatory physiological responses.
sinus arrhythmia ECG irregular rate with breathing respiratory variation
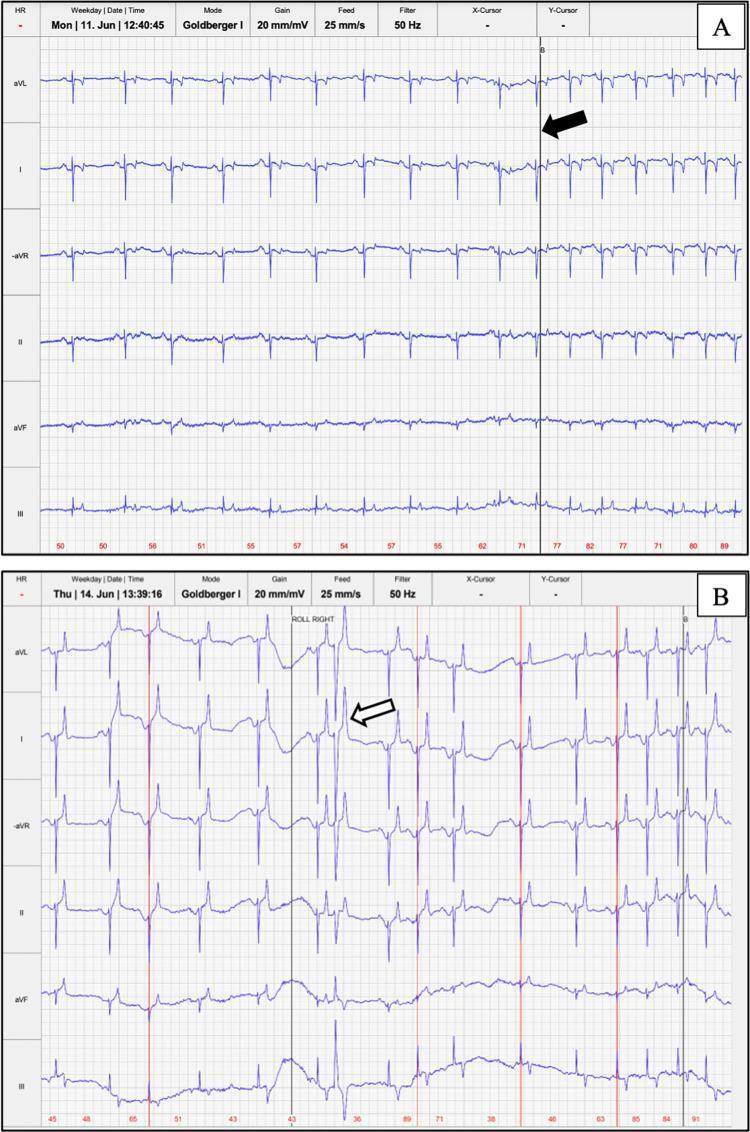
This diagnostic image displays two panels of telemetric electrocardiogram (ECG) recordings. Panel A demonstrates a normal respiratory sinus arrhythmia in a patient with a type B cardiac conduction system, characterized by a cyclical variation in heart rate synchronized with the respiratory cycle, indicated by a vertical black line and arrow marking inspiration. The six-lead view (aVL, I, -aVR, II, aVF, and III) shows predominantly negative depolarization in lead II and the base-apex modified lead I. Panel B illustrates the same six leads showing respiratory sinus arrhythmia complicated by an isolated ventricular premature complex (VPC), marked by a white arrow. The VPC is distinguished by its premature timing, widened QRS morphology, and absence of a preceding P wave. Both recordings are captured at a paper speed of 25 mm/s and a gain of 20 mm/mV over a 16-second sweep, providing a clinical comparison between physiological rhythm variation and pathological premature ventricular activation.
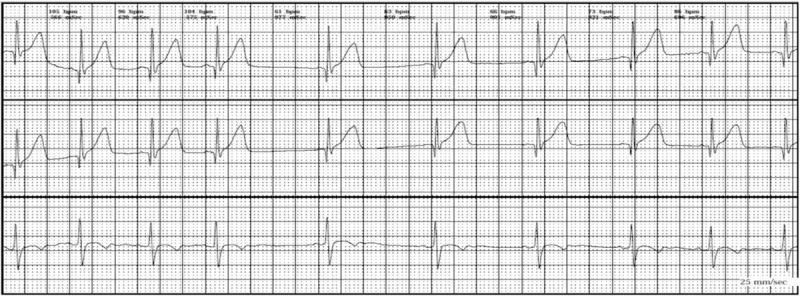
This diagnostic image displays a three-channel surface electrocardiogram (ECG) rhythm strip illustrating respiratory sinus arrhythmia (RSA). The tracing is set against a standard millimeter grid background with a recorded paper speed of 25 mm/sec. The top two panels demonstrate synchronized lead recordings featuring distinct P-waves, narrow QRS complexes, and prominent T-waves. Key visual features include significant variation in the R-R intervals, which correspond to phasic changes in heart rate. Annotation text at the top of the tracing indicates fluctuating heart rates ranging from approximately 61 bpm to 104 bpm. The morphology of the individual complexes remains consistent, indicating the rhythm originates from the sinoatrial node, but the cyclic lengthening and shortening of the heart rate are characteristic of respiratory-induced autonomic modulation. This ECG is a classic representation used in clinical cardiology and pediatrics to distinguish benign sinus arrhythmia from more concerning dysrhythmias, such as those occurring during breath-holding spells.
~/ecg-ppt/append_sinus_slides.py
"""
Appends 6 new slides on 'Diagnosing Sinus Rhythm' to the existing ECG PPTX.
Reference: Life in the Fast Lane (LITFL) ECG Library
"""
import requests
from io import BytesIO
from pptx import Presentation
from pptx.util import Inches, Pt
from pptx.dml.color import RGBColor
from pptx.enum.text import PP_ALIGN, MSO_ANCHOR

# ── Colour palette (same as master deck) ────────────────────────────────────
NAVY   = RGBColor(0x0D, 0x2B, 0x55)
TEAL   = RGBColor(0x00, 0x8B, 0x8B)
RED    = RGBColor(0xC0, 0x39, 0x2B)
WHITE  = RGBColor(0xFF, 0xFF, 0xFF)
DARK   = RGBColor(0x1A, 0x1A, 0x2E)
YELLOW = RGBColor(0xFF, 0xD7, 0x00)
GREEN  = RGBColor(0x1A, 0x8C, 0x5F)
ORANGE = RGBColor(0xE6, 0x7E, 0x22)
LGRAY  = RGBColor(0xF2, 0xF2, 0xF2)
PURPLE = RGBColor(0x6C, 0x3E, 0x91)
DKBLUE = RGBColor(0x12, 0x3A, 0x6A)

# ── Helper functions ──────────────────────────────────────────────────────────
def blank_slide(prs):
    return prs.slides.add_slide(prs.slide_layouts[6])

def add_rect(slide, x, y, w, h, fill_color):
    s = slide.shapes.add_shape(1, Inches(x), Inches(y), Inches(w), Inches(h))
    s.line.fill.background()
    if fill_color:
        s.fill.solid()
        s.fill.fore_color.rgb = fill_color
    else:
        s.fill.background()
    return s

def add_text(slide, text, x, y, w, h, size=16, bold=False, color=WHITE,
             align=PP_ALIGN.LEFT, valign=MSO_ANCHOR.MIDDLE, wrap=True, italic=False):
    tb = slide.shapes.add_textbox(Inches(x), Inches(y), Inches(w), Inches(h))
    tf = tb.text_frame
    tf.word_wrap = wrap
    tf.vertical_anchor = valign
    tf.margin_left = Pt(4); tf.margin_right = Pt(2)
    tf.margin_top = Pt(2);  tf.margin_bottom = Pt(2)
    p = tf.paragraphs[0]
    p.alignment = align
    run = p.add_run()
    run.text = text
    run.font.size = Pt(size)
    run.font.bold = bold
    run.font.italic = italic
    run.font.color.rgb = color
    run.font.name = "Calibri"
    return tb

def add_ml(slide, lines, x, y, w, h, size=14, default_color=DARK):
    """lines: list of str or (str, bold, color)"""
    tb = slide.shapes.add_textbox(Inches(x), Inches(y), Inches(w), Inches(h))
    tf = tb.text_frame
    tf.word_wrap = True
    tf.margin_left = Pt(4); tf.margin_right = Pt(4)
    tf.margin_top = Pt(2);  tf.margin_bottom = Pt(2)
    first = True
    for item in lines:
        if isinstance(item, str):
            txt, bld, col = item, False, default_color
        else:
            txt = item[0]; bld = item[1] if len(item) > 1 else False
            col = item[2] if len(item) > 2 else default_color
        p = tf.paragraphs[0] if first else tf.add_paragraph()
        first = False
        p.alignment = PP_ALIGN.LEFT
        p.line_spacing = 1.15
        run = p.add_run()
        run.text = txt
        run.font.size = Pt(size)
        run.font.bold = bld
        run.font.color.rgb = col
        run.font.name = "Calibri"
    return tb

def header_bar(slide, title, subtitle=None):
    add_rect(slide, 0, 0, 13.333, 1.1, NAVY)
    add_text(slide, title, 0.3, 0.05, 12.0, 0.7, size=30, bold=True, color=WHITE)
    if subtitle:
        add_text(slide, subtitle, 0.3, 0.72, 12.5, 0.38, size=13, color=YELLOW)

def divider(slide, y, color=TEAL, x=0.3, w=12.73):
    s = slide.shapes.add_shape(1, Inches(x), Inches(y), Inches(w), Inches(0.04))
    s.fill.solid(); s.fill.fore_color.rgb = color
    s.line.fill.background()

def footer(slide, txt="Sinus Rhythm Diagnosis | MBBS 3rd Year | Reference: Life in the Fast Lane (LITFL)"):
    add_rect(slide, 0, 7.15, 13.333, 0.35, NAVY)
    add_text(slide, txt, 0.3, 7.16, 12.5, 0.3, size=10, color=RGBColor(0xAA, 0xCC, 0xCC))

def fetch_img(slide, url, x, y, w, h):
    try:
        r = requests.get(url, timeout=15)
        if r.status_code == 200:
            slide.shapes.add_picture(BytesIO(r.content), Inches(x), Inches(y), Inches(w), Inches(h))
            return True
    except Exception as e:
        print(f"  img fail: {e}")
    return False

def img_placeholder(slide, x, y, w, h, label, col=RGBColor(0xDD, 0xEE, 0xEE)):
    add_rect(slide, x, y, w, h, col)
    add_text(slide, label, x + 0.1, y + h/2 - 0.3, w - 0.2, 0.7,
             size=13, color=NAVY, align=PP_ALIGN.CENTER)

# ═══════════════════════════════════════════════════════════════════════════
# Load existing presentation
# ═══════════════════════════════════════════════════════════════════════════
pptx_path = "/tmp/workspace/ecg-ppt/ECG_Basics_MBBS3rdYear.pptx"
prs = Presentation(pptx_path)
print(f"Loaded: {pptx_path}  ({len(prs.slides)} slides)")

# ═══════════════════════════════════════════════════════════════════════════
# SECTION DIVIDER SLIDE  (slide 15)
# ═══════════════════════════════════════════════════════════════════════════
slide = blank_slide(prs)
add_rect(slide, 0, 0, 13.333, 7.5, NAVY)
add_rect(slide, 0, 3.1, 13.333, 0.07, TEAL)
add_text(slide, "SECTION 2", 0.5, 1.2, 12.333, 0.6, size=20, bold=False,
         color=TEAL, align=PP_ALIGN.CENTER)
add_text(slide, "Diagnosing Sinus Rhythm", 0.5, 1.85, 12.333, 1.0, size=40,
         bold=True, color=WHITE, align=PP_ALIGN.CENTER)
add_text(slide, "How to identify Normal Sinus Rhythm & its variants on ECG",
         0.5, 2.9, 12.333, 0.6, size=18, color=YELLOW, align=PP_ALIGN.CENTER)
add_text(slide, "Reference: Life in the Fast Lane (LITFL) ECG Library  |  litfl.com/ecg-library/",
         0.5, 3.35, 12.333, 0.45, size=13,
         color=RGBColor(0x90, 0xCA, 0xCA), align=PP_ALIGN.CENTER)

topics = [
    "Criteria for Normal Sinus Rhythm",
    "P-wave analysis — the key to rhythm diagnosis",
    "Sinus Bradycardia",
    "Sinus Tachycardia",
    "Sinus Arrhythmia",
    "Non-sinus rhythms — differential at a glance",
]
add_rect(slide, 2.5, 3.95, 8.333, 3.0, DKBLUE)
add_text(slide, "Topics covered in this section:", 2.6, 4.0, 8.0, 0.42,
         size=14, bold=True, color=YELLOW)
add_ml(slide, [f"  {chr(0x25B6)}  {t}" for t in topics], 2.6, 4.42, 8.0, 2.45,
       size=14, default_color=WHITE)
footer(slide)

# ═══════════════════════════════════════════════════════════════════════════
# SLIDE 16  —  Criteria for Normal Sinus Rhythm (LITFL 5-point checklist)
# ═══════════════════════════════════════════════════════════════════════════
slide = blank_slide(prs)
add_rect(slide, 0, 0, 13.333, 7.5, LGRAY)
header_bar(slide, "Diagnosing Normal Sinus Rhythm — The 5-Point LITFL Checklist",
           "All 5 criteria MUST be met before calling a rhythm 'normal sinus'")

# Left: 5-point criteria
add_rect(slide, 0.3, 1.2, 7.5, 5.7, WHITE)
criteria = [
    ("The 5 Diagnostic Criteria (LITFL)", True, NAVY),
    ("", False, DARK),
    ("1.  Rate  60 – 100 bpm", True, TEAL),
    ("     Normal: 60–100 bpm at rest", False, DARK),
    ("     < 60 = Sinus Bradycardia  |  > 100 = Sinus Tachycardia", False, DARK),
    ("", False, DARK),
    ("2.  P wave present before EVERY QRS", True, TEAL),
    ("     Upright in leads I, II, aVF", False, DARK),
    ("     Inverted in aVR (normal)", False, DARK),
    ("     One P wave per QRS (1:1 relationship)", False, DARK),
    ("", False, DARK),
    ("3.  Consistent P-wave morphology", True, TEAL),
    ("     Same shape in every beat (single pacemaker = SA node)", False, DARK),
    ("     P duration: 80–100 ms  |  Amplitude: < 2.5 mm (limb leads)", False, DARK),
    ("", False, DARK),
    ("4.  PR interval 120 – 200 ms  (3–5 small squares)", True, TEAL),
    ("     Constant across all beats", False, DARK),
    ("     Represents normal AV nodal conduction", False, DARK),
    ("", False, DARK),
    ("5.  Regular R-R intervals  (± 10% variability allowed)", True, TEAL),
    ("     All R-R intervals essentially equal", False, DARK),
    ("     Minor variation with respiration is normal (sinus arrhythmia)", False, DARK),
]
add_ml(slide, criteria, 0.35, 1.25, 7.2, 5.55, size=13, default_color=DARK)

# Right: checklist visual + mnemonic
add_rect(slide, 8.1, 1.2, 4.9, 2.7, WHITE)
chk = [
    ("Quick Checklist", True, NAVY),
    ("", False, DARK),
    ("  \u2705  Rate 60–100 bpm", False, GREEN),
    ("  \u2705  P wave before every QRS", False, GREEN),
    ("  \u2705  P upright in I, II; inverted in aVR", False, GREEN),
    ("  \u2705  PR interval 0.12–0.20 s", False, GREEN),
    ("  \u2705  Regular R-R intervals", False, GREEN),
    ("", False, DARK),
    ("If ALL 5 \u2192 Normal Sinus Rhythm", True, GREEN),
]
add_ml(slide, chk, 8.15, 1.25, 4.7, 2.6, size=13, default_color=DARK)

add_rect(slide, 8.1, 4.0, 4.9, 2.9, DKBLUE)
mnemonic = [
    ("Mnemonic  'RPPRI'", True, YELLOW),
    ("", False, WHITE),
    ("R  — Regular rate (60–100)", False, WHITE),
    ("P  — P wave present & upright (I, II)", False, WHITE),
    ("P  — P before every QRS (1:1)", False, WHITE),
    ("R  — Regular R-R interval", False, WHITE),
    ("I  — Interval: PR 0.12–0.20 s", False, WHITE),
    ("", False, WHITE),
    ("All 5 must be satisfied!", True, YELLOW),
]
add_ml(slide, mnemonic, 8.15, 4.05, 4.7, 2.8, size=13, default_color=WHITE)
footer(slide)

# ═══════════════════════════════════════════════════════════════════════════
# SLIDE 17  —  P-Wave Analysis: The Key to Rhythm Diagnosis
# ═══════════════════════════════════════════════════════════════════════════
slide = blank_slide(prs)
add_rect(slide, 0, 0, 13.333, 7.5, LGRAY)
header_bar(slide, "P-Wave Analysis — The Key to Rhythm Diagnosis",
           "LITFL: 'The P wave is the most important component in rhythm evaluation'")

add_rect(slide, 0.3, 1.2, 6.2, 5.7, WHITE)
pwave_lines = [
    ("Normal P-Wave Characteristics", True, NAVY),
    ("", False, DARK),
    ("Morphology", True, TEAL),
    ("  Smooth, rounded, monophasic in lead II", False, DARK),
    ("  Biphasic in V1 (initial + / terminal −)", False, DARK),
    ("", False, DARK),
    ("Polarity (directionality)", True, TEAL),
    ("  Upright   (+): I, II, aVF, V4–V6", False, DARK),
    ("  Inverted  (−): aVR  (always inverted — normal)", False, DARK),
    ("  Variable:     III, aVL, V1–V3", False, DARK),
    ("", False, DARK),
    ("Duration:  80–100 ms  (2–2.5 small squares)", True, TEAL),
    ("Amplitude: < 2.5 mm in limb leads", True, TEAL),
    ("", False, DARK),
    ("Abnormal P-Wave Findings", True, RED),
    ("  Absent P waves  → AF, junctional rhythm, hyperkalaemia", False, DARK),
    ("  Inverted in II   → Retrograde conduction, ectopic atrial", False, DARK),
    ("  Tall peaked (>2.5mm in II) → P pulmonale (RAE)", False, DARK),
    ("  Broad/notched (>110ms in II) → P mitrale (LAE)", False, DARK),
    ("  >3 morphologies → Multifocal atrial rhythm / MAT", False, DARK),
    ("  Saw-tooth waves → Atrial flutter", False, DARK),
]
add_ml(slide, pwave_lines, 0.35, 1.25, 5.9, 5.55, size=13, default_color=DARK)

# Right: two-column P-wave interpretation table
add_rect(slide, 6.8, 1.2, 6.2, 5.7, WHITE)
pwave_table = [
    ("P-Wave Interpretation Guide", True, NAVY),
    ("", False, DARK),
    ("Finding                    Interpretation", True, TEAL),
    ("\u2500" * 44, False, RGBColor(0xAA, 0xAA, 0xAA)),
    ("Upright in I & II          Sinus origin (SA node)", False, DARK),
    ("Inverted in II, III, aVF   Retrograde / AV junctional", False, DARK),
    ("P absent, irregular        Atrial fibrillation", False, DARK),
    ("Saw-tooth @ 300/min        Atrial flutter", False, DARK),
    ("Tall peaked (>2.5mm II)    P pulmonale — RAE", False, DARK),
    ("Broad notched (>110ms II)  P mitrale — LAE", False, DARK),
    ("Variable morphology (>3)   Multifocal atrial rhythm", False, DARK),
    ("PR < 120ms + delta wave    WPW (pre-excitation)", False, DARK),
    ("", False, DARK),
    ("P-QRS Relationship", True, NAVY),
    ("\u2500" * 44, False, RGBColor(0xAA, 0xAA, 0xAA)),
    ("Every P followed by QRS    Normal conduction", False, DARK),
    ("PR progressively longer    Mobitz I (Wenckebach)", False, DARK),
    ("PR fixed, dropped QRS      Mobitz II", False, DARK),
    ("P & QRS independent        3rd degree (complete) heart block", False, DARK),
]
add_ml(slide, pwave_table, 6.85, 1.25, 6.0, 5.55, size=12.5, default_color=DARK)
footer(slide)

# ═══════════════════════════════════════════════════════════════════════════
# SLIDE 18  —  Sinus Bradycardia & Sinus Tachycardia
# ═══════════════════════════════════════════════════════════════════════════
slide = blank_slide(prs)
add_rect(slide, 0, 0, 13.333, 7.5, LGRAY)
header_bar(slide, "Sinus Variants: Bradycardia & Tachycardia",
           "Sinus origin confirmed — only rate is outside normal range")

# LEFT — Bradycardia
add_rect(slide, 0.3, 1.2, 6.2, 5.7, WHITE)
add_rect(slide, 0.3, 1.2, 6.2, 0.48, TEAL)
add_text(slide, "Sinus Bradycardia  (< 60 bpm)", 0.35, 1.24, 6.0, 0.42,
         size=15, bold=True, color=WHITE)
brady_lines = [
    ("Definition", True, NAVY),
    ("  All sinus criteria met + rate < 60 bpm", False, DARK),
    ("", False, DARK),
    ("ECG Features", True, TEAL),
    ("  \u2022 Regular rhythm, P before every QRS", False, DARK),
    ("  \u2022 Upright P in I, II, aVF", False, DARK),
    ("  \u2022 Narrow QRS (< 120 ms)", False, DARK),
    ("  \u2022 PR interval normal (0.12–0.20 s)", False, DARK),
    ("  \u2022 Rate < 60 bpm", False, DARK),
    ("", False, DARK),
    ("Common Causes", True, TEAL),
    ("  \u2022 Athletes (physiological)", False, DARK),
    ("  \u2022 Vasovagal syncope", False, DARK),
    ("  \u2022 Hypothyroidism", False, DARK),
    ("  \u2022 Inferior MI (RCA ischaemia to SA/AV node)", False, DARK),
    ("  \u2022 Drugs: beta-blockers, digoxin, CCB, amiodarone", False, DARK),
    ("  \u2022 Sick sinus syndrome", False, DARK),
    ("  \u2022 Raised ICP (Cushing's response)", False, DARK),
    ("", False, DARK),
    ("Management", True, RED),
    ("  Asymptomatic: observe", False, DARK),
    ("  Symptomatic: Atropine 0.5–1 mg IV", False, DARK),
    ("  Refractory: Transcutaneous pacing", False, DARK),
]
add_ml(slide, brady_lines, 0.35, 1.75, 5.9, 5.1, size=12.5, default_color=DARK)

# RIGHT — Tachycardia
add_rect(slide, 6.8, 1.2, 6.2, 5.7, WHITE)
add_rect(slide, 6.8, 1.2, 6.2, 0.48, RED)
add_text(slide, "Sinus Tachycardia  (> 100 bpm)", 6.85, 1.24, 6.0, 0.42,
         size=15, bold=True, color=WHITE)
tachy_lines = [
    ("Definition", True, NAVY),
    ("  All sinus criteria met + rate > 100 bpm", False, DARK),
    ("", False, DARK),
    ("ECG Features", True, RED),
    ("  \u2022 Regular rhythm, P before every QRS", False, DARK),
    ("  \u2022 Upright P in I, II — may merge with T wave", False, DARK),
    ("  \u2022 Narrow QRS (unless aberrant conduction)", False, DARK),
    ("  \u2022 PR may shorten at faster rates", False, DARK),
    ("  \u2022 Rate > 100 bpm (up to ~180–220 bpm max)", False, DARK),
    ("", False, DARK),
    ("Common Causes", True, RED),
    ("  \u2022 Pain, anxiety, exercise (physiological)", False, DARK),
    ("  \u2022 Fever, infection, sepsis", False, DARK),
    ("  \u2022 Hypovolaemia, anaemia, dehydration", False, DARK),
    ("  \u2022 Pulmonary embolism", False, DARK),
    ("  \u2022 Hyperthyroidism", False, DARK),
    ("  \u2022 Drugs: salbutamol, adrenaline, caffeine", False, DARK),
    ("  \u2022 Heart failure (compensatory)", False, DARK),
    ("", False, DARK),
    ("Key Point", True, NAVY),
    ("  Sinus tachycardia is ALWAYS secondary to", False, DARK),
    ("  an underlying cause — treat the cause!", True, RED),
]
add_ml(slide, tachy_lines, 6.85, 1.75, 5.9, 5.1, size=12.5, default_color=DARK)
footer(slide)

# ═══════════════════════════════════════════════════════════════════════════
# SLIDE 19  —  ECG Images: Sinus Brady & Sinus Tachy
# ═══════════════════════════════════════════════════════════════════════════
slide = blank_slide(prs)
add_rect(slide, 0, 0, 13.333, 7.5, LGRAY)
header_bar(slide, "ECG Recognition — Sinus Bradycardia & Sinus Tachycardia",
           "Apply the 5-point checklist to each tracing")

# Sinus Brady image (top half)
add_rect(slide, 0.3, 1.15, 13.0, 0.38, TEAL)
add_text(slide, "SINUS BRADYCARDIA  —  Rate ~43 bpm | Regular | P before every QRS | Narrow QRS | PR normal",
         0.35, 1.18, 12.8, 0.32, size=12, bold=True, color=WHITE)

ok = fetch_img(slide,
    "https://cdn.orris.care/cdss_images/pmc_clinical_VQA_de75b2c5885fac7e288c870f345c2a8b02bbe0919c0d097cff2b216ffecca514.jpg",
    0.3, 1.55, 13.0, 2.5)
if not ok:
    img_placeholder(slide, 0.3, 1.55, 13.0, 2.5, "ECG: Sinus Bradycardia (~43 bpm)")

# Annotations
add_ml(slide, [
    ("\u2714 Criteria check:", True, NAVY),
    ("\u2022 Rate ~43 bpm  (< 60)", False, RED),
    ("\u2022 P before every QRS  \u2714", False, GREEN),
    ("\u2022 Upright P in II  \u2714", False, GREEN),
    ("\u2022 PR ~170 ms (normal)  \u2714", False, GREEN),
    ("\u2022 Regular R-R  \u2714", False, GREEN),
    ("= Sinus Bradycardia", True, TEAL),
], 0.35, 4.15, 3.8, 2.85, size=12.5)

# Sinus Tachy image (bottom half)
add_rect(slide, 0.3, 4.1, 13.0, 0.38, RED)
add_text(slide, "SINUS TACHYCARDIA  —  Rate ~125 bpm | Regular | P before every QRS | Narrow QRS | PR normal",
         0.35, 4.12, 12.8, 0.33, size=12, bold=True, color=WHITE)

ok2 = fetch_img(slide,
    "https://cdn.orris.care/cdss_images/pmc_clinical_VQA_5542ca0083682d9ce3f333f22f855583a8460a2f16ae1ed137e548ae9fa78ff6.jpg",
    4.2, 4.5, 9.1, 2.9)
if not ok2:
    img_placeholder(slide, 4.2, 4.5, 9.1, 2.9, "ECG: Sinus Tachycardia (~125 bpm)", RGBColor(0xFF, 0xEE, 0xEE))

add_ml(slide, [
    ("\u2714 Criteria check:", True, NAVY),
    ("\u2022 Rate ~125 bpm  (> 100)", False, RED),
    ("\u2022 P before every QRS  \u2714", False, GREEN),
    ("\u2022 Upright P in I, II  \u2714", False, GREEN),
    ("\u2022 PR normal  \u2714", False, GREEN),
    ("\u2022 Regular R-R  \u2714", False, GREEN),
    ("= Sinus Tachycardia", True, RED),
], 0.35, 4.55, 3.8, 2.85, size=12.5)
footer(slide)

# ═══════════════════════════════════════════════════════════════════════════
# SLIDE 20  —  Sinus Arrhythmia & 7-Step Rhythm Analysis
# ═══════════════════════════════════════════════════════════════════════════
slide = blank_slide(prs)
add_rect(slide, 0, 0, 13.333, 7.5, LGRAY)
header_bar(slide, "Sinus Arrhythmia & 7-Step LITFL Rhythm Analysis",
           "LITFL: ECG Rhythm Evaluation — 7-step systematic approach")

# Left: sinus arrhythmia
add_rect(slide, 0.3, 1.2, 6.2, 5.7, WHITE)
sa_lines = [
    ("Sinus Arrhythmia", True, NAVY),
    ("", False, DARK),
    ("Definition", True, TEAL),
    ("  Sinus rhythm with variation in R-R intervals", False, DARK),
    ("  that varies with the respiratory cycle", False, DARK),
    ("  (rate increases on inspiration, decreases on expiration)", False, DARK),
    ("", False, DARK),
    ("ECG Features", True, TEAL),
    ("  \u2022 Irregular R-R intervals (>10% variation)", False, DARK),
    ("  \u2022 All other sinus criteria met", False, DARK),
    ("  \u2022 P-wave morphology consistent", False, DARK),
    ("  \u2022 Variation synchronous with breathing", False, DARK),
    ("", False, DARK),
    ("Types", True, TEAL),
    ("  Respiratory sinus arrhythmia:", False, DARK),
    ("    — Normal, common in young/athletes", False, DARK),
    ("    — Mediated by vagus nerve (respiratory cycle)", False, DARK),
    ("  Non-respiratory sinus arrhythmia:", False, DARK),
    ("    — Less common, not linked to breathing", False, DARK),
    ("    — May indicate SA node dysfunction", False, DARK),
    ("", False, DARK),
    ("Clinical Significance", True, NAVY),
    ("  Benign finding in healthy individuals", False, DARK),
    ("  Reduced RSA in elderly / heart disease", False, DARK),
    ("  Sign of good cardiac autonomic function when present", False, DARK),
]
add_ml(slide, sa_lines, 0.35, 1.25, 5.9, 5.55, size=12.5, default_color=DARK)

# Right: 7-step LITFL rhythm analysis
add_rect(slide, 6.8, 1.2, 6.2, 5.7, DKBLUE)
litfl7 = [
    ("LITFL 7-Step Rhythm Analysis", True, YELLOW),
    ("", False, WHITE),
    ("Step 1  \u2014  RATE", True, TEAL),
    ("  Bradycardia / Normal / Tachycardia?", False, WHITE),
    ("", False, WHITE),
    ("Step 2  \u2014  PATTERN of QRS complexes", True, TEAL),
    ("  Regular / Regularly irregular / Irregularly irregular", False, WHITE),
    ("", False, WHITE),
    ("Step 3  \u2014  QRS MORPHOLOGY", True, TEAL),
    ("  Narrow (< 120 ms) or Broad (>= 120 ms)?", False, WHITE),
    ("", False, WHITE),
    ("Step 4  \u2014  P WAVES", True, TEAL),
    ("  Present? Morphology? Polarity?", False, WHITE),
    ("", False, WHITE),
    ("Step 5  \u2014  P-QRS RELATIONSHIP", True, TEAL),
    ("  P before every QRS? PR interval fixed?", False, WHITE),
    ("", False, WHITE),
    ("Step 6  \u2014  ONSET & TERMINATION", True, TEAL),
    ("  Gradual (sinus) vs abrupt (re-entrant)?", False, WHITE),
    ("", False, WHITE),
    ("Step 7  \u2014  VAGAL MANOEUVRES", True, TEAL),
    ("  Response: slows (SVT) vs no effect (VT)?", False, WHITE),
]
add_ml(slide, litfl7, 6.85, 1.25, 6.0, 5.55, size=12.5, default_color=WHITE)
footer(slide)

# ═══════════════════════════════════════════════════════════════════════════
# SLIDE 21  —  Sinus vs Non-Sinus: Differential at a Glance
# ═══════════════════════════════════════════════════════════════════════════
slide = blank_slide(prs)
add_rect(slide, 0, 0, 13.333, 7.5, LGRAY)
header_bar(slide, "Sinus vs Non-Sinus Rhythms — Differential Diagnosis",
           "Use P-wave analysis + LITFL 7-step method to differentiate")

# Column headers
cols = [
    ("Rhythm", 0.3,  NAVY),
    ("Rate (bpm)", 2.3, NAVY),
    ("P wave", 3.9,  NAVY),
    ("P-QRS relation", 5.8, NAVY),
    ("QRS", 8.3, NAVY),
    ("Key Feature", 10.0, NAVY),
]
add_rect(slide, 0.3, 1.2, 12.73, 0.48, NAVY)
for label, x, col in cols:
    add_text(slide, label, x, 1.23, 1.9, 0.42, size=12, bold=True, color=WHITE)

rows = [
    ("Normal Sinus Rhythm",    "60–100",     "Upright I, II, aVF",    "1:1, PR 0.12–0.20s", "Narrow",  "All criteria met",                GREEN),
    ("Sinus Bradycardia",      "< 60",        "Upright I, II",         "1:1, PR normal",      "Narrow",  "Rate only abnormal",              TEAL),
    ("Sinus Tachycardia",      "> 100",       "Upright, may merge T",  "1:1, PR may shorten", "Narrow",  "Secondary to underlying cause",   ORANGE),
    ("Sinus Arrhythmia",       "60–100 vary", "Upright I, II",         "1:1, PR normal",      "Narrow",  "R-R varies with respiration",     TEAL),
    ("Atrial Fibrillation",    "Variable",    "Absent (f-waves)",      "Irregular",           "Narrow",  "Irregularly irregular",           RED),
    ("Atrial Flutter",         "75–150",      "Saw-tooth ~300/min",    "Fixed ratio (2:1…)",  "Narrow",  "Atrial rate 300, ventr. ~150",    RED),
    ("Junctional Rhythm",      "40–60",       "Absent/inverted in II", "Retrograde or none",  "Narrow",  "No sinus P; AV node pacemaker",   PURPLE),
    ("1st deg AV Block",       "60–100",      "Normal, upright",       "1:1, PR > 200 ms",    "Narrow",  "All P wave → QRS, PR prolonged",  ORANGE),
    ("3rd deg AV Block",       "20–60 (V)",   "Present, not related",  "Dissociation",        "Broad",   "P & QRS independent",             RED),
    ("VT",                     "> 100",       "Dissociated/absent",    "Dissociation",        "BROAD",   "Broad complex; consider VT first",RED),
]

row_colors = [RGBColor(0xFF,0xFF,0xFF), RGBColor(0xF4,0xF9,0xF9)]
for i, (rhythm, rate, pwave, pqrs, qrs, key, txt_col) in enumerate(rows):
    y = 1.72 + i * 0.52
    add_rect(slide, 0.3, y, 12.73, 0.50, row_colors[i % 2])
    for text, x in [(rhythm, 0.33), (rate, 2.33), (pwave, 3.93),
                    (pqrs, 5.83), (qrs, 8.33), (key, 10.03)]:
        add_text(slide, text, x, y + 0.02, 1.85, 0.46, size=11,
                 color=txt_col if text == rhythm else DARK, bold=(text == rhythm),
                 align=PP_ALIGN.LEFT)

footer(slide)

# ═══════════════════════════════════════════════════════════════════════════
# SLIDE 22  —  Sinus Rhythm: Worked Examples & Summary
# ═══════════════════════════════════════════════════════════════════════════
slide = blank_slide(prs)
add_rect(slide, 0, 0, 13.333, 7.5, LGRAY)
header_bar(slide, "Sinus Rhythm — Worked Examples & Key Summary",
           "Practice applying the 5-point checklist to real ECGs")

# Normal sinus rhythm ECG image
ok3 = fetch_img(slide,
    "https://cdn.orris.care/cdss_images/pmc_clinical_VQA_3b3b27fc529695aa76ff039948a574b06c3d5877772028c8a88bdfb524aa71d4.jpg",
    0.3, 1.2, 8.2, 3.3)
if not ok3:
    img_placeholder(slide, 0.3, 1.2, 8.2, 3.3, "ECG: Normal Sinus Rhythm")

# Annotation overlay
add_ml(slide, [
    ("Normal Sinus Rhythm — Step-by-Step", True, NAVY),
    ("Rate: 75 bpm (4 large squares)  \u2714", False, GREEN),
    ("P wave: upright in I, II, aVF   \u2714", False, GREEN),
    ("P before every QRS (1:1)         \u2714", False, GREEN),
    ("PR interval: ~0.16 s (normal)   \u2714", False, GREEN),
    ("Regular R-R intervals            \u2714", False, GREEN),
    ("Diagnosis: Normal Sinus Rhythm", True, GREEN),
], 8.65, 1.2, 4.4, 3.3, size=13)

# Bottom summary panel
add_rect(slide, 0.3, 4.65, 12.7, 2.6, DKBLUE)
summary = [
    ("Section Summary — Diagnosing Sinus Rhythm", True, YELLOW),
    ("", False, WHITE),
    ("\u2714  Use the LITFL 5-point checklist: Rate | P wave present | P upright in I & II | PR 0.12–0.20 s | Regular R-R", False, WHITE),
    ("\u2714  Lead II is the best single lead for rhythm assessment (P waves most prominent)", False, WHITE),
    ("\u2714  Sinus Bradycardia = all sinus criteria + rate < 60 bpm  |  Sinus Tachycardia = rate > 100 bpm (always find the cause)", False, WHITE),
    ("\u2714  Sinus Arrhythmia = benign R-R variation with breathing; common in young patients and athletes", False, WHITE),
    ("\u2714  If P wave is absent, inverted, or dissociated from QRS \u2192 it is NOT sinus rhythm", False, WHITE),
    ("\u2714  LITFL 7-step rhythm analysis: Rate \u2192 Pattern \u2192 QRS morphology \u2192 P waves \u2192 P-QRS \u2192 Onset \u2192 Vagal response", False, WHITE),
]
add_ml(slide, summary, 0.4, 4.7, 12.5, 2.5, size=12.5, default_color=WHITE)
footer(slide)

# ═══════════════════════════════════════════════════════════════════════════
# Save updated presentation
# ═══════════════════════════════════════════════════════════════════════════
out_path = "/tmp/workspace/ecg-ppt/ECG_Basics_MBBS3rdYear.pptx"
prs.save(out_path)
print(f"\nSaved: {out_path}")
print(f"Total slides: {len(prs.slides)}")
for i, s in enumerate(prs.slides, 1):
    for shape in s.shapes:
        if shape.has_text_frame:
            t = shape.text_frame.text.strip()
            if 4 < len(t) < 80:
                print(f"  Slide {i:2d}: {t[:70]}")
                break
cd /tmp/workspace/ecg-ppt && python append_sinus_slides.py 2>&1
ECG Basics MBBS3rdYear
Presentation · PPTX
What was added (Slides 15–22)
| Slide | Title | Content |
|---|---|---|
| 15 | Section 2 Divider | Full-bleed navy cover slide introducing the Sinus Rhythm section |
| 16 | 5-Point LITFL Checklist | All criteria to call a rhythm "Normal Sinus" — with mnemonic RPPRI |
| 17 | P-Wave Analysis | Normal P-wave morphology, polarity by lead, abnormal findings, P-QRS relationship table |
| 18 | Sinus Brady vs Tachy | Side-by-side: definition, ECG features, causes, management for each |
| 19 | ECG Recognition (images) | Real 12-lead ECGs of sinus bradycardia (~43 bpm) and sinus tachycardia (~125 bpm) with annotation checklist |
| 20 | Sinus Arrhythmia + 7-Step Method | RSA definition & features; full LITFL 7-step rhythm analysis protocol |
| 21 | Differential Diagnosis Table | 10-row table comparing NSR, sinus brady, sinus tachy, sinus arrhythmia, AF, flutter, junctional, AV blocks, VT |
| 22 | Worked Example + Summary | Annotated normal ECG + 8-point section summary box |
- R = Regular rate 60–100
- P = P wave present and upright (I, II)
- P = P before every QRS (1:1)
- R = Regular R-R interval
- I = Interval: PR 0.12–0.20 s