
Basal metabolic rate.
Reading File
Finding Sources
Finding Sources
The best dedicated sections are in Guyton and Hall (physiology) and Basic Medical Biochemistry. Let me read both simultaneously.
Reading File
Reading File
Reading File
Reading File
Reading File
I now have comprehensive content from three authoritative sources. Let me fetch the key figures.
Loading Image
Loading Image
Here is a comprehensive overview of Basal Metabolic Rate (BMR).
Basal Metabolic Rate (BMR)
Definition
BMR is the minimum energy expenditure required to maintain life — the functioning of the lungs, kidneys, brain, heart, maintenance of ionic gradients across membranes, and the reactions of biochemical pathways — measured in a person who is:
- Mentally and bodily at rest
- In a thermoneutral environment
- 12–18 hours after the last meal
The resting metabolic rate (RMR), measured after awakening (rather than during sleep), is numerically very similar but slightly higher than BMR, and is more practical to measure clinically.
BMR as a Component of Daily Energy Expenditure
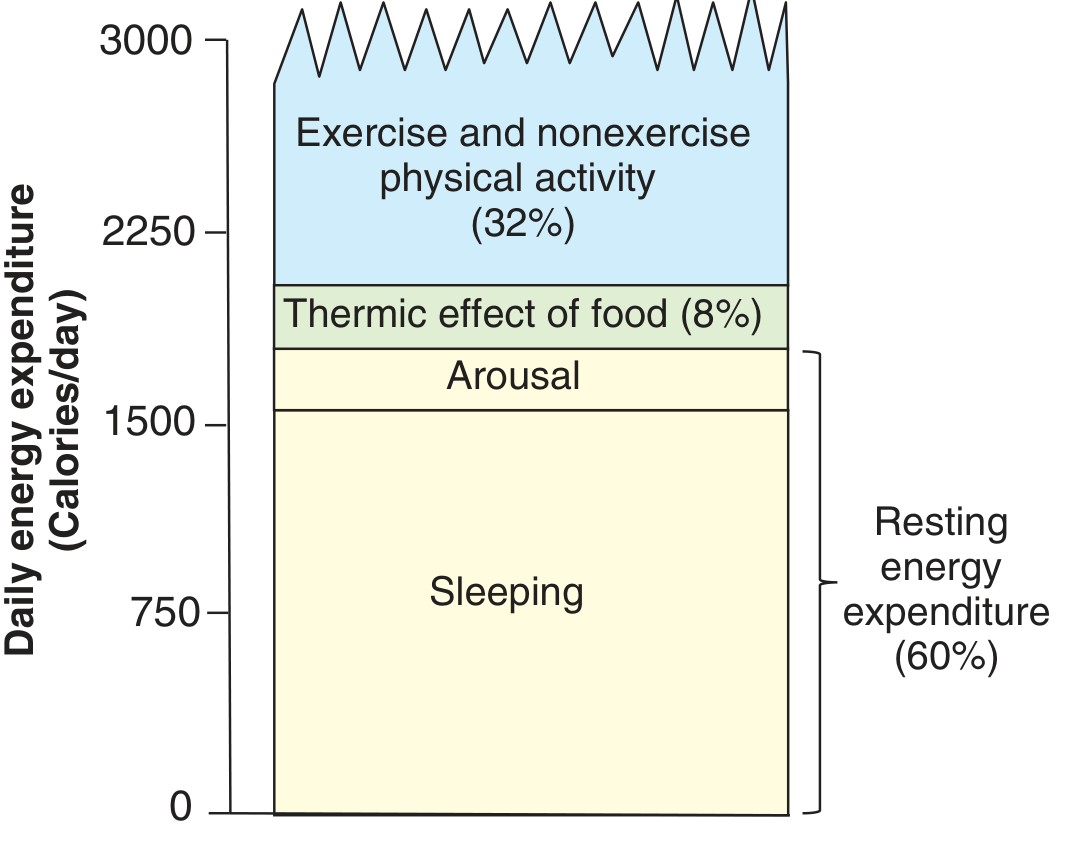
BMR accounts for 50–70% of daily energy expenditure in sedentary individuals. The three major components of total daily energy expenditure are:
- BMR / Resting energy expenditure (~60%) — sleeping + arousal cost
- Thermic effect of food (~8%) — digestion, absorption, and metabolism of nutrients
- Physical activity (~32%) — exercise and non-exercise activity thermogenesis
Standard Measurement Conditions
Strict criteria for measuring BMR (Guyton & Hall):
- No food for at least 12 hours
- After a night of restful sleep
- No strenuous activity for at least 1 hour before the test
- All psychic and physical sources of excitement eliminated
- Ambient temperature 68–80°F (20–27°C)
- No physical activity during the test
Oxygen utilization is the usual measure. BMR normally averages 65–70 Calories/hour in a 70-kg adult man.
Measurement Methods
| Method | Description |
|---|---|
| Direct calorimetry | Measures heat production directly |
| Indirect calorimetry | Measures O₂ consumption and CO₂ production; calculates respiratory quotient (RQ) |
| Simplified O₂ only | Measures O₂ consumption alone; less accurate but more practical |
| Predictive equations | Estimates from height, weight, age, sex — accurate to ±10% in ~90% of adults with BMI 18.5–45 |
Respiratory quotient (RQ): CO₂ produced / O₂ consumed
- Pure carbohydrate oxidation: RQ = 1.00
- Pure protein oxidation: RQ = 0.83
- Pure fat oxidation: RQ = 0.71
Estimating BMR: The Mifflin–St. Jeor Equation
The most widely validated predictive formula (Basic Medical Biochemistry, 6e):
| Sex | Formula |
|---|---|
| Males | (10 × W) + (6.25 × H) − (5 × A) + 5 |
| Females | (10 × W) + (6.25 × H) − (5 × A) − 161 |
W = weight in kg; H = height in cm; A = age in years; result in kcal/day
Quick estimate:
- Men: ~1 kcal/kg/hr (24 kcal/kg/day)
- Women: ~0.9 kcal/kg/hr (21.6 kcal/kg/day)
Factors Affecting BMR
| Factor | Effect |
|---|---|
| Lean/fat-free mass | ↑ muscle mass → ↑ BMR (muscle = 20–30% of BMR at rest) |
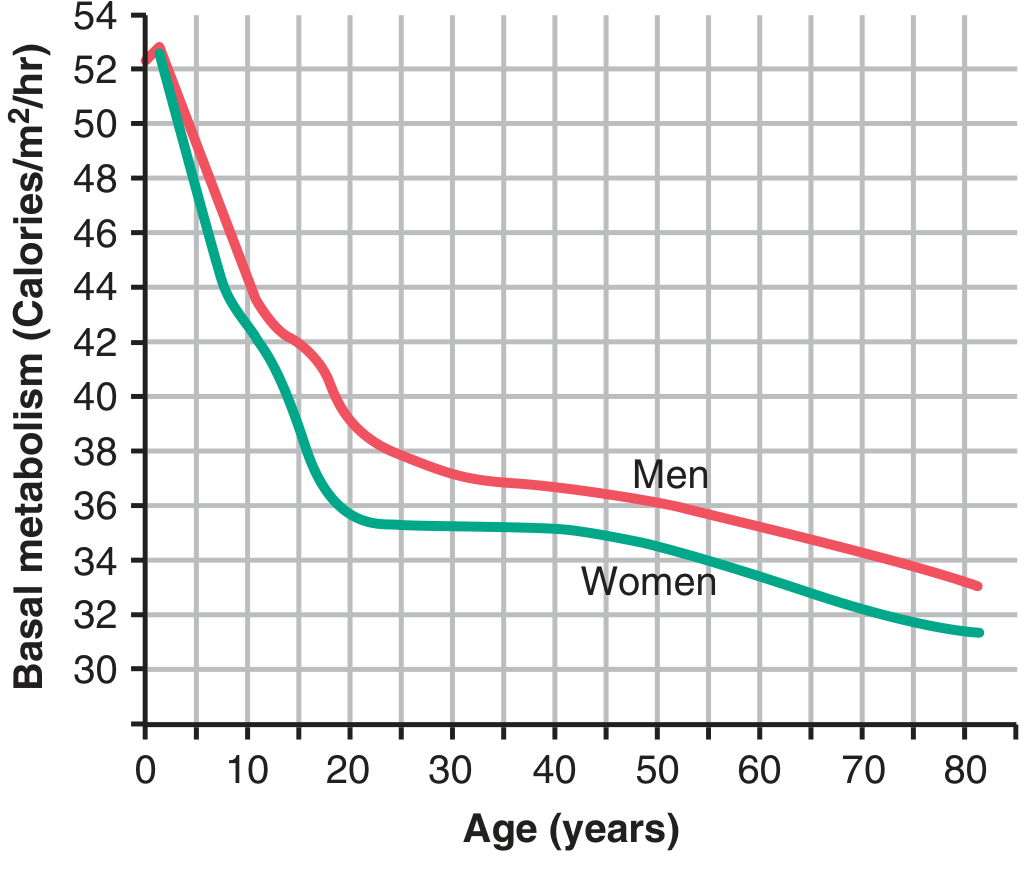
| Sex | Males > females (due to higher muscle, lower adipose %) |
| Age | BMR ↓ with age (muscle atrophy, fat deposition) |
| Thyroid hormones | Hyperthyroidism ↑ BMR 50–100%; hypothyroidism ↓ 40–50% |
| Testosterone | ↑ BMR ~10–15% (anabolic effect on muscle) |
| Growth hormone | ↑ BMR ~20% in GH-deficient adults on replacement |
| Fever | ↑ ~10–12% per °C rise in body temperature |
| Sleep | ↓ 10–15% (decreased muscle tone + reduced CNS activity) |
| Malnutrition | ↓ 20–30% (starvation adaptation) |
| Pregnancy/lactation | ↑ BMR |
| Cold environment | ↑ slightly (thermogenesis activation) |
| Genetics | Accounts for up to ~10% of inter-individual variation |
BMR vs. Age and Sex
Organ Contributions to BMR
Although skeletal muscle is the largest body mass contributor, at rest it accounts for only 20–30% of BMR. The major resting energy consumers are the brain, heart, kidneys, and liver. During maximal exercise, however, muscle can account for 80–90% of total energy expenditure.
Adipose tissue contributes very little — only ~3 kcal/kg of body fat per day. An exception is brown adipose tissue (BAT), which expresses uncoupling protein-1 (UCP-1), allowing mitochondrial proton leak that generates heat instead of ATP. While only present in small amounts in adults, it is a potential therapeutic target for obesity.
Clinical Relevance
- Caloric restriction can reduce BMR disproportionately to fat-free mass loss (mediated by ↓ T3 conversion from T4 and ↓ sympathetic drive) — a key mechanism of weight-loss plateau
- Overfeeding transiently raises BMR slightly above expected for lean mass
- BMR ranges from <1200 to >3000 kcal/day among sedentary adults; ~80% of this variability is explained by lean vs. fat tissue composition
- Clinical measurement: Portable indirect calorimetry is used in hospitalized patients requiring precise energy needs (e.g., ICU nutrition planning)
Sources: Guyton and Hall Textbook of Medical Physiology; Basic Medical Biochemistry: A Clinical Approach, 6e; Goldman-Cecil Medicine
Basal metabolic rate. Pleural Cavity & intrapleural pressure. total body water, avenues by which water leaves and enters body, types of body fluids general principles of fluid balance how body fluids maintain Homeostasis, Electrolytes & ions Function of electrolytes, how electrolyte imbalance leads to fluid imbalance. Different in each topics
Running all searches in parallel across topics.
Finding Sources
Finding Sources
Finding Sources
Finding Sources
Finding Sources
Finding Sources
Finding Sources
Finding Sources
Finding Sources
Finding Sources
Finding Sources
I have excellent source locations. Now reading the key sections in parallel.
Reading File
Reading File
Reading File
Reading File
Reading File
Reading File
Reading File
Reading File
Reading File
Reading File
Reading File
I now have all the content needed. Let me fetch the key diagrams.
Loading Image
Loading Image
Topic 1 — Basal Metabolic Rate (BMR)
Definition
BMR is the minimum energy expenditure required to sustain life at complete rest — covering the energy cost of cardiac pumping, respiration, renal filtration, neuronal activity, membrane ion gradients, and biochemical pathway function. It is measured under strict conditions: awake but completely at rest, thermoneutral environment (68–80°F), after 12–18 hours of fasting, following a night of sleep, with no strenuous prior activity.
The Resting Metabolic Rate (RMR) or Resting Energy Expenditure (REE) is a practical clinical proxy — measured after waking rather than during sleep. It is numerically slightly higher than BMR. They are often used interchangeably.
BMR Within Total Daily Energy Expenditure
| Component | Contribution |
|---|---|
| BMR / Resting energy | 50–70% (sedentary) |
| Thermic effect of food | ~8% |
| Physical activity | ~32% |
For most sedentary adults, BMR ranges from <1,200 to >3,000 kcal/day. About 80% of this variability is explained by lean vs. fat tissue composition.
Standard Measurement Conditions
- No food for ≥12 hours
- After a restful night's sleep
- No strenuous activity ≥1 hour before
- Psychological rest — no excitement
- Room temperature 68–80°F (20–27°C)
- No physical activity during the test
Normal value: ~65–70 Cal/hour in a 70-kg adult man.
How BMR Is Measured
| Method | Detail |
|---|---|
| Direct calorimetry | Measures heat produced directly |
| Indirect calorimetry | Measures O₂ consumed + CO₂ produced → respiratory quotient (RQ) |
| O₂ consumption only | Simpler, portable, slightly less accurate; used in ICU |
| Predictive equations | Height, weight, age, sex → accurate ±10% in ~90% of adults with BMI 18.5–45 |
Respiratory Quotient (RQ) = CO₂ produced ÷ O₂ consumed:
- Carbohydrate oxidation: RQ = 1.00
- Protein oxidation: RQ = 0.83
- Fat oxidation: RQ = 0.71
Estimating BMR — Mifflin–St. Jeor Equation
| Sex | Formula |
|---|---|
| Males | (10 × W) + (6.25 × H) − (5 × A) + 5 |
| Females | (10 × W) + (6.25 × H) − (5 × A) − 161 |
W = kg, H = cm, A = years → result in kcal/day
Quick estimate:
- Men: ~1 kcal/kg/hr
- Women: ~0.9 kcal/kg/hr
Fat-free mass (FFM)-based formula: BMR = 186 + (23.6 × FFM in kg) kcal/day — eliminates sex and age differences due to adiposity.
Factors That Alter BMR
| Factor | Effect | Mechanism |
|---|---|---|
| Lean/skeletal muscle mass | ↑ BMR | Muscle = 20–30% of resting BMR |
| Male sex | ↑ ~10% vs females | Higher muscle, lower adipose |
| Age | ↓ progressively | Muscle loss, fat gain |
| Thyroid hormones ↑ | ↑ BMR 50–100% | Uncoupling futile cycles |
| Thyroid hormones ↓ | ↓ BMR 40–50% | Reduced cellular metabolism |
| Testosterone | ↑ 10–15% | Anabolic effect on muscle |
| Growth hormone | ↑ ~20% (GH-deficient adults) | Cellular metabolism + muscle mass |
| Fever | ↑ ~10–12% per °C | Accelerated chemical reactions |
| Sleep | ↓ 10–15% | ↓ muscle tone + CNS activity |
| Malnutrition | ↓ 20–30% | Paucity of cellular substrates |
| Pregnancy/lactation | ↑ | Increased metabolic demands |
| Cold environment | ↑ slightly | Thermogenesis activated |
| Genetics | ±10% variation | Inter-individual differences |
| Energy-restricted diet | ↓ disproportionately | ↓ T3 production, ↓ sympathetic drive |
BMR vs. Age
Brown Adipose Tissue — Thermogenic Special Case
Brown fat expresses uncoupling protein-1 (UCP-1), creating a proton leak across the inner mitochondrial membrane. This generates heat rather than ATP — a process called non-shivering thermogenesis. Though present in small amounts in adults, brown fat is detectable by ¹⁸F-FDG PET during cold exposure and is a potential therapeutic target for obesity.
Topic 2 — Pleural Cavity & Intrapleural Pressure
The Pleural Cavity
The pleural cavity (intrapleural space) is the thin, fluid-filled potential space between the visceral pleura (covering the lungs) and the parietal pleura (lining the chest wall and diaphragm). It contains only a small amount of serous fluid (~5–15 mL) that lubricates the surfaces, allowing the lung to slide freely during breathing.
Key structural points:
- The visceral and parietal layers are continuous, forming a closed sac
- The space is airtight; any breach (pneumothorax) disrupts the pressure dynamics required for breathing
- The pleural fluid is a transudative filtrate of plasma maintained at near-zero net volume by lymphatic drainage
Intrapleural Pressure — The Driving Force of Breathing
Intrapleural pressure arises from the opposing recoil forces of two structures:
- The lung has a natural tendency to collapse inward (elastic recoil of alveoli + surface tension)
- The chest wall has a natural tendency to spring outward
These two opposing forces pull the pleural layers apart, creating a subatmospheric (negative) pressure within the intrapleural space.
Intrapleural Pressure Through the Breathing Cycle
| Phase | Alveolar Pressure | Intrapleural Pressure | Transmural Pressure (Alveolar − Intrapleural) | Air Flow |
|---|---|---|---|---|
| Rest (FRC) | 0 cm H₂O | −5 cm H₂O | +5 cm H₂O (lungs open) | None |
| Mid-inspiration | −1 cm H₂O | −6 to −8 cm H₂O | +5 to +7 cm H₂O | Into lungs |
| End-inspiration | 0 cm H₂O | −8 cm H₂O | +8 cm H₂O | Ceases |
| Mid-expiration | +1 cm H₂O | −5 cm H₂O | +6 cm H₂O | Out of lungs |
Transmural pressure = Alveolar pressure − Intrapleural pressure. As long as transmural pressure is positive (expanding), the alveoli and airways remain open.
Why Intrapleural Pressure Is Negative
- Elastic recoil of the lung — alveolar walls and surfactant-depleted surfaces constantly pull inward
- Chest wall recoil — ribs and intercostal muscles pull outward
- Together, these create a virtual vacuum in the sealed intrapleural space
During inspiration:
- Diaphragm contracts → thoracic volume ↑
- Lung volume ↑ → elastic recoil ↑ → intrapleural pressure becomes more negative (−8 cm H₂O)
- Alveolar pressure drops below atmospheric → air flows in
During expiration (passive):
- Elastic recoil compresses alveolar air → alveolar pressure becomes +1 cm H₂O
- Air flows out; intrapleural pressure returns to −5 cm H₂O
During forced expiration:
- Expiratory muscles raise intrapleural pressure to +20 cm H₂O
- In emphysema, loss of elastic recoil means lower alveolar pressure → transmural pressure across large airways becomes negative → dynamic airway collapse
Clinical Significance
| Condition | Mechanism | Effect |
|---|---|---|
| Pneumothorax | Air enters intrapleural space | Intrapleural pressure → 0 (atmospheric); lung collapses |
| Tension pneumothorax | One-way valve effect — air only enters | Intrapleural pressure becomes positive; contralateral mediastinal shift |
| Pleural effusion | Fluid accumulates in pleural space | Compresses lung; reduces ventilation |
| PEEP (mechanical ventilation) | Positive airway pressure transmits into pleural space | Intrapleural pressure becomes less negative → ↓ venous return → ↓ cardiac output |
In pneumothorax, the negative intrapleural pressure is lost: "Each breath can increase intrapleural pressure, especially if the diameter of the chest wall wound approaches that of the trachea" — Roberts & Hedges' Clinical Procedures.
Topic 3 — Total Body Water, Avenues of Water Entry & Exit, Types of Body Fluids
Total Body Water (TBW)
TBW is the total amount of water contained within the body. It is proportional to lean body mass (fat is largely anhydrous).
| Population | TBW as % of Body Weight |
|---|---|
| Full-term neonate | ~70% |
| Infant (1 year) | ~65% |
| Adult male | ~60% |
| Adult female | ~55% (more adipose, less muscle) |
| Elderly | ↓ further (↑ fat, ↓ muscle) |
| Fetus | ~90% |
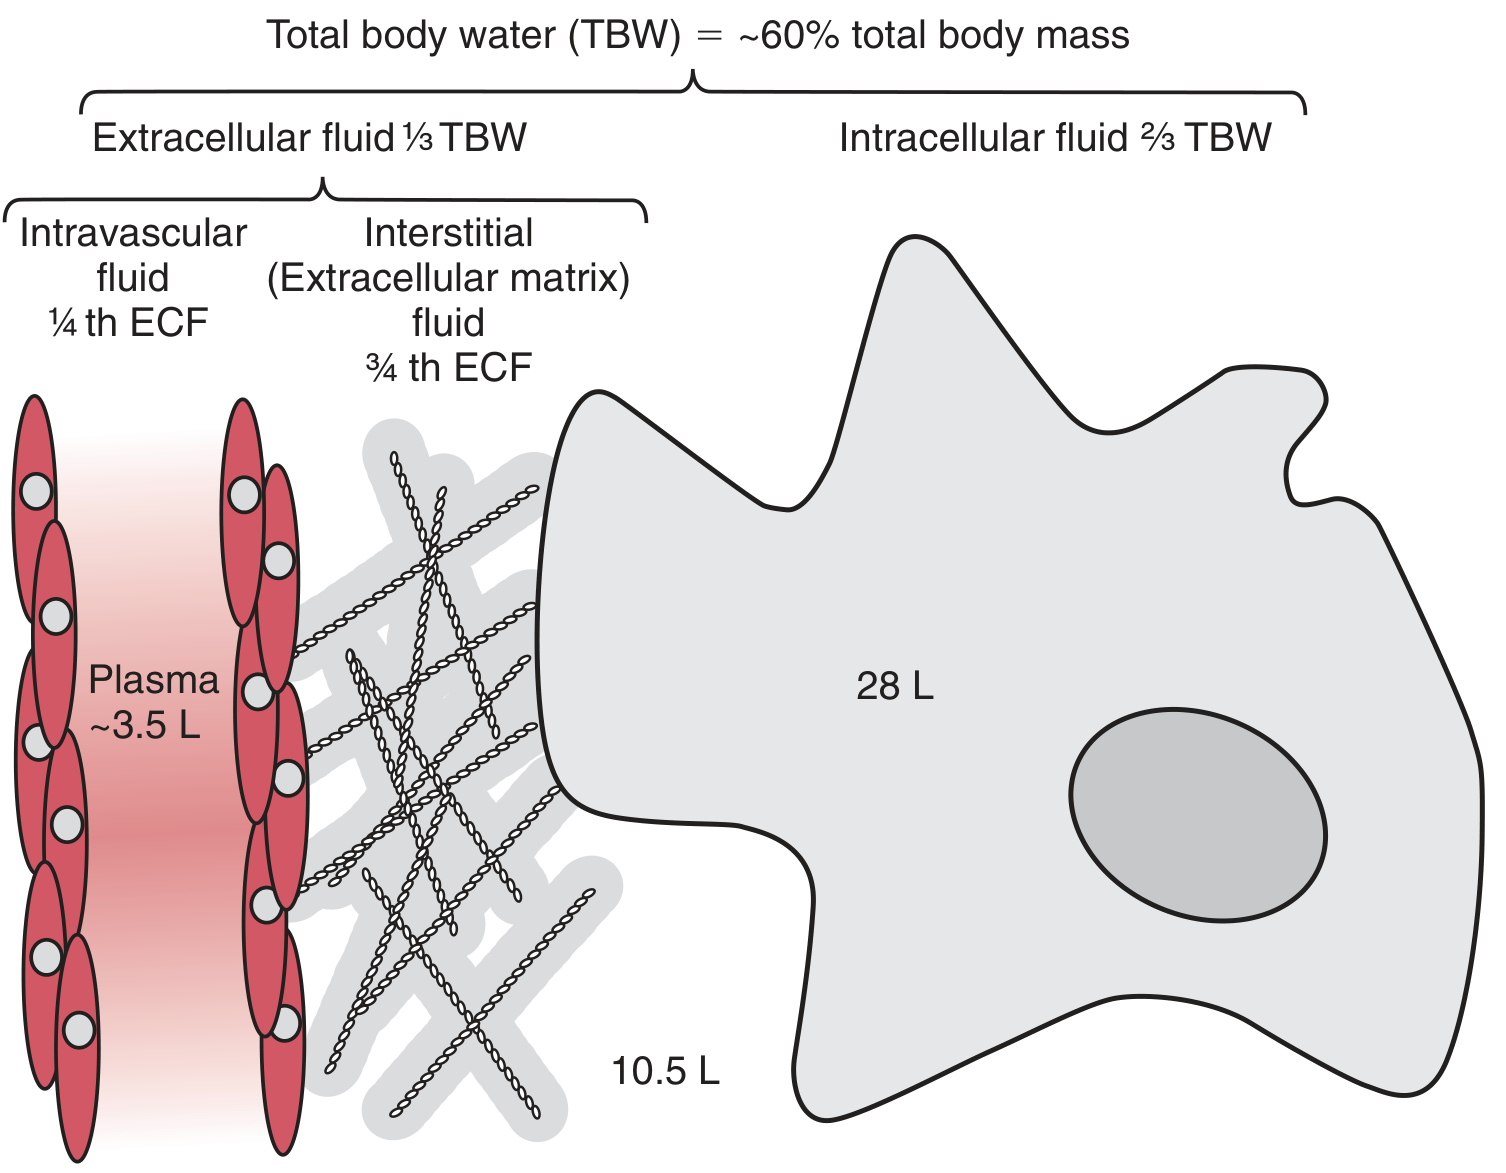
In a 70-kg man: TBW ≈ 42 L total.
Distribution — The Body Fluid Compartments
| Compartment | % of TBW | % of Body Weight | Volume (70-kg man) |
|---|---|---|---|
| Intracellular (ICF) | ~67% (2/3) | ~40% | ~28 L |
| Extracellular (ECF) | ~33% (1/3) | ~20% | ~14 L |
| — Interstitial fluid | ~75% of ECF (~25% TBW) | ~15% | ~10.5 L |
| — Intravascular (plasma) | ~25% of ECF (~8% TBW) | ~5% | ~3.5 L |
| — Transcellular* | ~4% TBW | ~2% | ~1–2 L |
Transcellular fluid includes cerebrospinal fluid (CSF), synovial fluid, pleural fluid, peritoneal fluid, intraocular fluid, GI secretions.
The ICF and ECF are separated by cell plasma membranes; the intravascular and interstitial spaces are separated by capillary endothelium.
Types of Body Fluids in Detail
1. Intracellular Fluid (ICF)
- 2/3 of TBW
- Dominant ions: K⁺ (140 mmol/L), Mg²⁺, organic phosphates, protein (16 g/dL)
- Provides the environment for energy production (ATP), cell repair, replication, and specialized cell functions
2. Extracellular Fluid (ECF)
- 1/3 of TBW — a bidirectional delivery system
- Delivers: glucose, fatty acids, amino acids, O₂, ions, hormones
- Removes: CO₂, metabolic waste, toxic byproducts
- Dominant ions: Na⁺ (140 mmol/L), Cl⁻ (100 mmol/L), HCO₃⁻ (27 mmol/L)
Sub-compartments of ECF:
| Sub-compartment | Key Feature |
|---|---|
| Plasma | Contains proteins (mainly albumin) that exert oncotic pressure; 5 L blood volume (3 L plasma) |
| Interstitial fluid | Essentially protein-free ultrafiltrate of plasma; bathes cells |
| Transcellular fluid | Secreted by epithelial cells; includes CSF, synovial, pleural, peritoneal, aqueous humour, GI secretions |
Ionic Composition of Body Fluid Compartments
| Ion | Plasma (mEq/L) | Interstitial (mEq/L) | Intracellular (mEq/L) |
|---|---|---|---|
| Na⁺ | 140 | 146 | 12 |
| K⁺ | 4 | 4 | 150 |
| Ca²⁺ | 5 | 3 | ~10⁻⁷ |
| Mg²⁺ | 2 | 1 | 7 |
| Cl⁻ | 103 | 114 | 3 |
| HCO₃⁻ | 27 | ~28 | 10 |
| PO₄³⁻ | ~2 | ~2 | 60 |
| Protein | 16 g/dL | trace | 16 g/dL |
The large difference in Na⁺ and K⁺ between ECF and ICF is maintained by the Na⁺/K⁺-ATPase pump (3 Na⁺ out, 2 K⁺ in per cycle).
Avenues by Which Water Enters the Body
| Route | Approximate Volume/Day |
|---|---|
| Drinking | 1,200–1,500 mL |
| Water in food | 700–1,000 mL |
| Metabolic water (oxidation of nutrients) | ~200–300 mL |
| Total intake | ~2,000–2,500 mL/day |
Avenues by Which Water Leaves the Body
| Route | Approximate Volume/Day | Notes |
|---|---|---|
| Urine | 1,200–1,500 mL | Primary regulated route (kidney) |
| Insensible skin evaporation | ~350–400 mL | Increases with fever, burns |
| Respiratory (expired air) | ~300–400 mL | Increases with hyperventilation, exercise |
| Feces | ~100–200 mL | ↑↑ in diarrhea |
| Sweat | Variable (~100 mL at rest → >1,000 mL/hr in exercise) | Hypotonic fluid |
| Total output | ~2,000–2,500 mL/day | Matches intake at balance |
Minimum daily water requirement ≈ 1.5–2.0 L/day to compensate for renal + insensible losses.
Topic 4 — General Principles of Fluid Balance & How Body Fluids Maintain Homeostasis
The Principle of Fluid Balance
Fluid balance = Water in = Water out over time. Homeostasis requires that daily intake (drinking + food + metabolic water) equals daily losses (urine + insensible + sweat + feces).
The body does not maintain total body water directly — it primarily maintains osmolality (concentration) and intravascular volume via overlapping, redundant mechanisms.
Osmosis and the Driving Force for Water Movement
Water moves across semipermeable membranes from areas of low solute concentration → high solute concentration (osmosis), driven by the osmotic pressure gradient. The body maintains equal osmolality (~285–295 mOsm/kg) across all fluid compartments.
When water is added to ECF:
- ECF osmolality ↓ transiently → water moves into cells → ICF expands, ECF shrinks back When water is lost from ECF:
- ECF osmolality ↑ → water moves from cells into ECF → ICF shrinks
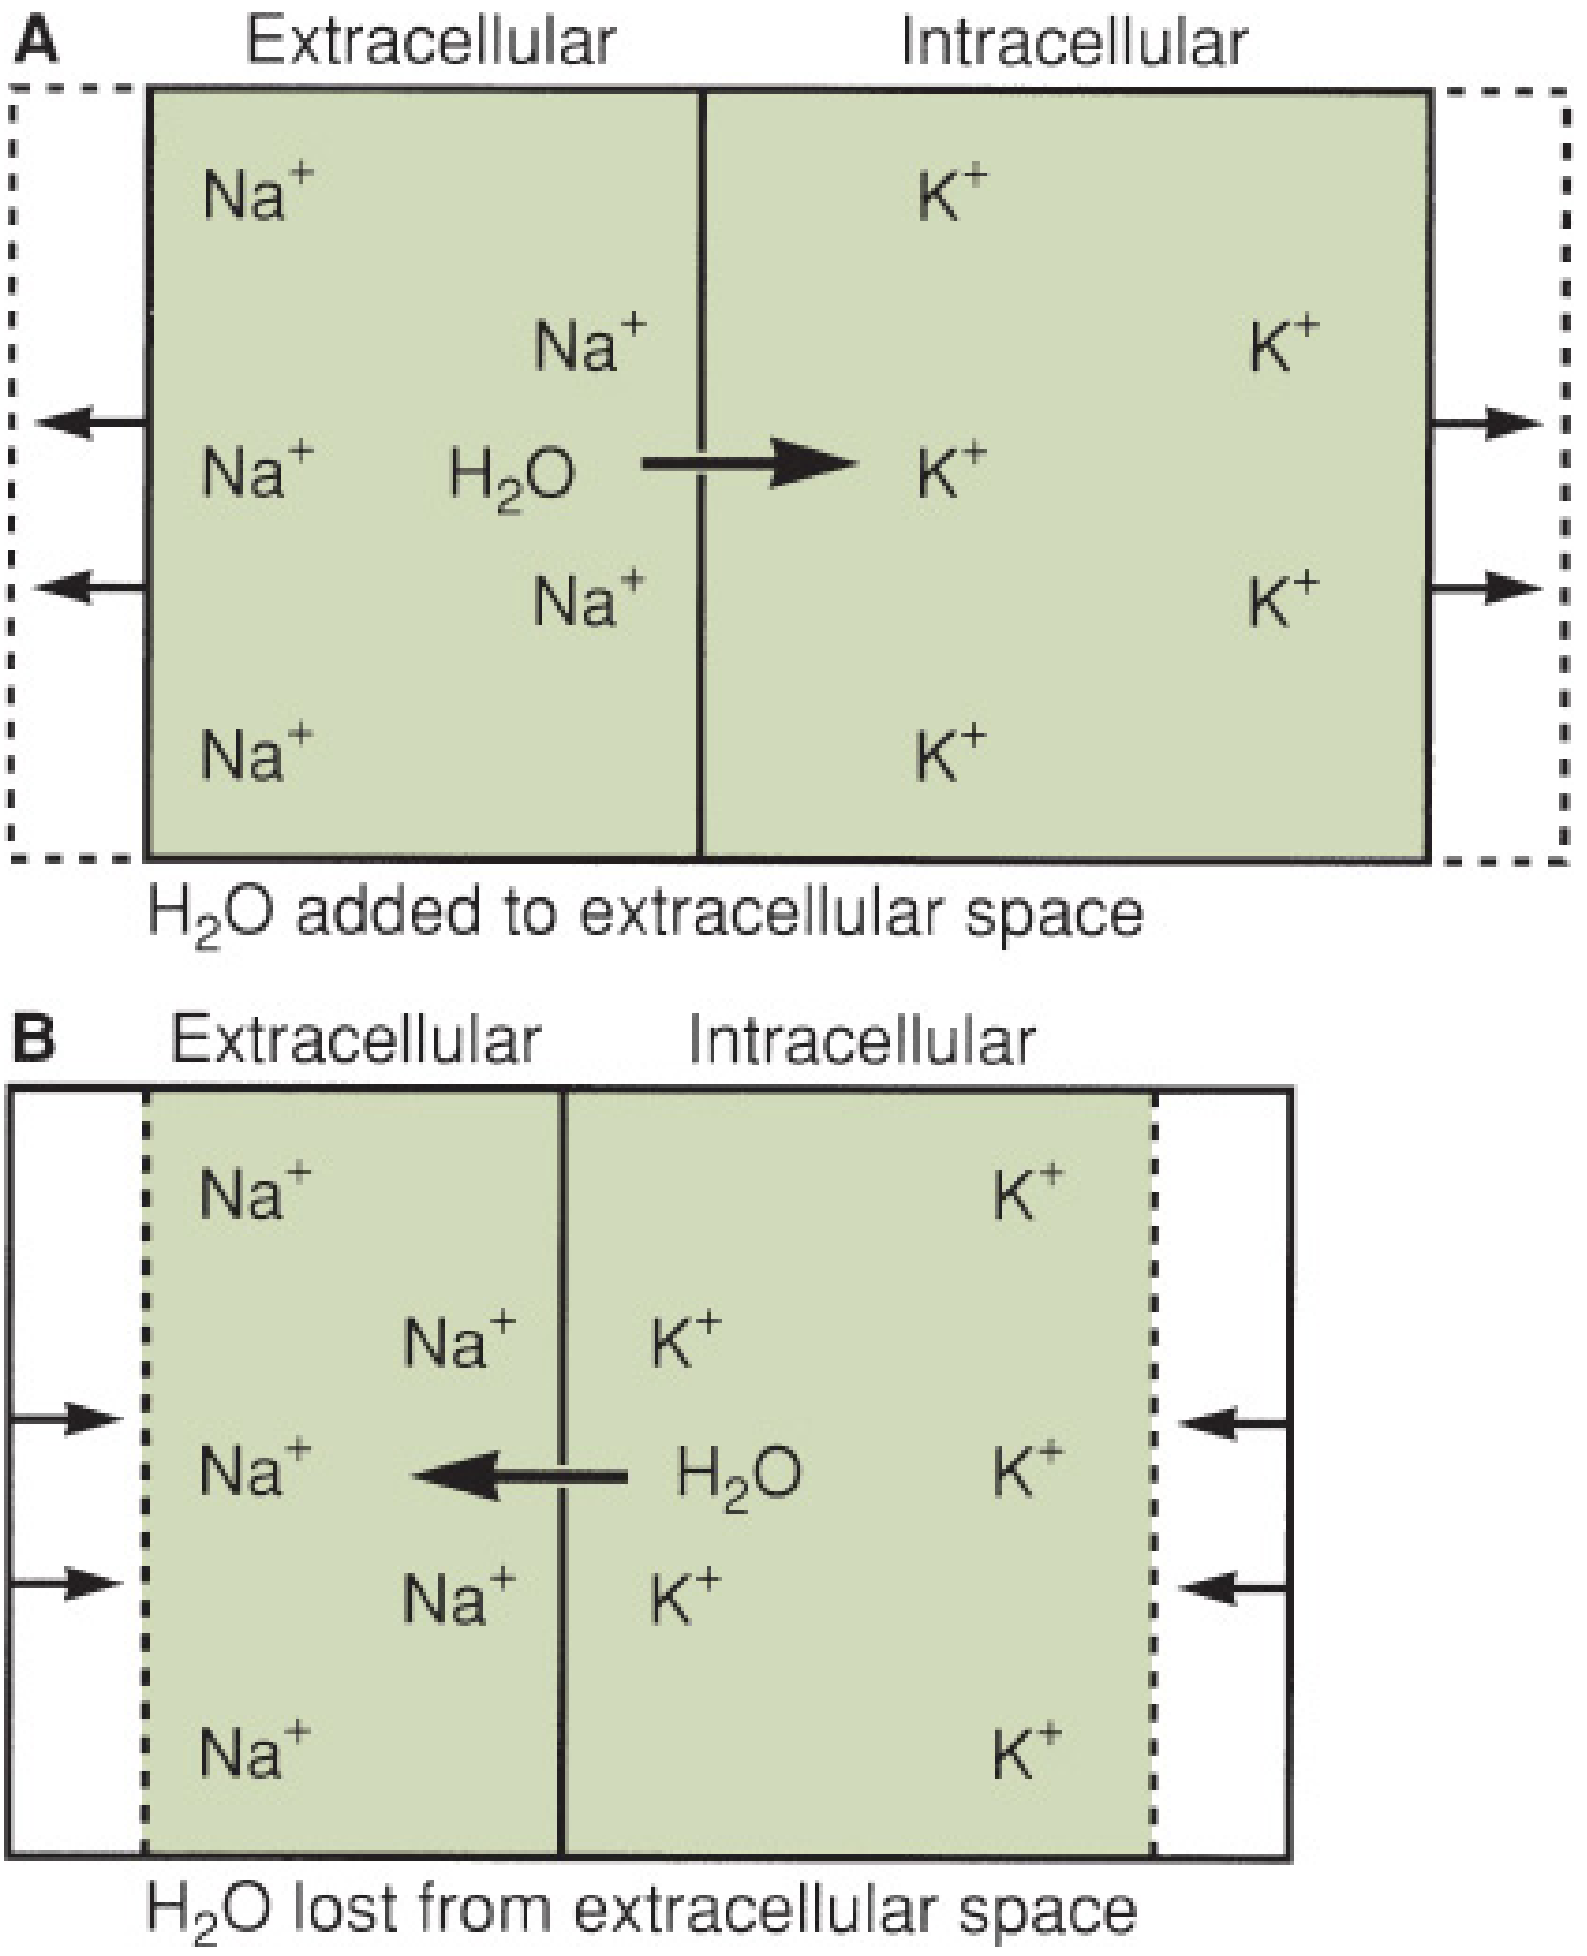
Key rule: Because cell membranes are freely permeable to water, imbalances in TBW are initially reflected in the ECF — the ECF is the first compartment to expand or contract.
The Gibbs-Donnan Equilibrium
When impermeable large anions (proteins, phosphates) are confined within the ICF, they attract cations inward and repel anions outward. This creates an uneven but electrically neutral distribution of diffusible ions across the membrane — called the Gibbs-Donnan equilibrium. This is why:
- ICF has high K⁺, Mg²⁺, protein, PO₄³⁻
- ECF has high Na⁺, Cl⁻, HCO₃⁻
- CSF has ~15% higher Cl⁻ than plasma (due to near-absence of protein in CSF)
Starling Forces — Fluid Exchange at the Capillary
Fluid movement between the intravascular and interstitial compartments is governed by Starling forces:
| Force | Direction | Effect |
|---|---|---|
| Capillary hydrostatic pressure (Pc) | Out of vessel | Filtration → interstitium |
| Plasma oncotic pressure (πc) | Into vessel | Reabsorption → plasma |
| Interstitial hydrostatic pressure (Pi) | Into vessel | Opposes filtration |
| Interstitial oncotic pressure (πi) | Out of vessel | Promotes filtration |
Net filtration pressure = (Pc − Pi) − (πc − πi)
At the arterial end of capillaries: hydrostatic pressure dominates → net filtration into interstitium
At the venous end: oncotic pressure dominates → net reabsorption
Excess interstitial fluid is returned via the lymphatic system.
Homeostatic Regulatory Mechanisms
1. Antidiuretic Hormone (ADH / Vasopressin)
- Released by posterior pituitary in response to: ↑ plasma osmolality (via hypothalamic osmoreceptors) or ↓ blood volume (via baroreceptors in aortic arch)
- Action: ↑ water permeability of collecting ducts via aquaporins → water reabsorption → ↓ urine output → ↓ osmolality restored
- Suppressed when ECF volume ↑ or osmolality ↓ → ↑ water excretion (diuresis)
2. Renin–Angiotensin–Aldosterone System (RAAS)
- Triggered by: ↓ renal perfusion, ↓ Na⁺ delivery to macula densa, β-adrenergic stimulation
- Renin (from juxtaglomerular cells) → Angiotensin II → Aldosterone (adrenal cortex)
- Aldosterone: stimulates cortical collecting duct → ↑ Na⁺ reabsorption + ↑ K⁺ excretion → water follows Na⁺ passively → ↑ ECF volume
3. Thirst Mechanism
- Hypothalamic osmoreceptors and baroreceptors stimulate thirst when plasma osmolality ↑ or blood volume ↓
- The only behavioral mechanism for restoring water balance
4. Renal Tubular Handling of Na⁺/H₂O
| Segment | Process |
|---|---|
| Proximal tubule | 70–80% of filtered Na⁺ reabsorbed; Cl⁻ and H₂O follow passively |
| Descending Loop of Henle | Water reabsorption (not electrolytes) — driven by medullary hypertonicity |
| Ascending Loop of Henle | Cl⁻ actively reabsorbed; Na⁺ follows |
| Distal tubule + collecting duct | Aldosterone → Na⁺ reabsorption; ADH → H₂O reabsorption |
5. Atrial Natriuretic Peptide (ANP)
- Released by cardiac atria when stretched (↑ blood volume)
- Opposes aldosterone: ↑ Na⁺ and water excretion → ↓ blood volume
Topic 5 — Electrolytes & Ions: Functions and How Imbalance Causes Fluid Imbalance
What Are Electrolytes?
Electrolytes are ions in body fluids that carry electrical charge and regulate fluid distribution, membrane potential, nerve conduction, muscle contraction, and acid-base balance.
Major cations: Na⁺, K⁺, Ca²⁺, Mg²⁺
Major anions: Cl⁻, HCO₃⁻, HPO₄²⁻, SO₄²⁻, protein
Functions of Key Electrolytes
Sodium (Na⁺) — The Master of ECF Volume
- Major ECF cation (140 mEq/L ECF vs. 12 mEq/L ICF)
- Determines ECF osmolality and volume
- Regulates water distribution between ECF and ICF
- Essential for nerve impulse generation (action potentials) and muscle contraction
- Transported by Na⁺/K⁺-ATPase (3 Na⁺ out, 2 K⁺ in per cycle) — the engine of cellular homeostasis
- Regulated by aldosterone, ADH, ANP, RAAS
Imbalance → fluid imbalance:
- Hyponatremia (Na⁺ <135 mEq/L): ECF osmolality ↓ → water shifts into cells → cerebral edema, seizures, coma
- Hypernatremia (Na⁺ >145 mEq/L): ECF osmolality ↑ → water shifts out of cells → cell shrinkage → neurological dysfunction, hyperreflexia, altered consciousness
Potassium (K⁺) — Master of ICF Volume & Membrane Potential
- Major ICF cation (150 mEq/L ICF vs. 4 mEq/L ECF)
- Critical for resting membrane potential of all excitable cells
- Regulates cellular volume and intracellular osmolality
- Co-transported with Na⁺ by Na⁺/K⁺-ATPase
Imbalance → fluid imbalance:
- Hypokalemia (K⁺ <3.5 mEq/L): Na⁺/K⁺-ATPase activity ↓ → Na⁺ accumulates in cells → cellular swelling; muscle weakness, cardiac arrhythmias (flattened T-waves, U-waves)
- Hyperkalemia (K⁺ >5.0 mEq/L): Membrane depolarization → muscle weakness, life-threatening arrhythmias (peaked T-waves, VF); ICF water may shift out
Chloride (Cl⁻) — Anion Balance and ECF Tonicity
- Follows Na⁺ passively in renal tubules
- Major contributor to ECF osmolality and electrical neutrality
- Essential for HCl production (gastric acid)
- Participates in the chloride shift during CO₂ transport
Imbalance → fluid imbalance:
- Hypochloremia (e.g., from vomiting): ↑ HCO₃⁻ compensatorily → metabolic alkalosis → kidneys retain Na⁺ to preserve neutrality → fluid retention
- Hyperchloremia: ↑ ECF osmolality → water drawn from cells
Bicarbonate (HCO₃⁻) — Acid-Base Buffer
- Primary buffer of blood and ECF (normal: 22–26 mEq/L)
- Reciprocal relationship with Cl⁻ (Gibbs-Donnan and chloride shift)
- Disorders of HCO₃⁻ alter ECF pH which influences protein structure and ion transport
Calcium (Ca²⁺) — Signaling and Membrane Stability
- 99% in bone; ECF free Ca²⁺ = ~2.5 mmol/L; ICF free Ca²⁺ = ~0.1 μmol/L (100,000-fold gradient)
- Functions: neuromuscular transmission, cardiac conduction, coagulation cascade, exocytosis, muscle contraction
- Regulated by PTH, calcitonin, vitamin D
Imbalance → fluid imbalance:
- Hypocalcemia: ↑ membrane excitability → tetany, seizures; disrupts Na⁺ channel function → affects fluid transport
- Hypercalcemia: nephrogenic diabetes insipidus (ADH-resistant) → polyuria → dehydration → ECF volume depletion
Magnesium (Mg²⁺) — Cofactor and Pump Activator
- Second most abundant ICF cation (30 mmol/L ICF vs. 1.5 mmol/L ECF)
- Required cofactor for Na⁺/K⁺-ATPase and Ca²⁺-ATPase
- Stabilizes RNA, DNA; activates >300 enzyme systems
Imbalance → fluid imbalance:
- Hypomagnesemia: Na⁺/K⁺-ATPase fails → intracellular Na⁺ ↑ and K⁺ ↓ → cellular swelling and concurrent hypokalemia (refractory to K⁺ replacement)
- Often coexists with and amplifies other electrolyte imbalances
Phosphate (HPO₄²⁻) — ICF Structural and Energy Anion
- Major ICF anion (60 mEq/L ICF vs. 2 mEq/L ECF)
- Key role: ATP synthesis, DNA/RNA structure, intracellular signaling, red cell 2,3-DPG
Summary: How Electrolyte Imbalance Leads to Fluid Imbalance
The central principle: water follows osmolality. Since electrolytes (especially Na⁺ and K⁺) are the dominant determinants of compartment osmolality, their imbalance directly drives water between compartments.
| Electrolyte Imbalance | Osmotic Consequence | Fluid Shift | Clinical Result |
|---|---|---|---|
| ↓ Na⁺ (hyponatremia) | ↓ ECF osmolality | Water → ICF | Cerebral edema, cell swelling |
| ↑ Na⁺ (hypernatremia) | ↑ ECF osmolality | Water → ECF | Cell shrinkage, brain dehydration |
| ↓ K⁺ (hypokalemia) | ICF loses osmoles | Water → ECF | ICF shrinkage; polyuria |
| ↑ K⁺ (hyperkalemia) | ICF gains osmoles | Water → ICF | Cell swelling |
| ↓ Ca²⁺ (hypocalcemia) | ADH-independent DI | Unable to concentrate urine | ECF volume depletion |
| ↑ Ca²⁺ (hypercalcemia) | Nephrogenic DI | Polyuria | Dehydration, ↓ ECF |
| ↓ Mg²⁺ | Na⁺/K⁺-ATPase failure | ICF Na⁺↑, K⁺↓ → cell swelling | Concurrent hypokalemia, edema |
The kidney is the central organ orchestrating electrolyte and fluid homeostasis — integrating signals from aldosterone (Na⁺ retention), ADH (water retention), ANP (Na⁺ excretion), and PTH (Ca²⁺/PO₄ balance) to keep all compartments within narrow physiological bounds.
Sources: Guyton and Hall Textbook of Medical Physiology; Costanzo Physiology 7e; Tietz Textbook of Laboratory Medicine, 7e; Harper's Illustrated Biochemistry, 32e; Mulholland & Greenfield's Surgery, 7e; Basic Medical Biochemistry: A Clinical Approach, 6e; Goldman-Cecil MedicineYour credits are exhausted. Your daily credits reset tomorrow, or you can purchase a top-up for more.
Simple word mein samjhaye different
Your credits are exhausted. Your daily credits reset tomorrow, or you can purchase a top-up for more.
This is a shared conversation. Sign in to Orris to start your own chat.