
Speculed tracking 2d echo interpretation
Reading File
Speckle Tracking Echocardiography (STE) is a 2D echo technique that tracks natural acoustic markers (speckles) in myocardial tissue frame-by-frame to quantify myocardial deformation (strain). It's vendor-independent and provides objective assessment of cardiac mechanics.
Searching sources...
Finding Sources
Searching PubMed
speckle tracking echocardiography strain interpretation
Finding Sources
Finding Sources
Searching PubMed
speckle tracking echocardiography global longitudinal strain
Good - found the key textbook section. Let me read the detailed content.
Reading File
Reading File
Reading File
Reading File
Reading File
Finding Sources
Reading File
Reading File
Now let me fetch a couple of key images and get the RV strain data:
Loading Image
Reading File
Loading Image
Loading Image
Excellent - I now have comprehensive material to write a detailed response. Let me compile everything.
Speckle Tracking 2D Echocardiography (STE) - Interpretation Guide
1. What is Speckle Tracking?
Speckle tracking echocardiography (STE) uses the 2D gray-scale image to track natural acoustic markers called speckles - bright spots created by interference patterns from backscattered ultrasound signals from myocardial microstructures (smaller than one wavelength). The system tracks these speckles frame-by-frame throughout the cardiac cycle and calculates the distance between defined myocardial regions, plotting how that distance changes over time.
Strain = (Change in length) / (Original length) - expressed as a percentage
Strain rate = First derivative of the strain-vs-time curve (rate of deformation)
2. Advantages over Tissue Doppler Imaging
| Feature | Speckle Tracking | Tissue Doppler |
|---|---|---|
| Angle dependence | None (angle-independent) | Angle-dependent |
| Data acquisition | Simpler | More complex |
| Strain measurement | Direct | Calculated from velocity |
| Simultaneous measurements | Multiple segments at once | Limited |
| Post-processing | Offline analysis possible | Real-time acquisition required |
3. Planes and Types of Strain
From different echo views, STE measures three directional components:
| Strain Type | View | Direction | Normal Range |
|---|---|---|---|
| Longitudinal | Apical (2CH, 4CH, 3CH long-axis) | Base-to-apex shortening | -18 to -20% or more negative |
| Circumferential | Parasternal short-axis | Circumferential shortening | -28 to -39% |
| Radial | Parasternal short-axis | Wall thickening | +40 to +50% |
The most clinically validated and widely used is Global Longitudinal Strain (GLS).
4. Normal Values (WASE Study, 2022)
From the Textbook of Clinical Echocardiography (3D-derived reference):
| Parameter | Men (LLN to ULN) | Women (LLN to ULN) |
|---|---|---|
| LV GLS | -18.7% to -26.4% | -20.0% to -27.0% |
| LV GCS | -28.3% to -38.7% | -29.5% to -39.4% |
| LVEF | 51%-63.2% | 53.1%-65.2% |
Rule of thumb (2D STE): GLS of -20% or more negative = normal systolic function. Values closer to zero (less negative) indicate impaired function. Note that normal values are vendor-specific; a value of around -20% is widely accepted as the threshold.
- Textbook of Clinical Echocardiography, Table A-4
5. The Bulls-Eye (17-Segment) Plot
The most common display format is the "bulls-eye" polar map showing peak systolic strain per segment across the 17 LV segments:
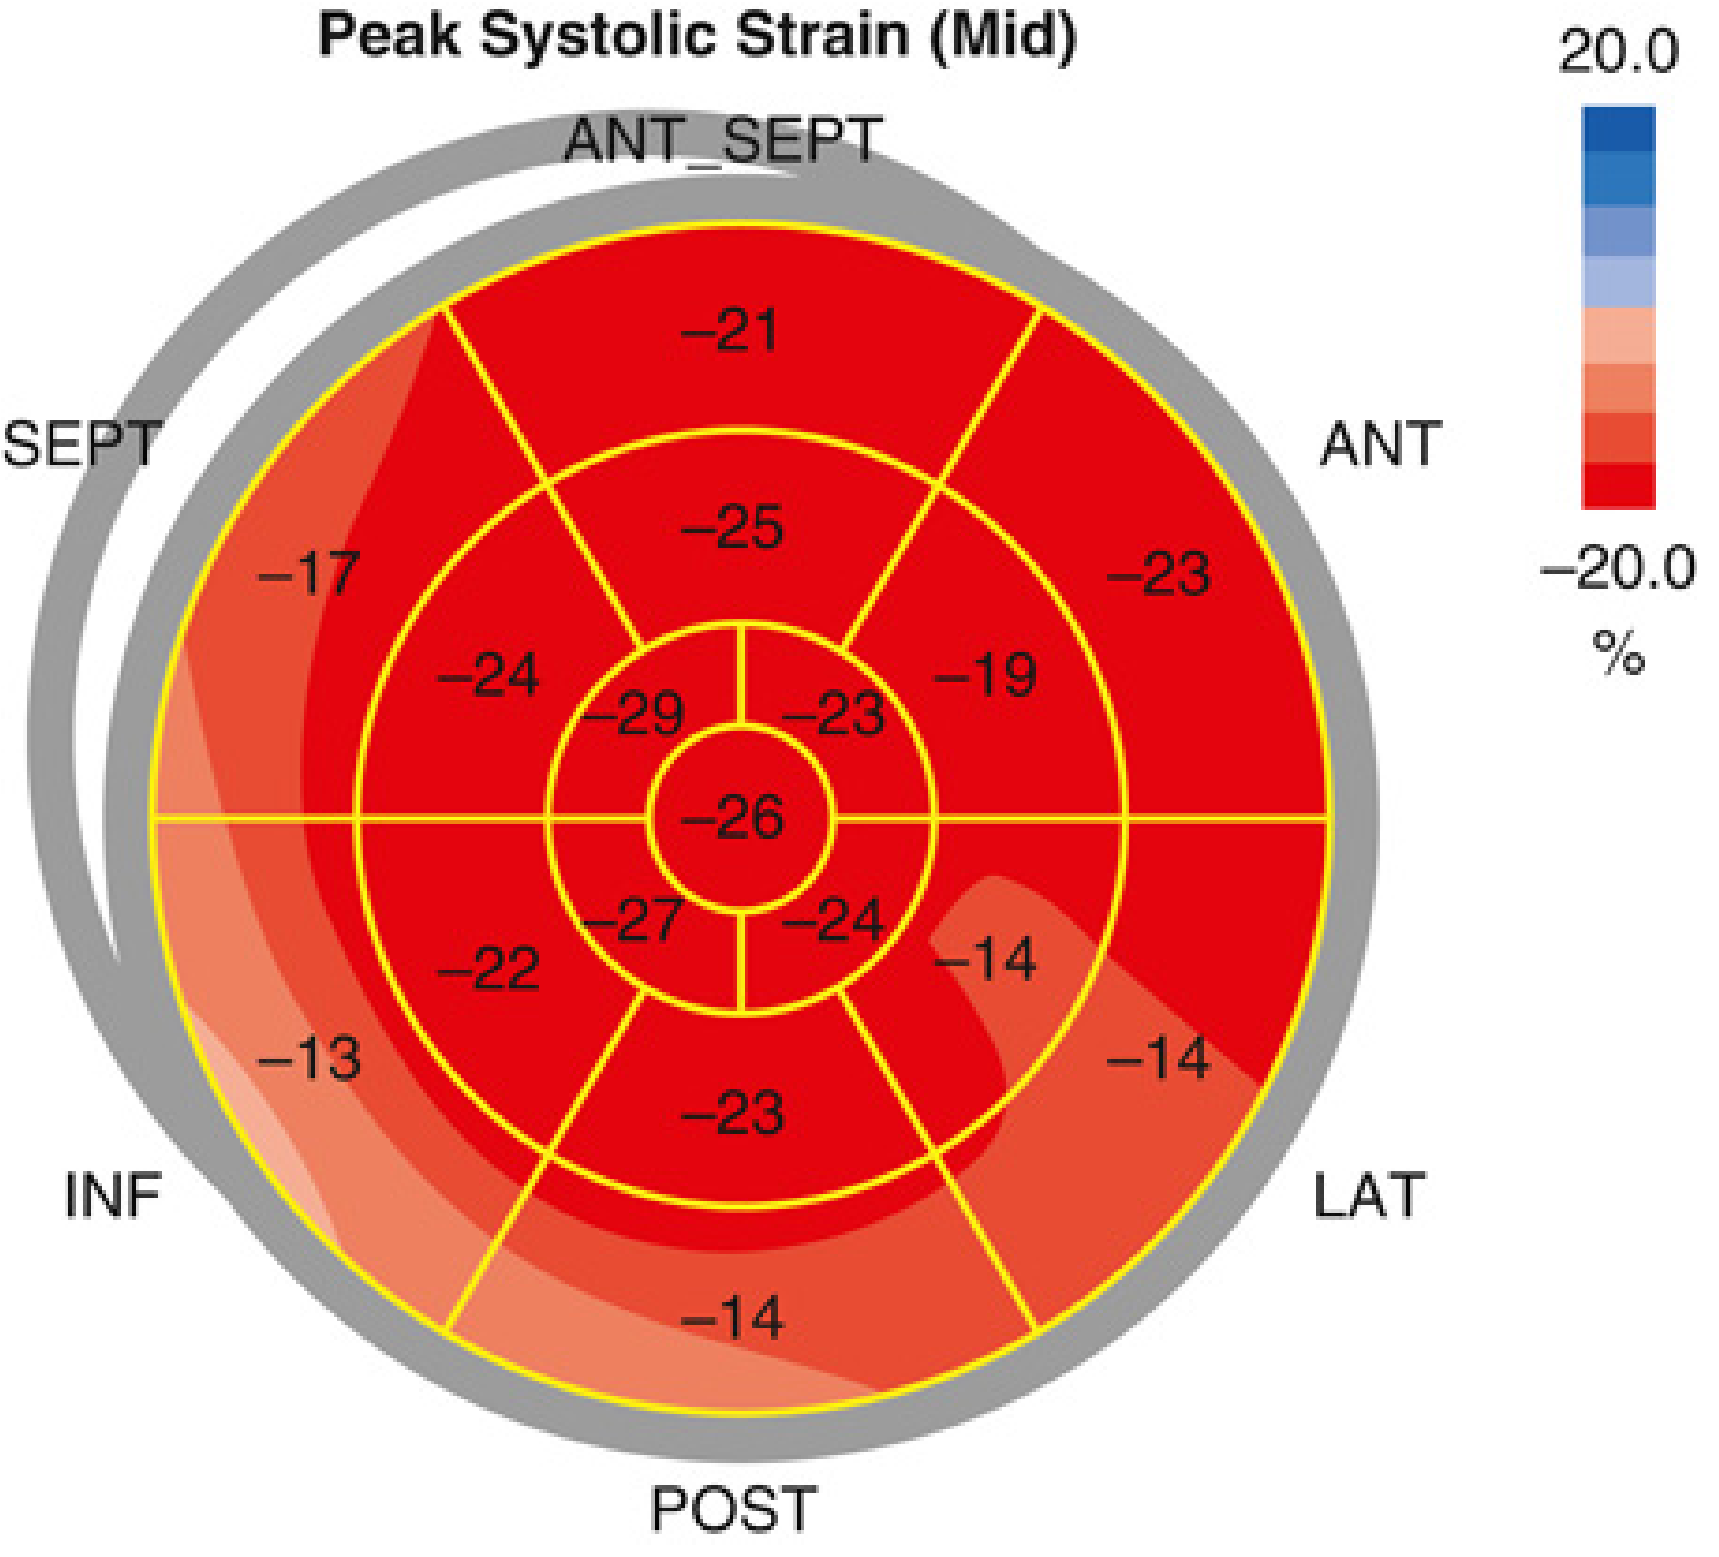
- Dark red = normal strain (values around -20% to -26%)
- Light red / pink / white = reduced/abnormal strain
- The outer ring = basal segments; middle ring = mid segments; inner ring = apical segments
6. How to Interpret Strain Waveforms
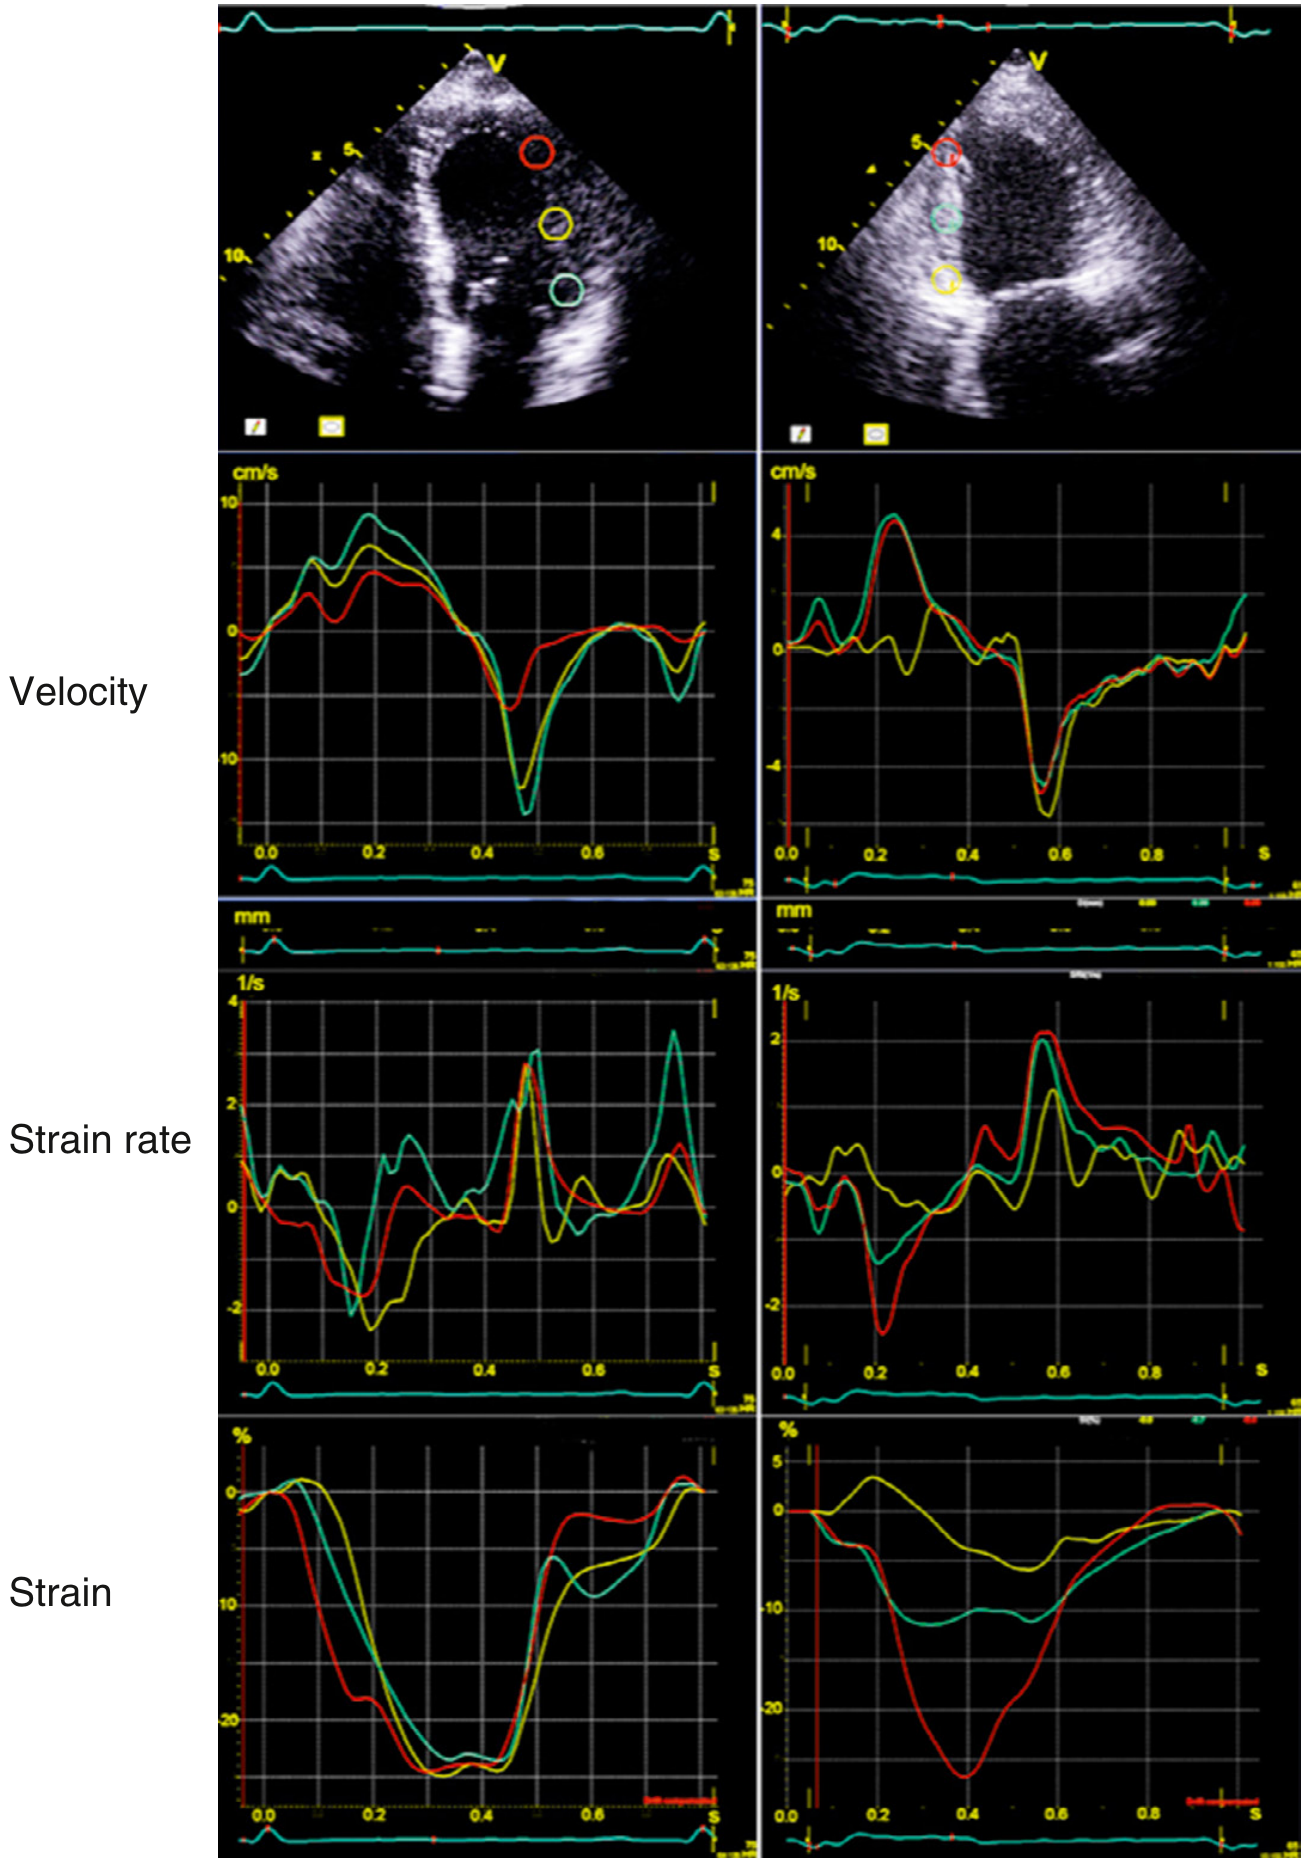
The typical longitudinal strain curve shows:
- Rapid decrease (negative) during systole (end-diastole to end-systole) = myocardial shortening
- Peak negative value at end-systole = peak systolic strain
- Rapid return toward zero in early diastole
- Small negative deflection in late diastole after atrial contraction (A wave)
In ischemic myocardium (right panel of image below):
- Reduced/absent negative strain in the affected territory
- Delayed or absent peak (post-systolic shortening is a hallmark of ischemia)
7. Key Clinical Applications
A. LV Systolic Function Assessment
- GLS detects subclinical LV dysfunction before LVEF drops - this is its most important clinical role
- A GLS less negative than -16% in the setting of preserved LVEF suggests subclinical cardiomyopathy
B. Cardio-Oncology (Chemotherapy Monitoring)
- A relative reduction in GLS >15% from baseline (e.g., from -21.6% to -17.0%) is an early marker of cardiotoxicity, even when LVEF remains normal
- Detects early cardiotoxicity from anthracyclines, trastuzumab, etc.
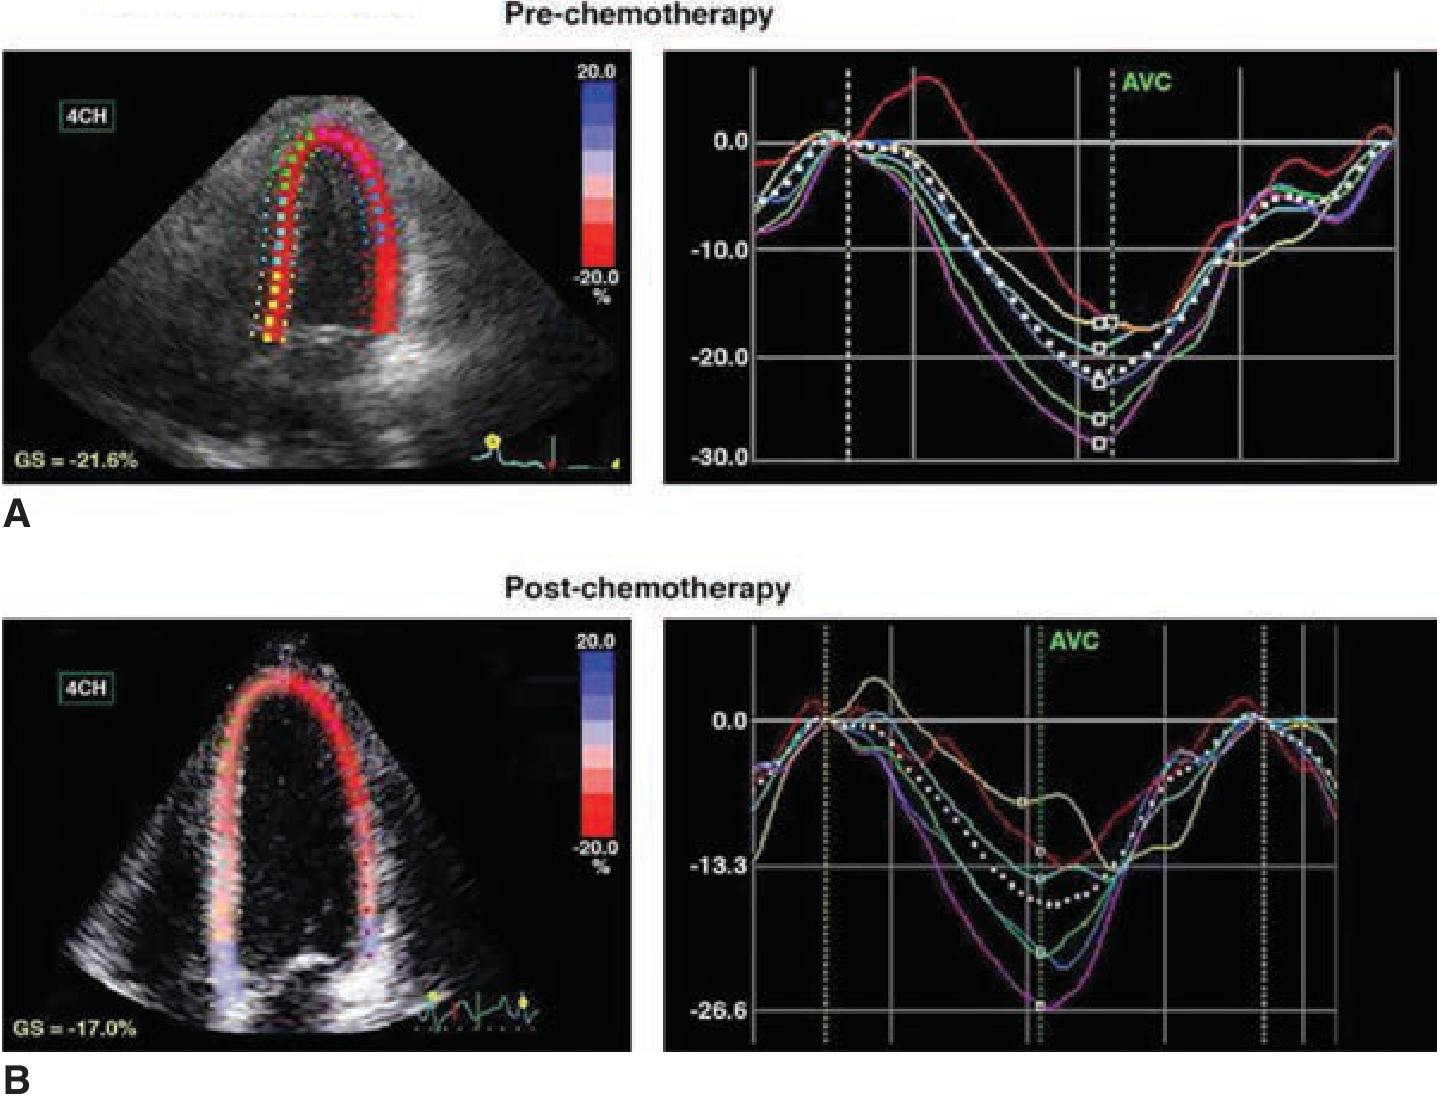
- Fuster and Hurst's The Heart, 15th Ed., Fig. 74-2
C. Differential Diagnosis of Cardiomyopathies
| Condition | Strain Pattern |
|---|---|
| Dilated cardiomyopathy | Diffuse global reduction in GLS |
| Amyloidosis | Apical sparing pattern - apical GLS preserved, basal GLS severely reduced (characteristic "cherry on top" bull's-eye) |
| Hypertrophic cardiomyopathy | Reduced GLS in hypertrophied segments, often basal septum |
| Myocardial ischemia | Regional abnormality in the territory of the affected coronary artery |
| LV non-compaction | Reduced GLS, especially in non-compacted layers |
| Restrictive cardiomyopathy | Abnormal longitudinal mechanics; circumferential and torsion patterns may help differentiate from constrictive pericarditis |
| Constrictive pericarditis | Abnormal circumferential deformation and torsion; longitudinal strain may be relatively preserved |
D. Dyssynchrony Assessment
- STE can quantify intraventricular dyssynchrony by measuring the time difference to peak negative strain across different segments
- Relevant for CRT (cardiac resynchronization therapy) candidacy and response evaluation
E. Diastolic Function
- Regional strain rate patterns can evaluate diastolic mechanics (impaired relaxation affects early diastolic strain rate)
- Reduced early diastolic strain rate is a marker of impaired LV relaxation
F. Right Ventricular (RV) Strain
- RV free wall longitudinal strain (RVFWLS) is emerging as a sensitive RV function parameter
- Normal RV free wall strain: typically more negative than -20% (vendor-specific)
- An RV free wall strain less negative than -20% suggests RV dysfunction (prognostic in pulmonary hypertension, PE, RV failure)
G. Myocardial Twist and Torsion
- The LV normally shows base rotating clockwise and apex counterclockwise (when viewed from apex)
- Torsion = the net wringing motion
- STE can quantify this; impaired untwisting in early diastole is a sensitive marker of diastolic dysfunction
8. Technical Requirements and Limitations
Acquisition tips:
- High frame rate required (50-90 fps for 2D STE)
- Good image quality with clear endocardial border definition
- Harmonic imaging improves speckle quality
- Avoid foreshortened views
- ECG gating is essential
Limitations:
- Vendor-specific software (values not directly interchangeable between platforms; correction factors exist but are imperfect)
- Frame rate dependence
- Poor acoustic window degrades tracking quality
- Motion artifacts (respiratory, probe movement)
- Algorithm may fail in very dilated or hypertrophied ventricles
- 2D STE is affected by out-of-plane motion (3D STE addresses this)
9. Practical Interpretation Checklist
- Check image quality - can you trace endocardial border cleanly?
- Review frame rate - ideally 50-90 fps
- Accept or reject segments - most software allows per-segment quality grading; use ≥14/16 acceptable segments for reliable GLS
- Look at the bulls-eye - identify regional vs global pattern
- GLS value - note whether more or less negative than -18% to -20%
- Compare to baseline - a relative drop >15% is clinically significant in serial monitoring
- Correlate with LVEF - reduced GLS with preserved EF = subclinical dysfunction
- Check strain curves - look for post-systolic shortening (ischemia pattern)
Recent Guideline Update (2025)
The ASE/EACVI published a Clinical Consensus Statement on Strain Echocardiography (Thomas JD et al., J Am Soc Echocardiogr, 2025 Nov - PMID: 40864001) consolidating clinical applications. The AHA Scientific Statement on STE (Mihos CG et al., Circulation, 2025 Sep - PMID: 40765507) also provides updated guidance on LV structure and function assessment. A comprehensive review of myocardial strain theory and practice was published in JACC Cardiovascular Imaging 2025 (PMID: 39269417).
Sources: Textbook of Clinical Echocardiography (Otto), p. 131-133; Fuster and Hurst's The Heart 15th Ed., pp. 2132-2133; Miller's Anesthesia 10th Ed., pp. 4998-5005; ASE/EACVI 2025 Consensus Statement.
This is a shared conversation. Sign in to Orris to start your own chat.