
Metabolic encephalopathy
"metabolic encephalopathy" AND diagnosis
metabolic encephalopathy causes diagnosis management
triphasic waves EEG metabolic encephalopathy
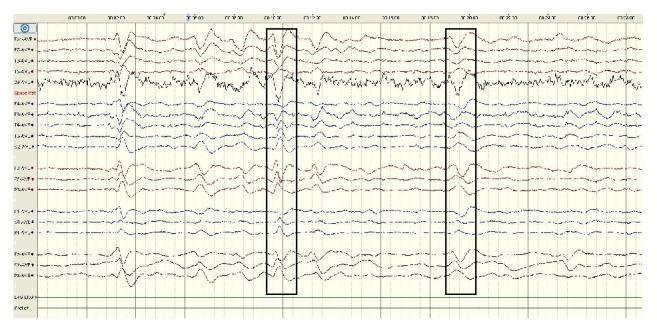
This diagnostic image shows a multi-channel electroencephalogram (EEG) recording demonstrating triphasic wave patterns, a hallmark of metabolic encephalopathy (such as hepatic or uremic encephalopathy). The recording displays multiple traces representing different anatomical brain regions. The highlighted waveforms exhibit a classic triphasic morphology: an initial sharp negative deflection, followed by a prominent, wider positive deflection, and concluding with a second negative deflection. These waves appear synchronously and periodically with a frequency of approximately 1.5–2 Hz and amplitudes typically exceeding 70 μV. Spatially, the triphasic waves are distributed diffusely across both hemispheres but show a characteristic anterior-to-posterior time lag and greater prominence in the frontal leads. The background activity is slowed, consistent with generalized cerebral dysfunction. This visual serves as a primary educational example for identifying EEG biomarkers of systemic metabolic derangement affecting the central nervous system.
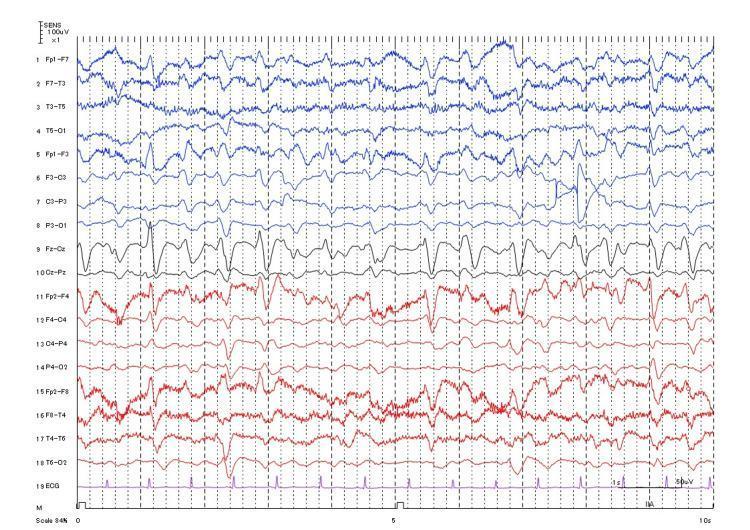
This diagnostic image is an electroencephalogram (EEG) recording with a simultaneous single-lead electrocardiogram (ECG) trace at the bottom (Channel 19). The EEG montage displays 18 channels of cortical activity, including frontal, temporal, parietal, and occipital regions (e.g., Fp1-F7, Fp2-F4, T6-O2). The tracing demonstrates generalized cerebral slowing characterized by high-amplitude, low-frequency delta and theta waveforms ranging between 150 to 200 μV. Prominent triphasic waves are visible across several channels, exhibiting a characteristic morphology with an initial sharp negative component followed by a larger positive deflection and a subsequent slow negative wave. These waveforms show bilateral synchrony and a discernible anterior-to-posterior time lag. The ECG channel shows a regular sinus rhythm with distinct QRS complexes, which is used for artifact identification. Such EEG patterns, particularly the generalized slowing and triphasic waves, are clinically significant markers of metabolic or toxic encephalopathy, such as antibiotic-associated encephalopathy (AAE).
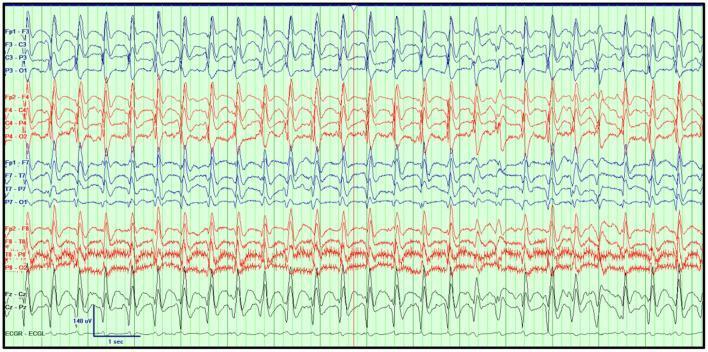
This diagnostic image displays a continuous electroencephalogram (EEG) tracing from a 52-year-old female patient, demonstrating Generalized Periodic Discharges (GPDs) with a classic triphasic morphology. The recording is presented in a longitudinal bipolar montage (10-20 system), showing activity across frontal, central, parietal, temporal, and occipital regions. The prominent triphasic waves occur at a frequency of approximately 1-2 Hz and are characterized by three phases: a low-amplitude negative deflection, a subsequent larger positive phase, and a high-amplitude negative terminal phase. A noticeable posterior-to-anterior gradient is present. The underlying background activity consists of diffuse, irregular delta and theta waves, indicative of encephalopathy. In this clinical context, these findings are consistent with toxic-metabolic encephalopathy, specifically associated here with chronic kidney disease, sepsis, and cefepime administration. Technical parameters include a low-frequency filter of 1 Hz, a high-frequency filter of 70 Hz, and a sensitivity of 7 μV/mm.
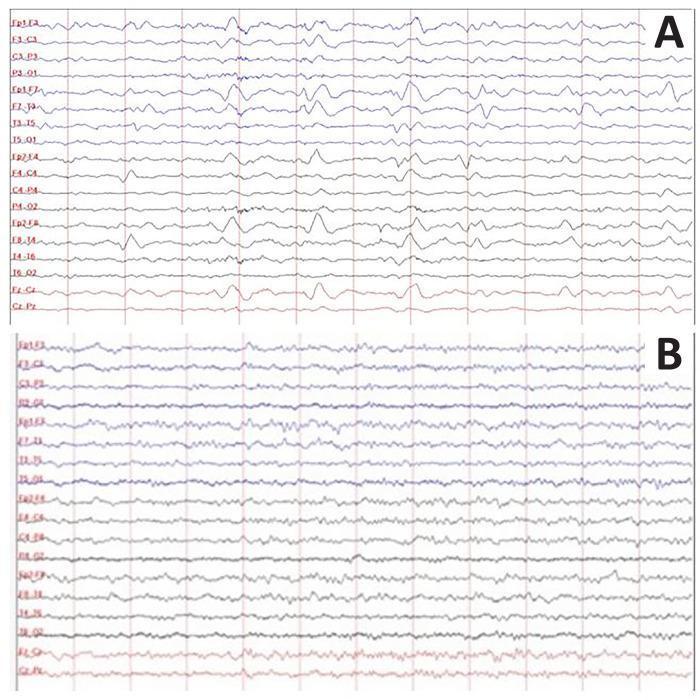
This diagnostic image displays a comparison of two standard electroencephalography (EEG) recordings from a clinical case involving metabolic encephalopathy. Panel A (Day 6) illustrates a Generalized Periodic Discharge (GPD) pattern. The waveforms exhibit a classic triphasic morphology characterized by high-amplitude, rhythmic discharges that are most prominent in the frontal channels (Fp1-F2, F3-C3). This pattern is indicative of toxic or metabolic brain dysfunction, such as hyperammonemia. Panel B (Day 12) shows a longitudinal follow-up after clinical intervention. There is a significant resolution of the GPDs; the EEG appears more attenuated and disorganized with a transition toward a continuous, lower-amplitude background activity. The contrast between panels A and B demonstrates the neurophysiological correlation of recovery following the management of hyperammonemia, transitioning from a severe encephalopathic pattern to a more normalized recording. This visualization is critical for teaching the identification of triphasic waves and monitoring the progression of metabolic brain injuries in critical care settings.
Metabolic Encephalopathy
Core Clinical Features
- Impaired consciousness with sleepiness/inattention is the hallmark. Patients typically show disorientation and inattentiveness that can progress in stages from confusion to stupor and coma - Plum and Posner's Diagnosis and Treatment of Stupor and Coma, p. 347.
- No focal neurological signs as a rule - asymmetric motor findings argue against a metabolic cause. Pupillary light reflexes are classically preserved even in deep encephalopathy, since the brainstem is relatively resistant, while higher cortical functions fail early - Localization in Clinical Neurology, 8e, p. 1449.
- Abnormal movements are characteristic and rarely accompany focal structural lesions:
- Tremor - coarse, irregular, 8-10 Hz, most evident with the arms outstretched
- Asterixis - sudden brief lapses of postural tone ("flapping tremor"), best elicited with wrists dorsiflexed and fingers extended; prominent in hepatic encephalopathy, wanes as coma deepens
- Myoclonus and, in some cases (hyponatremia, hyperosmolar states, eclampsia, malignant hypertension, acute intermittent porphyria), seizures
- EEG shows diffuse slowing of background rhythms proportional to severity, often with generalized periodic discharges/triphasic waves (classic for hepatic, uremic, and other toxic-metabolic encephalopathies).
- Imaging is usually normal, aside from exceptions like cerebral edema, hepatic, or hypoxic-ischemic encephalopathy - a key point used to distinguish metabolic from structural coma. Because rare bilateral structural lesions (e.g., bilateral subdural hematomas, DIC, fat emboli) can mimic this picture, imaging is still routinely obtained to exclude a structural cause.
Major Causes (Acquired Metabolic Encephalopathies)
| Category | Examples |
|---|---|
| Hypoxic-ischemic | Cardiac arrest, respiratory failure, shock, CO poisoning |
| Hypercapnia | Respiratory failure/COPD decompensation |
| Glucose derangement | Hypoglycemia, hyperglycemia (DKA, HHS) |
| Organ failure | Hepatic encephalopathy, uremia (renal failure), Reye syndrome |
| Electrolyte/osmolar disturbance | Hyponatremia/hypernatremia, hyperosmolarity, hypercalcemia |
| Endocrine | Thyroid disease, Addison disease |
| Acid-base | Metabolic/respiratory acidosis or alkalosis |
| Toxic-drug | Sedatives, alcohol, antibiotics (e.g., cefepime), other exogenous toxins |
Diagnostic Workup
-
Serum Na, K, Cl, Ca, Mg, glucose, HCO3-, osmolality
-
Renal function (BUN, creatinine) and liver function (AST, ALT, bilirubin, ammonia)
-
Thyroid function (T4, TSH)
-
Arterial blood gas / oxygen saturation
-
Toxicology screen and relevant drug levels
-
Brain imaging (CT/MRI) - to exclude a structural or diffuse bilateral structural lesion masquerading as metabolic encephalopathy
-
EEG - assesses severity and can reveal triphasic waves or nonconvulsive seizures
-
CSF studies if infection or CNS inflammatory process cannot be excluded
-
Adams and Victor's Principles of Neurology, 12th Edition, p. 1137
Management
- Correct the specific metabolic/systemic abnormality (e.g., glucose, electrolytes, treat organ failure, reverse toxins)
- Discontinue all potentially sedating or contributing medications
- Manage the patient in a monitored, low-stimulation setting given confusion/agitation risk
- Serial neurological exams to monitor for evolving focal signs, which should prompt urgent re-imaging to rule out an evolving structural lesion
- Treat superimposed complications (infection, seizures) that can worsen the encephalopathy
- Rehabilitation (cognitive, occupational, speech therapy) for residual deficits after recovery, particularly in prolonged or severe cases
Note on recent literature
Uremic encephalopathy’s
"uremic encephalopathy"
uremic encephalopathy pathophysiology diagnosis treatment
Uremic Encephalopathy
Pathogenesis
- Urea itself is not the toxin. Urea infusions do not reproduce uremic symptoms, and hemodialysis reverses the syndrome even when urea is added back to the dialysate to prevent its blood level from falling - Adams and Victor's Principles of Neurology, 12th Edition, p. 444.
- Poor correlation with standard labs. BUN and creatinine levels correlate only loosely with neurologic severity (though UE is rare with creatinine below 7.0 mg/dL); electrolyte and acid-base abnormalities also do not reliably track with the clinical picture.
- Proposed mechanisms instead include - Comprehensive Clinical Nephrology, 7th Edition, p. uremic encephalopathy section; Adams and Victor's, p. 444:
- Accumulation of guanidino compounds, which antagonize GABA receptors while activating NMDA glutamate receptors, producing net cortical excitability
- Disrupted neurotransmitter balance (decreased norepinephrine, suppressed central dopamine, altered tryptophan/serotonin handling)
- Secondary hyperparathyroidism - elevated brain calcium and PTH effects on neuronal calcium transport and alkaline phosphatase, with cognitive improvement reported after parathyroidectomy in some studies
- Oxidative stress (upregulated NADPH oxidase, downregulated superoxide dismutase) causing protein nitration and myelin oxidation
- Accumulation of other uremic solutes/drug metabolites (e.g., meperidine metabolites, cimetidine, acyclovir) due to reduced renal clearance
- Reduced cerebral glycolysis and Na+/K+-ATPase activity, though these appear to be downstream effects rather than root causes
Clinical Features
- Early: apathy, fatigue, inattentiveness, irritability
- Progressing to: confusion, dysarthria, tremor, asterixis
- Occasionally: toxic psychosis with hallucinations, delusions, insomnia, or catatonia
- Motor phenomena are prominent and often occur even while the patient is still mentally clear - lightning-quick, arrhythmic, asynchronous myoclonic twitches (the "uremic twitch-convulsive syndrome"), sometimes chorea-like movements, plus readily elicited asterixis
- Late/severe: quiet coma; if metabolic acidosis is uncorrected, Kussmaul breathing progressing to Cheyne-Stokes breathing
Diagnosis
- Hypertensive encephalopathy ("pseudouremia" - a term Volhard coined specifically to separate malignant hypertension effects from true uremia; notably the myoclonic-twitch syndrome is NOT a feature of hypertensive encephalopathy)
- Dialysis disequilibrium syndrome
- Subdural/intracerebral hemorrhage (uremic patients have bleeding tendency plus often hypertension; subdural hematomas occur roughly 10x more often in dialysis patients)
- CNS infection/meningitis (uremic patients are infection-prone)
- Electrolyte disturbances mimicking tetany (check calcium/magnesium, though correction often doesn't resolve the encephalopathy)
- Drug accumulation/toxicity from reduced renal clearance
- Osmotic demyelination, cerebrovascular events
Management
- Dialysis or transplantation is the definitive treatment - UE in either AKI or CKD is itself an indication to start renal replacement therapy (hemodialysis, peritoneal dialysis, or CRRT).
- Clinical improvement is usually seen after starting dialysis, but EEG abnormalities lag behind clinical recovery and may take months to normalize (and may never fully normalize in ESKD).
- Address contributing factors as in any metabolic encephalopathy: correct reversible electrolyte/acid-base abnormalities, review and adjust renally-cleared medications, manage seizures if present, and address uremic bleeding risk.
- If symptoms fail to improve after adequate solute clearance, actively search for an alternative or additional cause (the mimics listed above).