
Explain c factor in detail
Which field are you asking about the C-factor in?
C-factor dentistry composite resin cavity configuration polymerization shrinkage
https://www.biomimeticstudyclub.com/blog/tbu-049-5-ways-to-r…
C-factor cavity configuration composite resin bonded unbonded surfaces diagram
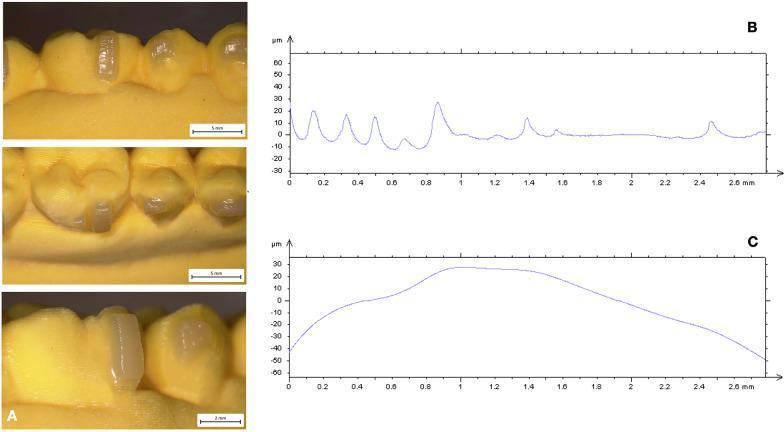
This composite educational graphic details the surface characteristics of orthodontic attachments on a dental resin model. Panel A presents intraoral clinical photographs of a 3D-printed yellow resin dental arch featuring translucent, rectangular composite attachments bonded to the buccal surfaces of the teeth. These attachments appear smooth and glossy, indicative of a well-cured conventional nanocomposite (CNC). Panels B and C are linear surface profile graphs obtained via a contact probe surface profiler. Graph B illustrates the 'surface roughness' profile, displaying frequent, sharp micro-peaks and valleys ranging from approximately -15 µm to +30 µm, which represent localized material irregularities. Graph C illustrates the 'surface waviness' profile, showing a smoother, broader undulating curve representing macro-level variations in surface height across the 2.6 mm measurement length. This data is used in orthodontics to evaluate the quality and precision of clear aligner attachments cured with specialized light-guide tools, comparing surface integrity and morphological accuracy between different composite materials.
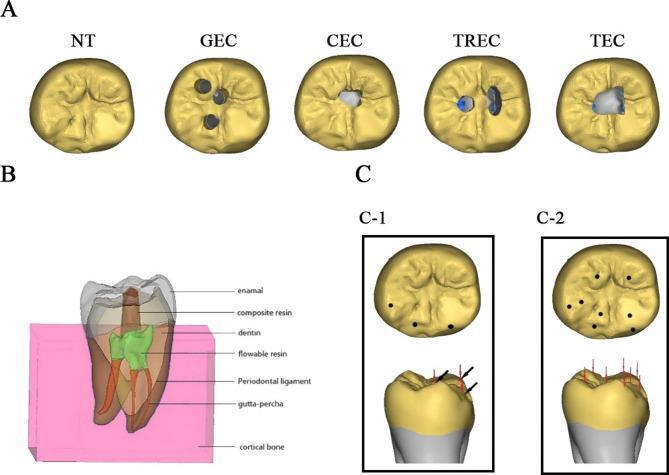
This composite educational diagram presents finite element analysis (FEA) models of a mandibular molar, focusing on endodontic cavity preparation techniques and biomechanical force loading. Section A displays five occlusal views comparing different access cavity designs: Natural Tooth (NT), Guided Endodontic Cavity (GEC) with three small circular access points, Contracted Endodontic Cavity (CEC), Truss Endodontic Cavity (TREC) with isolated access holes, and Traditional Endodontic Cavity (TEC) showing a large central access. Section B provides a sagittal cross-section illustrating the anatomical and restorative components of the model, including enamel, dentin, composite resin, flowable resin, gutta-percha, periodontal ligament, and cortical bone. Section C illustrates force load patterns: C-1 shows a 3-point loading protocol simulating normal mastication with combined vertical and 45-degree lateral forces at the cusps; C-2 shows an 8-point vertical loading protocol simulating maximum bite force. This resource is designed for dental students and endodontists to evaluate how conservative versus traditional access cavities affect stress distribution and fracture resistance.
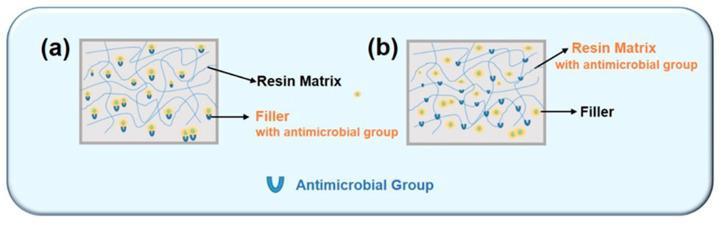
Educational comparison diagram of two antimicrobial dental resin composite strategies: (a) Filler-type and (b) Resin-type. The diagrams illustrate the microscopic structure consisting of a light-blue linear resin matrix and yellow circular filler particles. In the filler-type strategy (a), blue 'U'-shaped icons representing antimicrobial groups are attached specifically to the surface of the yellow filler particles, indicating modified filler surfaces or antimicrobial agent incorporation within the filler. In the resin-type strategy (b), the blue 'U'-shaped antimicrobial groups are covalently bonded directly to the light-blue lines of the resin matrix, as well as associated with the fillers. The diagram illustrates how biocidal moieties like quaternary ammonium methacrylates (QAMs) or MDPB can be integrated into dental materials to provide antibacterial properties. This visual helps dental students and biomaterial researchers understand the difference between surface-released antimicrobial agents (filler-type) and immobilized, long-term antimicrobial properties achieved through copolymerization (resin-type) in restorative dentistry.
C-Factor (Cavity Configuration Factor)
Definition
C-factor = Bonded surfaces / Unbonded (free) surfaces
- Bonded surfaces - all surfaces of the restoration that are in direct adhesive contact with tooth structure (enamel or dentin)
- Unbonded/free surfaces - surfaces of the restoration that are NOT bonded, i.e., the open surface exposed to the oral environment (usually the occlusal/access surface)
Why the C-Factor Matters: The Polymerization Shrinkage Problem
- If composite can shrink freely (many unbonded surfaces), stresses are relieved by flow/deformation of the uncured material.
- If composite is locked into a cavity with many bonded walls (few or no free surfaces), there is nowhere for the shrinkage to go - stress builds up at the bonded interfaces.
C-Factor Values by Cavity Class
| Cavity Type | Bonded Surfaces | Free Surfaces | C-Factor | Stress Risk |
|---|---|---|---|---|
| Class V (cervical) | 5 walls | 1 (labial) | 5 | Very High |
| Class I (occlusal pit/fissure) | 4-5 walls | 1 | ~4-5 | Very High |
| Class II (MO/DO/MOD) | 4-5 walls | 1-2 | ~3-4 | High |
| Class III (proximal, anterior) | 3 walls | 2 | ~1.5 | Moderate |
| Class IV (incisal angle) | 2 walls | 3 | <1 | Low |
| Freehand veneer / Class IV | 1-2 walls | 4-5 | <1 | Lowest |
Mechanism: How Stress Develops
-
Pre-gel phase - The composite is still viscous and flowable. During this phase, shrinkage stress is relieved by material flow ("creep"). The material can deform without breaking bonds.
-
Post-gel phase - Once the gel point is reached, the composite becomes rigid (increasing elastic modulus). Continued shrinkage now generates true stress because the hardened material can no longer flow. In high C-factor cavities, this stress is transmitted directly to the bonded tooth-restoration interface.
Consequences of High C-Factor Stress:
- Marginal gaps and microleakage
- Post-operative sensitivity (dentinal fluid movement from cuspal deformation)
- Recurrent (secondary) caries
- Marginal discoloration
- Cuspal deflection - in extensive Class I and MOD preparations, cusps can actually be pulled inward
- Enamel microcracking at cavity margins
- Bond failure and restoration debonding
Clinical Examples with C-Factor Values
| Restoration | Approximate C-Factor |
|---|---|
| Class V cervical (5 walls, 1 free) | 5 |
| Class I occlusal (4 walls, 1 free) | 4 |
| MOD (3 walls + floor, 1-2 free) | ~3 |
| Class III mesial (3 walls, 2 free) | 1.5 |
| Composite veneer (1 bonded, 4 free) | 0.25 |
Strategies to Reduce the Clinical Impact of C-Factor
1. Incremental Layering Technique
- Horizontal layers increase the C-factor by contacting opposing walls simultaneously
- Oblique/diagonal increments contact fewer opposing walls at once
- Buccolingual incremental technique generates the least strain because composite touches only one dentin wall at a time
2. Cavity Design Modification
- Use bevels and chamfers on cavity margins - this creates additional free surface area, reducing the C-factor
- Convert large direct restorations to indirect inlays/onlays where the C-factor is effectively 0 (adhesive cementation generates far less stress than direct placement)
- Avoid box-shaped, high-wall preparations when possible
3. Resin-Modified Glass Ionomer (RMGI) or Flowable Composite Base
- RMGI has a lower elastic modulus and can absorb polymerization stress
- Flowable composites have a lower elastic modulus than hybrid composites, allowing elastic deformation during shrinkage
4. Soft-Start (Ramped/Pulse) Polymerization
- During the initial low-power phase, the composite stays in the pre-gel (flowable) state longer
- More shrinkage occurs before gel point = more stress relief by flow
- Less residual stress after final cure
5. Low-Shrinkage Composite Materials
6. Centripetal Buildup Technique (for Class II)
Summary Table
| Feature | Low C-Factor | High C-Factor |
|---|---|---|
| Ratio (bonded:free) | <1 | >1 (up to 5) |
| Example | Class IV, veneer | Class V, Class I |
| Cavity shape | Flat/plate-like | Bowl/box-shaped |
| Stress generated | Low | High |
| Clinical risk | Minimal | Marginal gaps, sensitivity, failure |
| Management | Less critical | Incremental layering, liner, soft-start |
Key Takeaway
Source: Feilzer AJ et al., 1987; reviewed in EC Dental Science (2020); Spear Education clinical series