
Cell mediated immunity
cell mediated immunity T cell activation diagram
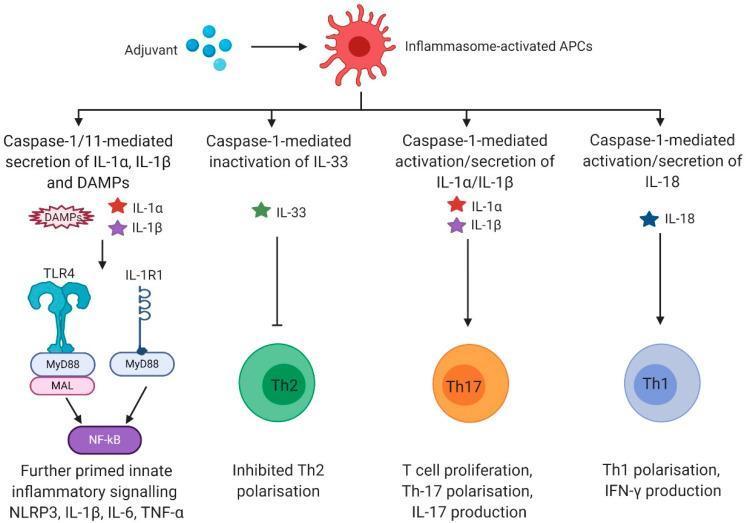
This pathophysiology diagram illustrates the signaling pathways and adaptive immune outcomes following the activation of Antigen-Presenting Cells (APCs) by an adjuvant. The process begins with 'Inflammasome-activated APCs' branching into four distinct downstream cascades mediated by Caspase-1 or Caspase-1/11. 1) Secretion of DAMPs, IL-1α, and IL-1β leads to TLR4 and IL-1R1 signaling via MyD88/MAL pathways, activating NF-κB and resulting in further innate priming (NLRP3, IL-6, TNF-α). 2) Caspase-1-mediated inactivation of IL-33 results in the inhibition of Th2 polarization. 3) Activation and secretion of IL-1α and IL-1β drive T-cell proliferation and Th17 polarization, leading to IL-17 production. 4) Activation and secretion of IL-18 drive Th1 polarization and IFN-γ production. The diagram effectively correlates specific inflammasome-dependent cytokines with T-cell subset differentiation and broader inflammatory responses, highlighting the role of adjuvants in bridging innate and adaptive immunity.
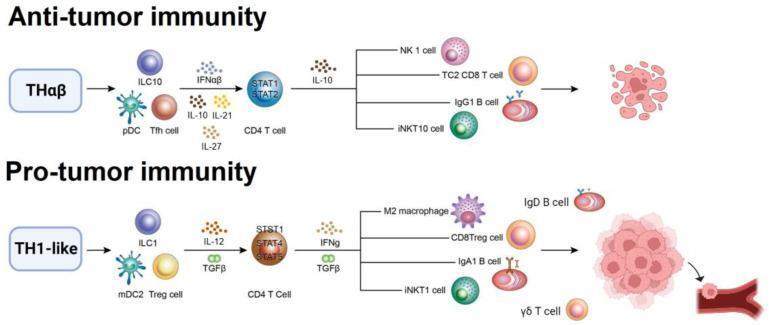
A pathophysiology diagram illustrating the divergent pathways of anti-tumor and pro-tumor immunity within the human immune system. The top panel, titled 'Anti-tumor immunity,' depicts the TH̑αβ pathway involving ILC10, pDC, and Tfh cells. Signaling via IFNαβ, IL-10, IL-21, and IL-27 leads to STAT1/STAT2 activation in CD4 T cells. These cells release IL-10 to recruit effector cells including NK 1 cells, TC2 CD8 T cells, IgG1 B cells, and iNKT10 cells, which results in tumor cell fragmentation (lysis). The bottom panel, titled 'Pro-tumor immunity,' shows the TH1-like pathway involving ILC1, mDC2, and Treg cells. Mediated by IL-12 and TGFβ, CD4 T cells express STAT1, STAT4, and STAT5, subsequently releasing IFNγ and TGFβ. This promotes the activation of M2 macrophages, CD8Treg cells, IgA1 B cells, IgD B cells, iNKT1 cells, and γδ T cells. This pathway results in tumor proliferation and metastasis into a blood vessel. The diagram uses distinct cell icons, transcription factor labels, and cytokine clusters to contrast the destructive versus supportive immune microenvironments in oncology.
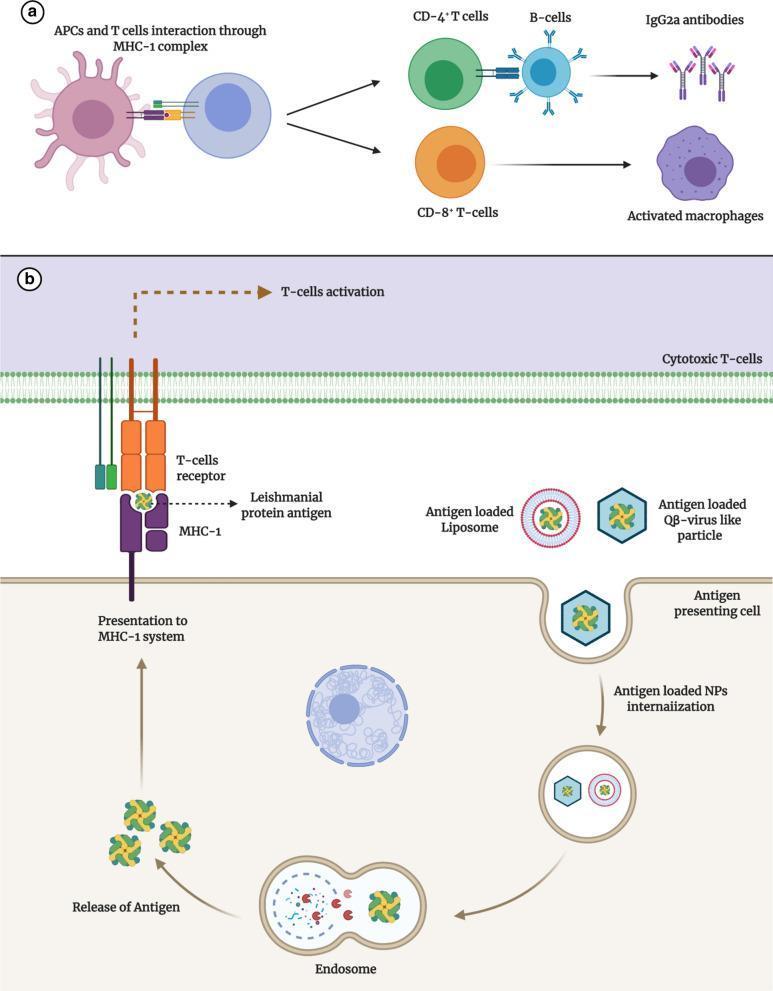
This medical illustration depicts the mechanisms of adaptive immunity and nano-adjuvant mediated antigen delivery, specifically in the context of Leishmaniasis. Section (a) shows an anatomical diagram of the interaction between an Antigen-Presenting Cell (APC) and a T-cell via the MHC-1 complex. This signaling pathway leads to the differentiation of CD4+ T-cells, which stimulate B-cells to produce IgG2a antibodies, and CD8+ T-cells, which lead to the activation of macrophages. Section (b) illustrates a pathophysiology diagram of a nanosystem-based vaccine delivery. It details the internalization of antigen-loaded liposomes and QB-virus-like particles by an APC. Inside the cell, the antigens are released from endosomes and presented to the MHC-1 system. This complex then interacts with the T-cell receptor (TCR) on a cytotoxic T-cell, triggering T-cell activation. The diagram serves as an educational resource for understanding immunological responses and targeted drug delivery systems in infectious disease management.
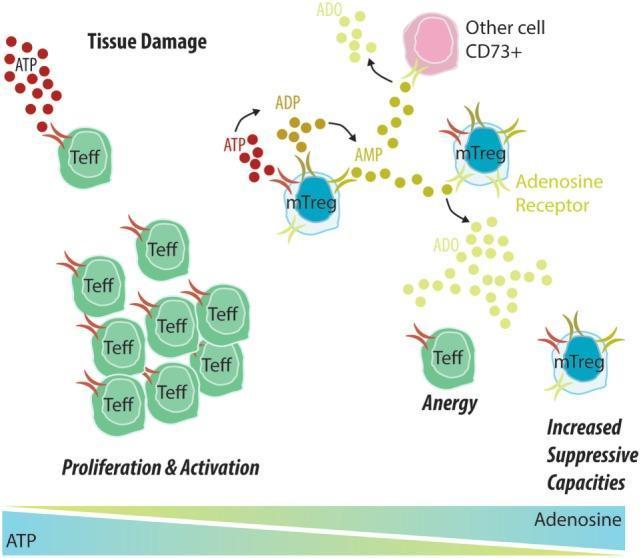
A pathophysiology diagram illustrating purinergic signaling in the context of tissue damage and allograft immunity. The visual depicts two competing pathways mediated by extracellular ATP and its metabolite, adenosine (ADO). In the pro-inflammatory pathway (left), tissue damage releases ATP (red spheres) which binds to Effector T cells (Teff), leading to their proliferation and activation. In the immunomodulatory pathway (center/right), Memory Regulatory T cells (mTreg) utilize CD39 and CD73 enzymes to catalyze the sequential degradation of ATP into ADP, AMP, and finally Adenosine (yellow spheres). The diagram shows ADO interacting with adenosine receptors on mTregs and other CD73+ cells. The outcome of this enzymatic conversion is a transition from an inflammatory environment to a tolerant one, characterized by Teff cell anergy and increased suppressive capacities of mTreg cells. A bottom gradient bar summarizes the shift from high ATP levels (associated with activation) to high Adenosine levels (associated with suppression and tolerance).
CD4 CD8 T helper cytotoxic T lymphocyte mechanism MHC
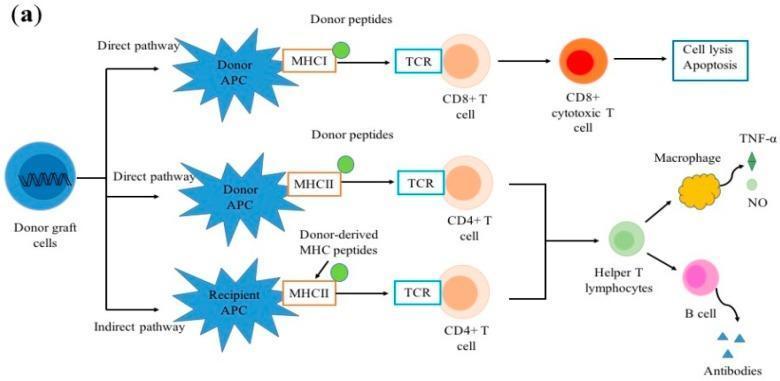
This pathophysiology diagram illustrates the direct and indirect pathways of allorecognition following organ transplantation. The direct pathway features donor antigen-presenting cells (APCs) presenting donor peptides via MHC I and MHC II molecules directly to recipient T-cell receptors (TCRs). Activation of CD8+ T cells leads to their differentiation into cytotoxic T cells, resulting in target cell lysis and apoptosis. Activation of CD4+ T cells leads to the formation of helper T lymphocytes. In the indirect pathway, recipient APCs process donor-derived MHC peptides and present them on self-MHC II molecules to recipient CD4+ T cells, which also differentiate into helper T lymphocytes. These helper T lymphocytes subsequently interact with macrophages, stimulating the release of inflammatory mediators like TNF-α and nitric oxide (NO), and with B cells to stimulate the production of donor-specific antibodies. This schematic summarizes the cellular interactions and signaling pathways that drive acute and chronic allograft rejection in human immunology.
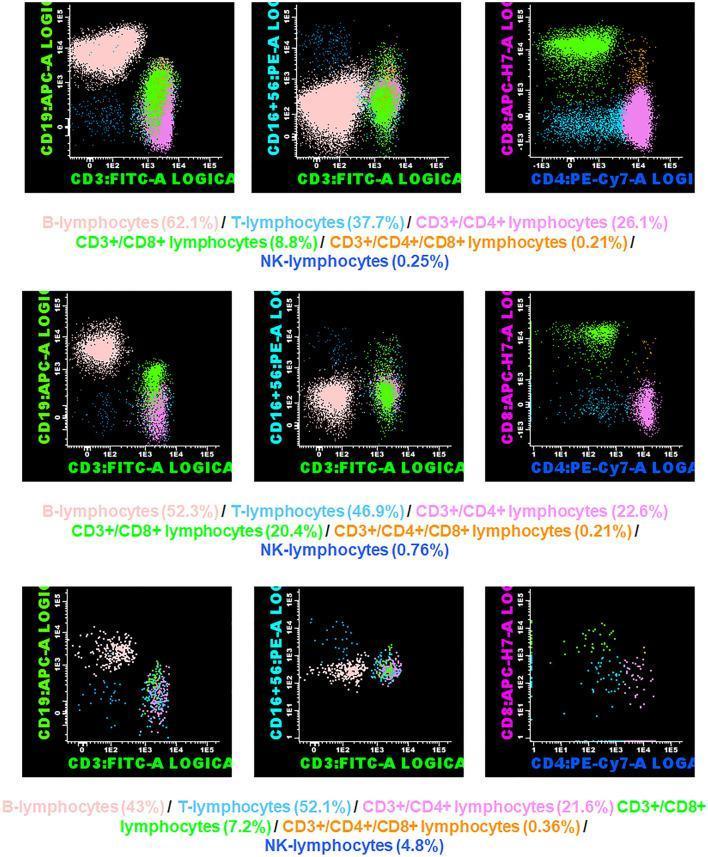
A series of multicolor flow cytometry scatter plots arranged in a 3x3 grid, used to characterize lymphocyte subpopulations in pediatric acute appendicitis. The rows represent three clinical states: the top row shows a control patient (absence of inflammation), the middle row represents Non-Complicated Acute Appendicitis (NCAA), and the bottom row represents Complicated Acute Appendicitis (CAA). Each column depicts specific immunophenotyping markers: (1) CD3:FITC-A vs. CD19:APC-A to differentiate T-lymphocytes and B-lymphocytes; (2) CD3:FITC-A vs. CD16+56:PE-A to identify Natural Killer (NK) cells; and (3) CD4:PE-Cy7-A vs. CD8:APC-H7-A to distinguish T-helper and cytotoxic T-cell subsets. The scatter plots use pseudocolor density gating to visualize cell populations. Accompanying numerical data underneath each row provides quantitative percentages for B-cells, T-cells, CD3+/CD4+, CD3+/CD8+, and NK-lymphocytes. This diagnostic image serves as a clinical immunology comparison for assessing inflammatory responses and immune profiling in surgical pathology.
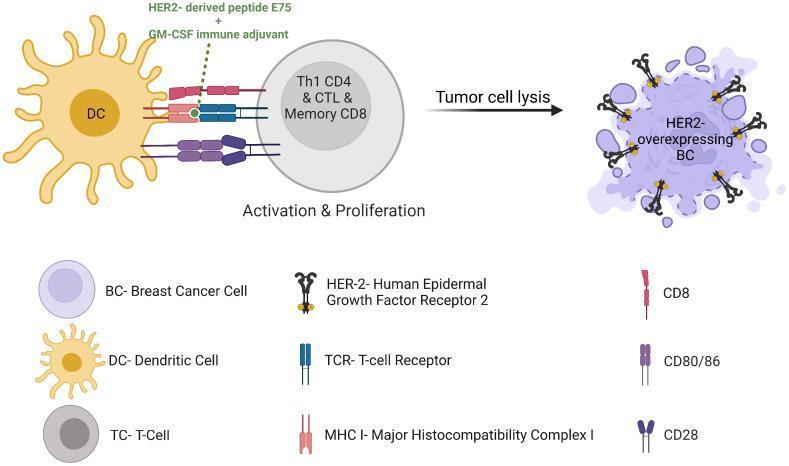
This pathophysiology diagram illustrates the mechanism of action of a HER2-positive breast cancer vaccine (Nelipepimut-S). The process is depicted in three main stages: antigen presentation, T-cell activation, and tumor cell lysis. On the left, a Dendritic Cell (DC) presents the HER2-derived peptide E75 and GM-CSF adjuvant via Major Histocompatibility Complex (MHC) Class I. This complex interacts with the T-cell Receptor (TCR) on a T-cell (TC). Costimulatory signaling is indicated by the interaction between CD80/86 on the DC and CD28 on the TC, supported by CD8. This interaction triggers the 'Activation & Proliferation' of diverse T-cell subtypes, including Th1 CD4, Cytotoxic T Lymphocytes (CTL), and Memory CD8 cells. On the right, the activated effector T-cells target a HER2-overexpressing Breast Cancer (BC) cell, leading to 'Tumor cell lysis.' The diagram uses a legend to identify key molecules: HER-2 (Human Epidermal Growth Factor Receptor 2), TCR, MHC I, CD8, CD80/86, and CD28. This visual represents an immunotherapy strategy designed to induce a specific and durable anti-tumor immune response in HER2-positive malignancies.
Cell-Mediated Immunity (CMI)
1. Overview and Distinction from Humoral Immunity
| Feature | Cell-Mediated Immunity | Humoral Immunity |
|---|---|---|
| Mediators | T lymphocytes, cytokines | B lymphocytes, antibodies |
| Antigen recognition | Peptide-MHC complexes on cell surfaces | Free/soluble antigens |
| MHC restriction | Yes (class I or II) | No |
| Targets | Intracellular pathogens, tumors | Extracellular pathogens, toxins |
2. T Cell Development and Selection
- Positive selection: T cells that recognize self-MHC (with weak affinity) survive. These cells are "self-MHC restricted."
- Negative selection: T cells that bind self-peptide + self-MHC with high affinity are deleted (clonal deletion), preventing autoimmunity.
3. T Cell Receptor (TCR) and Signal Transduction
- CD4 binds MHC class II molecules (expressed on APCs: dendritic cells, macrophages, B cells)
- CD8 binds MHC class I molecules (expressed on virtually all nucleated cells)
4. Two-Signal Model of T Cell Activation
- Signal 1 (antigen-specific): TCR recognition of peptide-MHC complex on an APC
- Signal 2 (costimulatory): Interaction of CD28 on the T cell with B7-1 (CD80) / B7-2 (CD86) on the APC
5. CD4+ Helper T Cell Subsets
| Subset | Inducing Cytokines | Transcription Factor | Effector Cytokines | Function |
|---|---|---|---|---|
| Th1 | IL-12, IFN-γ | T-bet | IFN-γ, TNF-α | Activates macrophages to kill intracellular pathogens; drives CTL responses |
| Th2 | IL-4 | GATA-3 | IL-4, IL-5, IL-13 | Drives IgE production; activates eosinophils; anti-helminth defense |
| Th17 | IL-6, IL-1β, TGF-β, IL-23 | RORγt | IL-17, IL-22 | Neutrophil recruitment; mucosal defense against bacteria and fungi |
| Treg | TGF-β, IL-2 | FoxP3 | TGF-β, IL-10 | Suppresses immune responses; prevents autoimmunity |
| Tfh | IL-6, IL-21 | BCL-6 | IL-21 | Helps B cells in germinal centers to produce high-affinity antibodies |
Clinical relevance: Th1 predominance is protective in intracellular infections (leprosy, leishmaniasis) but drives autoimmune diseases (Type 1 diabetes, MS, RA). Th17 cells contribute to autoimmune colitis, arthritis, and EAE. Th2 predominance is protective against helminths but underlies allergic disease and asthma.
6. CD8+ Cytotoxic T Lymphocytes (CTLs)
Mechanism of Killing
A. Perforin/Granzyme Pathway (dominant mechanism)
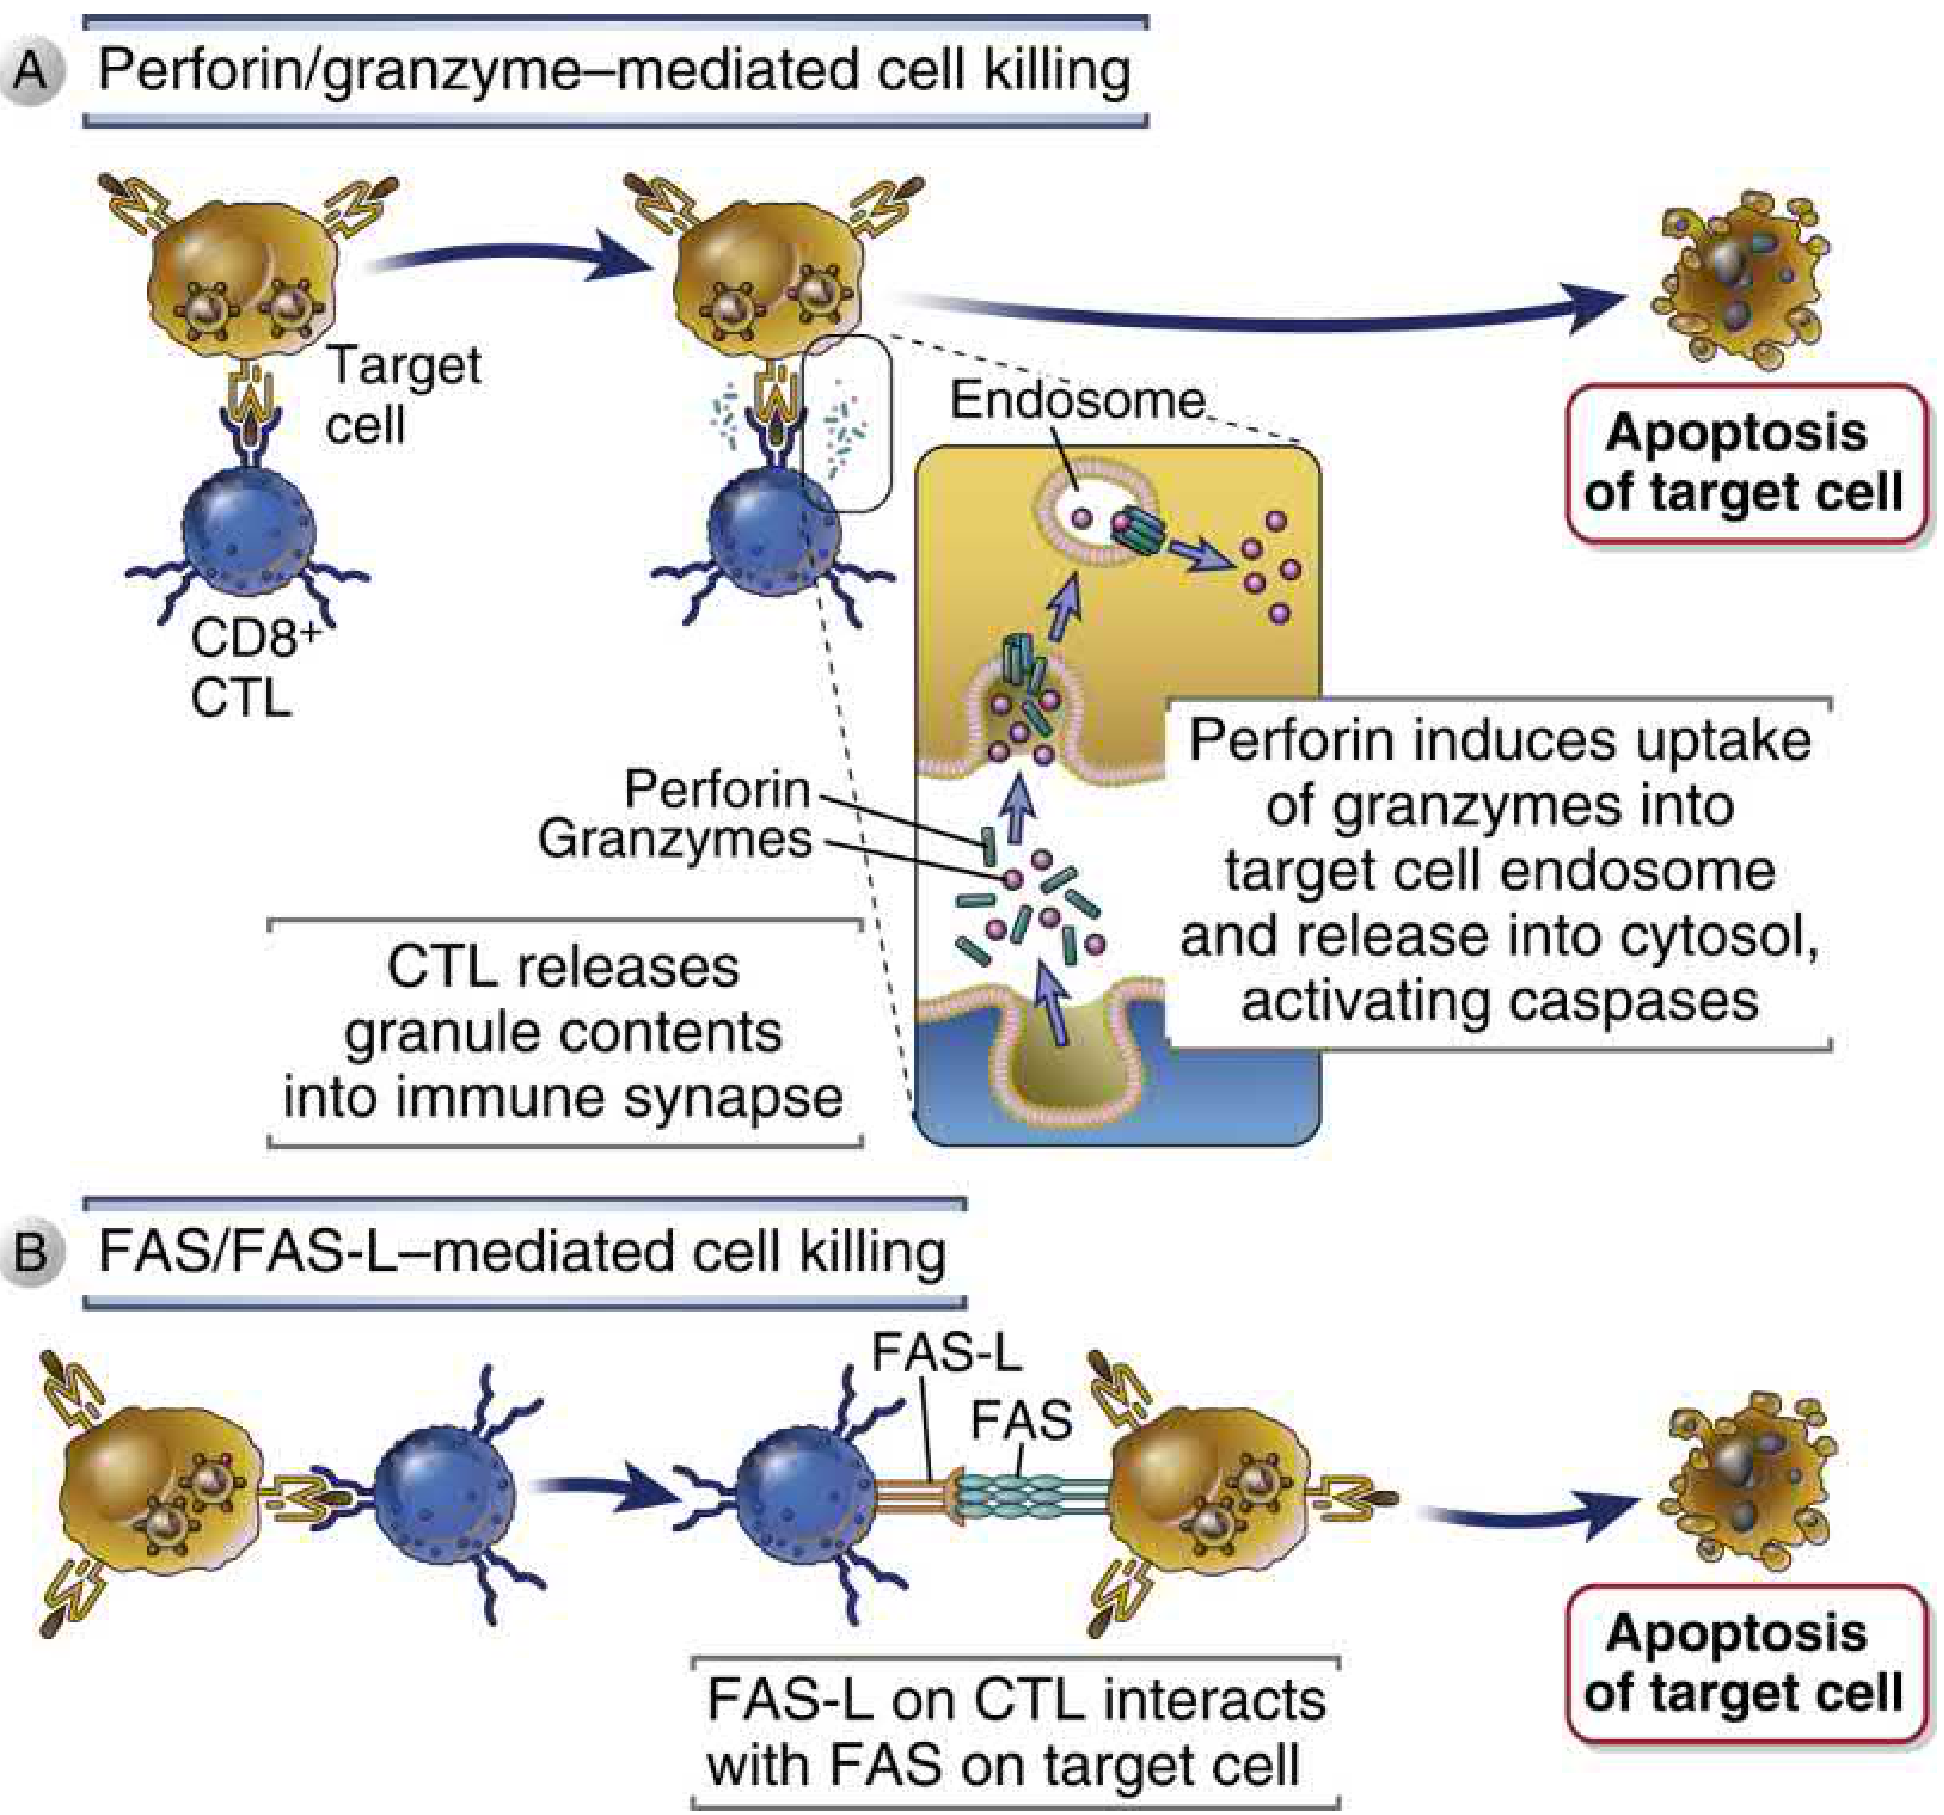
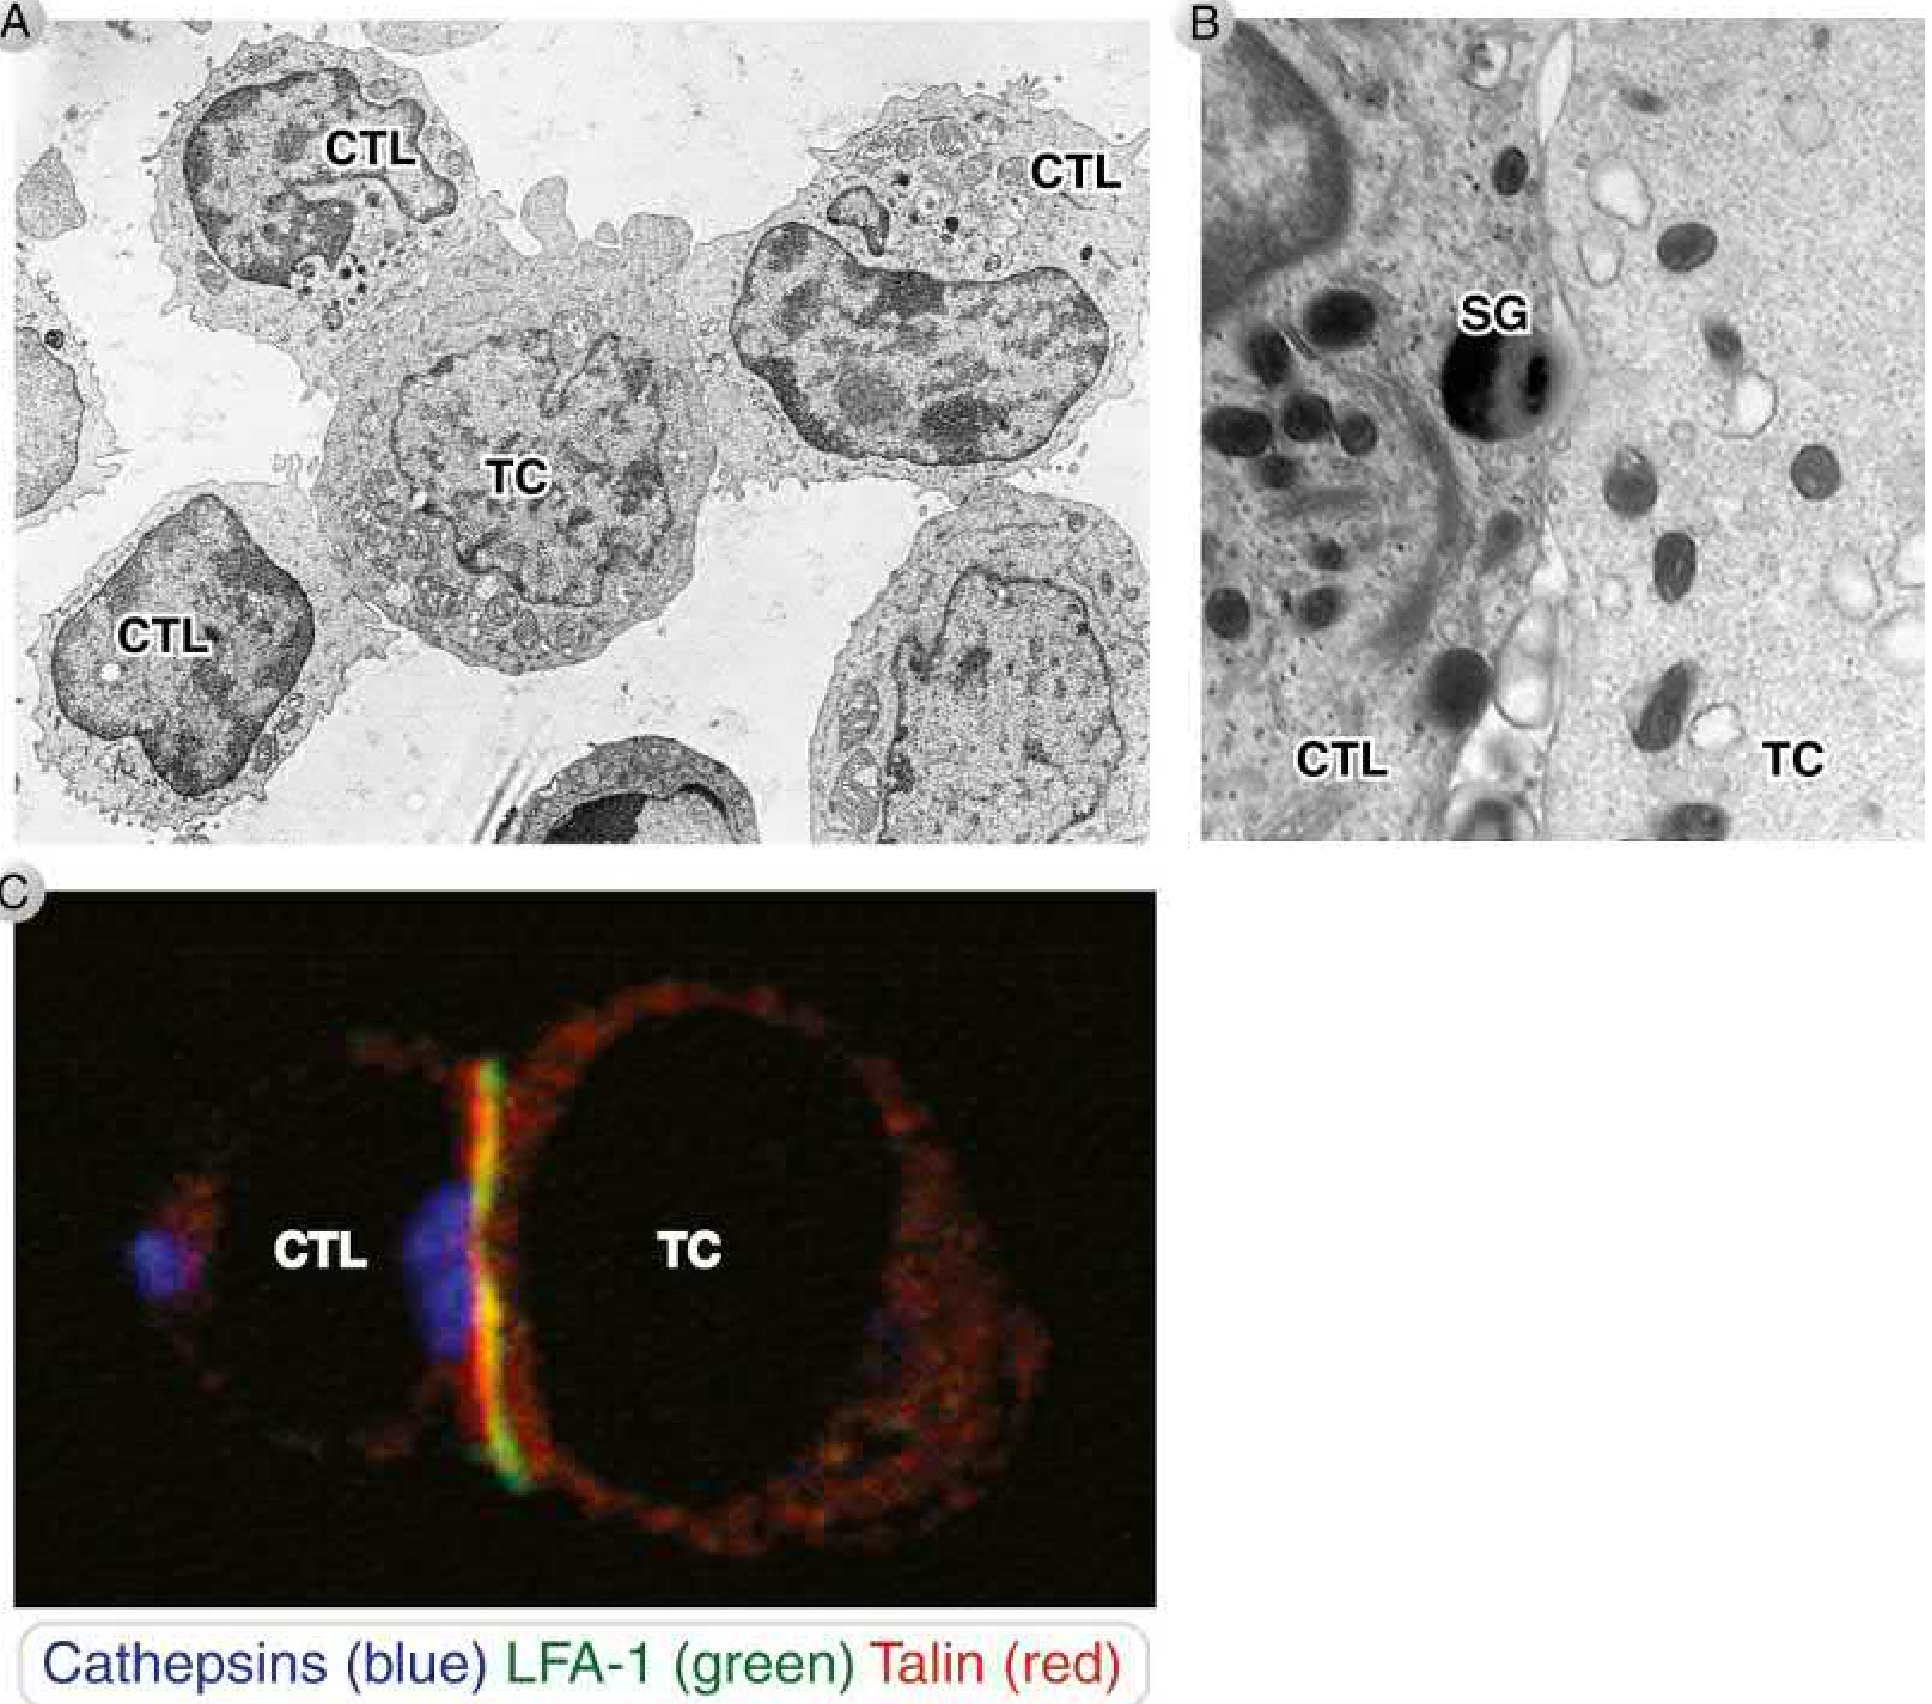
- The CTL's cytoplasmic granules (containing granzymes and perforin, held inactive by the proteoglycan serglycin) polarize toward the immune synapse
- Granules fuse with the CTL plasma membrane and exocytose contents into the synaptic cleft
- Perforin (homologous to complement C9) perturbs the target cell membrane, triggering endocytic uptake of perforin-granzyme-serglycin complexes into target cell endosomes
- Perforin ruptures the endosomal membrane, releasing granzymes into the cytosol
- Granzyme B cleaves caspase-3 and BID, triggering the intrinsic (mitochondrial) apoptotic pathway; the target cell undergoes apoptosis within 2-6 hours
- Granulysin (another granule protein) damages cholesterol-poor bacterial membranes, killing intracellular microbes directly
B. FAS/FAS-Ligand Pathway
- Cellular and Molecular Immunology, p. 739-740
7. CD4+ T Cell Effector Functions in CMI
- IFN-γ activates macrophages to express inducible nitric oxide synthase (iNOS) → generates nitric oxide (NO) and reactive oxygen species → kills intracellular bacteria (e.g., Mycobacterium, Leishmania)
- TNF-α synergizes with IFN-γ for macrophage activation
- IL-2 drives autocrine T cell proliferation and clonal expansion
8. Immunological Memory
- Central memory T cells (Tcm): Reside in lymphoid organs; high proliferative capacity; re-expand on antigen re-encounter
- Effector memory T cells (Tem): Patrol peripheral tissues; immediate effector function on re-exposure
9. Regulatory T Cells (Tregs)
- Secretion of TGF-β and IL-10
- CTLA-4-mediated downregulation of B7 on APCs
- IL-2 consumption (depriving effector T cells)
- Direct cytotoxic killing via perforin/granzyme
10. Clinical Conditions Involving CMI
| Condition | Mechanism |
|---|---|
| Tuberculosis, Leprosy | Protective CMI (Th1/macrophage activation) required |
| HIV/AIDS | Depletion of CD4+ T cells abolishes CMI |
| DiGeorge Syndrome | Thymic aplasia → absent T cells → failed CMI |
| Autoimmune diseases (T1DM, MS, RA) | Aberrant CMI against self antigens |
| Transplant rejection | CMI directed against allogeneic MHC |
| Tumor immunity | CTLs eliminate tumor cells expressing neoantigens |
| Contact hypersensitivity (Type IV) | CD4+ Th1-driven delayed-type hypersensitivity |