
Embolism
pulmonary embolism thrombus lung vessel
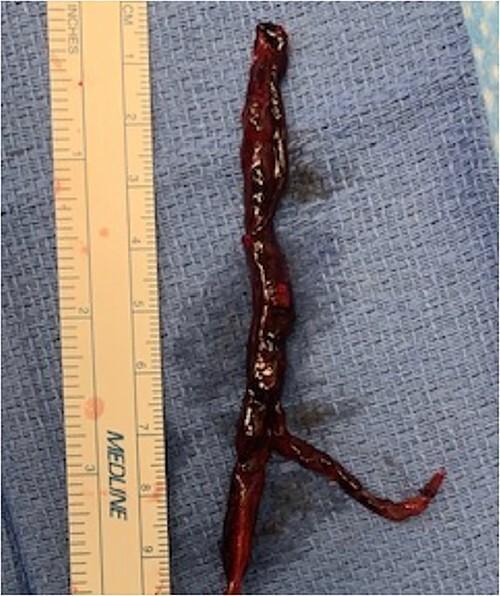
This clinical photograph displays a gross specimen of an extracted thrombus from the left pulmonary artery (LPA), positioned vertically against a blue surgical drape alongside a metric/imperial ruler for scale. The specimen is a subacute pulmonary embolism, approximately 10 cm in length with a maximum width of roughly 1 cm. Visually, the thrombus exhibits a dark, reddish-brown color indicative of coagulated blood and a glistening, irregular surface texture. Its morphology is predominantly elongated and cylindrical, featuring several constrictions along its proximal segment. Notably, the distal portion of the clot demonstrates a bifurcation (branching), which likely corresponds to the anatomical vascular branching of the segmental pulmonary arteries. This image illustrates the physical characteristics of a large-vessel pulmonary embolism potentially identified during donor lung procurement or back-table preparation in the context of lung transplantation. Such specimens are critical for medical education regarding thrombotic pathology and vascular surgery.
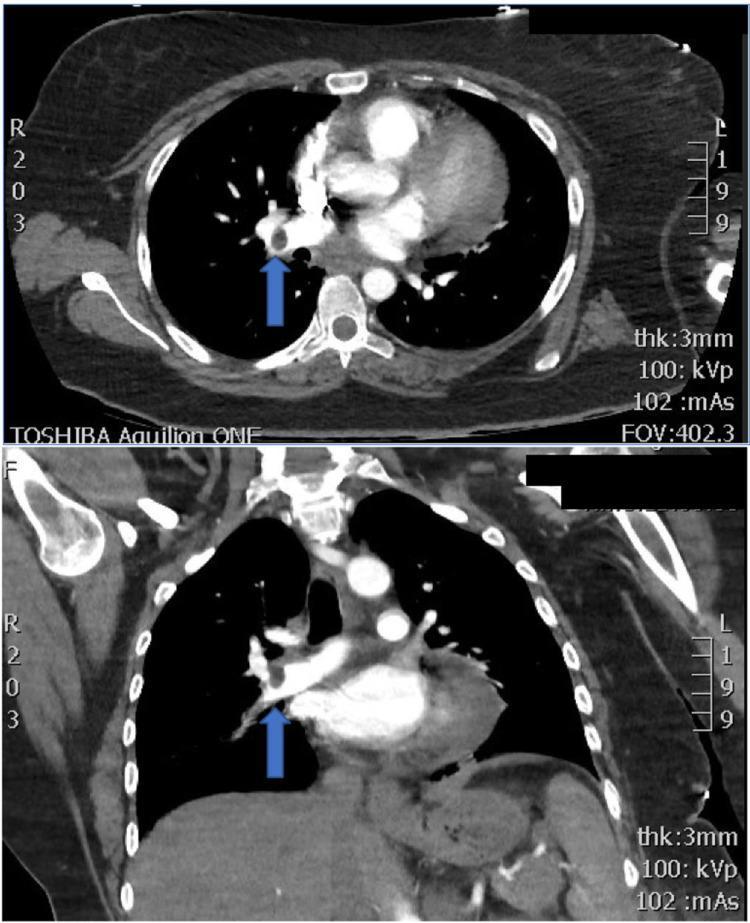
This diagnostic image consists of two views from a Contrast-Enhanced Computed Tomography Pulmonary Angiogram (CTPA): an axial slice (top) and a coronal reconstruction (bottom). The imaging demonstrates a critical finding in the pulmonary vasculature of the right lung. A prominent blue arrow in both views points to a well-defined, hypoattenuating filling defect within the right lower lobar artery, characteristic of an acute occlusive pulmonary embolism (PE). The thrombus is surrounded by high-density intravenous contrast, and the vessel appears moderately distended proximal to the occlusion. Mediastinal window settings show the heart, great vessels, and thoracic vertebrae. The lung parenchyma visualized in the background appears relatively clear without evidence of wedge-shaped infarction (Hampton's hump) or significant pleural effusion in this specific plane. This image serves as a classic educational example for identifying large-vessel pulmonary thromboembolism and understanding the importance of CTPA in diagnosing acute respiratory distress and tachycardia in a clinical setting.
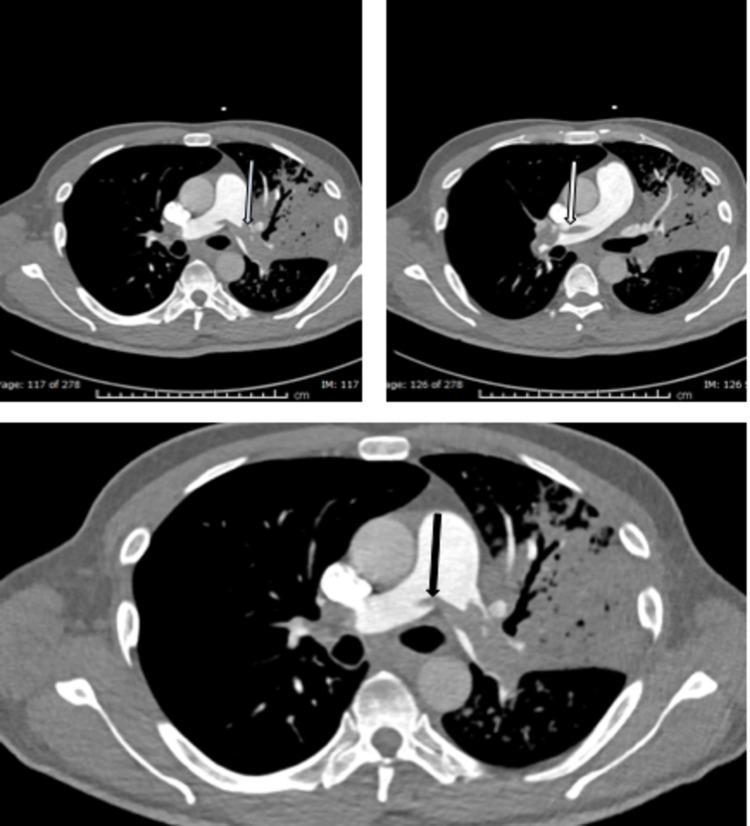
Diagnostic axial CT pulmonary angiogram (CTPA) of the chest demonstrating a saddle pulmonary embolism. The primary finding is a large, low-attenuation filling defect centrally located at the bifurcation of the main pulmonary artery, which extends into both the right and left pulmonary arteries (indicated by various colored arrows). The thrombus conforms to the vessel lumina, partially obstructing contrast flow. Additionally, the left lung parenchyma shows significant abnormalities, including dense consolidation and cavitary lesions in the left upper lobe, consistent with associated pulmonary infarction or underlying pathology. This diagnostic image is intended for intermediate to advanced medical education regarding acute vascular emergencies, pulmonary embolism classification, and cardiothoracic radiology interpretation.
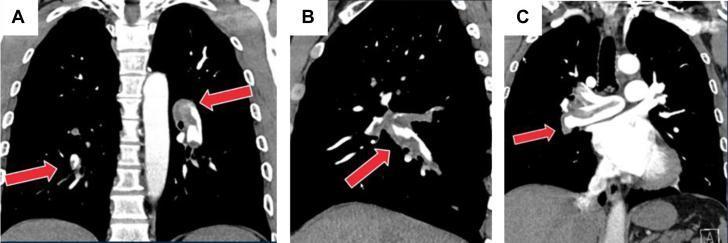
Diagnostic Imaging: A series of three coronal chest CT angiography (CTA) images (labeled A, B, and C) demonstrate a large acute pulmonary embolism. The images reveal a significant saddle embolism characterized by low-attenuation filling defects within the contrast-enhanced pulmonary arterial system. The thrombus is visible at the bifurcation of the main pulmonary artery, extending into both the right and left main pulmonary arteries (indicated by red arrows). In frame C, the large, irregularly shaped filling defect nearly occludes the vessel lumen, while frames A and B show the extension of the thrombus into segmental branches. These findings are clinically significant for acute intermediate-risk pulmonary embolism, illustrating a high-clot-burden obstruction of pulmonary blood flow. The surrounding lung parenchyma appears relatively clear in these sections, without immediate evidence of pulmonary infarction or significant pleural effusion.
fat embolism air embolism types
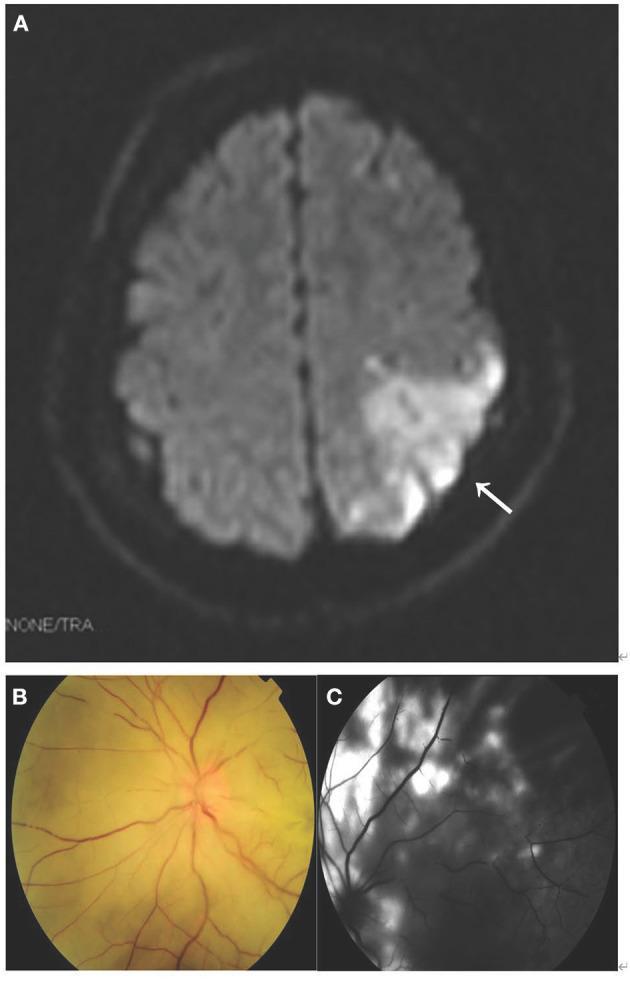
This composite clinical figure illustrates multi-organ pathology related to fat embolism syndrome. Panel A shows an axial Diffusion-Weighted MRI (DWI) of the brain, highlighting a hyperintense signal in the left parietal lobe (marked with an arrow), consistent with an acute ischemic stroke. Panel B is a fundus photograph showing an edematous optic disc, generalized retinal whitening, and a pale yellow posterior pole, indicative of retinal ischemia. Segmental occlusions within the retinal arterioles represent visible fat emboli. Panel C displays fluorescein angiography (FA) of the same eye, demonstrating significant hypofluorescent areas that correspond to vascular blockage and a lack of capillary perfusion in the retinal tissue bed. This combination of neuroimaging and ophthalmologic findings demonstrates systemic embolic phenomena affecting both the cerebral and ocular microcirculation, typically seen in clinical scenarios involving trauma or fat embolism syndrome.
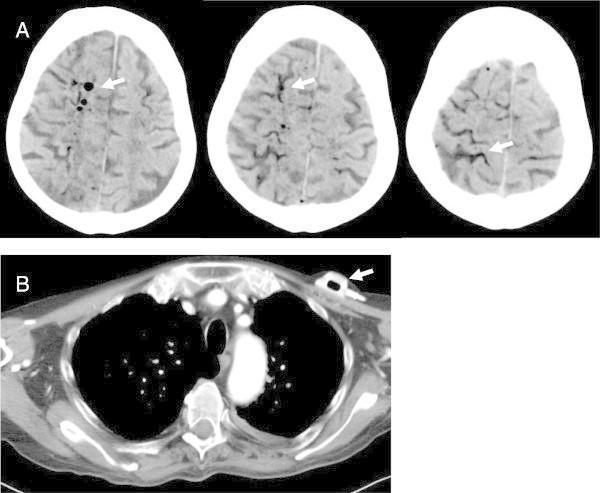
This composite diagnostic image illustrates a clinical case of cerebral air embolism. Panel A consists of three sequential native axial CT scans of the brain at the level of the upper convexities. Multiple focal, hypodense (dark) inclusions representing air are visible within the subarachnoid spaces and sulci, indicated by white arrows. The distribution of these air bubbles is markedly asymmetrical, with a higher concentration localized in the right hemisphere. Panel B is an axial CT scan of the thorax at the level of the upper mediastinum and shoulder girdle. It demonstrates an implanted port catheter in the subcutaneous tissue of the upper chest. A prominent hypodense air pocket is visible within the lumen of the port reservoir (arrow), suggesting the port as the portal of entry for the iatrogenic air embolism. This imagery is highly relevant for neuro-radiological and emergency medicine education, highlighting the radiological appearance of intravascular or subarachnoid air as a complication of central venous access.
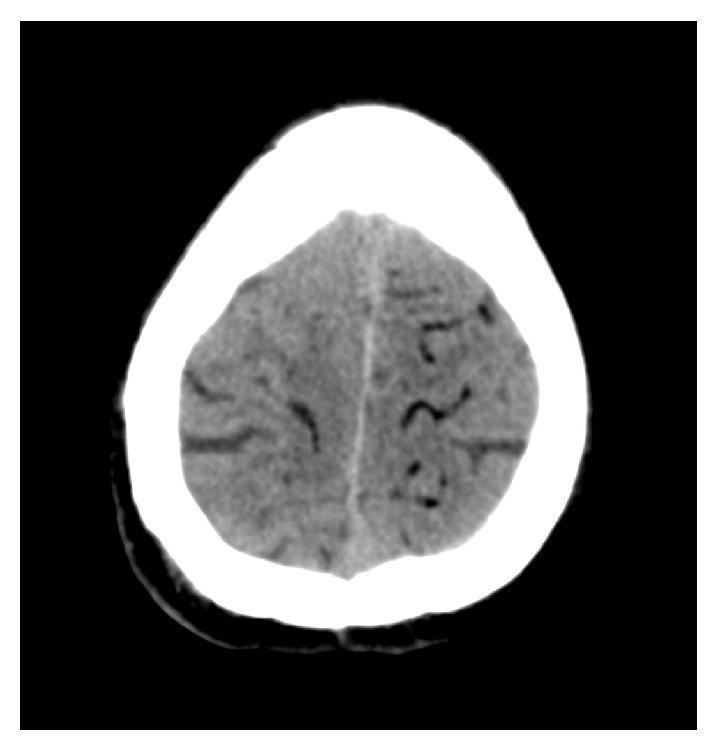
This diagnostic image is a non-contrast axial CT scan of the brain demonstrating a cerebral air embolism. The image shows multiple, distinctive hypodense (dark) serpentiform and curvilinear structures located primarily in the subcortical regions of both cerebral hemispheres. These low-density areas represent air within the cerebral vasculature, exhibiting negative Hounsfield units characteristic of intravascular gas. The distribution follows a gyral pattern just beneath the cortex, which is a classic radiographic sign of arterial air embolism. The clinical context involves a post-procedural complication following a percutaneous lung biopsy, where air entered the systemic circulation and reached the cerebral arteries. This finding is critical for diagnosing acute neurological deficits following thoracic interventions. The educational focus is on the recognition of iatrogenic vascular complications and the characteristic 'air-on-brain' appearance on computed tomography.
Embolism
Definition
- Robbins & Kumar Basic Pathology, p. 93
- Robbins, Cotran & Kumar Pathologic Basis of Disease, p. 130
Types of Embolism
1. Pulmonary Thromboembolism (PE)
- Incidence: 60-120 cases per 100,000 people (US)
- Deaths: 60,000-100,000 per year (US)
- ~20% of patients die before or shortly after diagnosis
| Embolus Size | Consequence |
|---|---|
| Small (60-80% of cases) | Clinically silent; organized and incorporated into vessel wall; may leave bridging fibrous webs |
| Medium-sized | Usually no infarction (dual lung circulation protects); can cause pulmonary hemorrhage |
| Large (saddle embolus) | Straddles the pulmonary artery bifurcation - can cause sudden death, acute cor pulmonale, cardiovascular collapse |
| Multiple recurrent small | Pulmonary hypertension + right ventricular failure over time |
2. Systemic (Arterial) Thromboembolism
- Two-thirds: left ventricular infarcts
- 25%: dilated left atria (e.g., mitral valve disease)
- Remainder: aortic aneurysms, ulcerated atherosclerotic plaques, fragmented valvular vegetations, or the venous system (paradoxical emboli)
- 10-15% are of unknown origin
- Lower extremities - 75%
- Central nervous system (stroke) - 10%
- Less common: intestines, kidneys, spleen
3. Fat Embolism
- Pulmonary insufficiency (dyspnea, tachypnea)
- Neurologic symptoms (irritability, restlessness, delirium, coma)
- Anemia (RBC aggregation/hemolysis)
- Thrombocytopenia (platelet adhesion to fat globules)
- Diffuse petechial rash (seen in 20-50% - pathognomonic clue)
- Mechanical: Fat microemboli directly occlude pulmonary and cerebral microvasculature and trigger platelet aggregation
- Biochemical: Fatty acids released from lipid globules cause local endothelial injury; platelet activation and granulocyte recruitment amplify vascular damage
Special staining note: Because lipids dissolve during routine tissue processing, demonstration of fat microglobules requires fat stains on frozen sections (e.g., Oil Red O).
4. Amniotic Fluid Embolism (AFE)
- Squamous cells shed from fetal skin
- Lanugo hair
- Fat from vernix caseosa
- Mucin from fetal respiratory/GI tracts
- Plus: pulmonary edema, diffuse alveolar damage, fibrin thrombi (DIC)
5. Air (Gas) Embolism
- Air trapped in a coronary artery during cardiac bypass surgery
- Air entering the cerebral circulation during neurosurgery in the upright "sitting position"
- Obstetric and laparoscopic procedures (venous air entry)
- Central venous catheter placement or disconnection
- Decompression sickness ("the bends"): dissolved nitrogen in blood/tissues comes out of solution as bubbles during rapid ascent from deep dives
- Small venous gas emboli: generally no deleterious effects
-
100 mL of air entering venous circulation rapidly: can be fatal
- "Caisson disease" (decompression sickness): nitrogen gas bubbles cause musculoskeletal pain, respiratory compromise, neurologic deficits; treated by recompression in a hyperbaric chamber
6. Cholesterol (Atherosclerotic Debris) Embolism
Summary Table
| Type | Source | Main Target | Key Feature |
|---|---|---|---|
| Pulmonary thromboembolism | DVT (leg veins) | Pulmonary arteries | Most common; saddle embolus → sudden death |
| Systemic thromboembolism | Left heart mural thrombi | Lower limbs, CNS | Infarction of end-organ |
| Fat embolism | Long bone fractures | Lung, brain | Petechial rash, 1-3 day latency |
| Amniotic fluid embolism | Peripartum uterine tears | Maternal pulmonary vessels | ~80% mortality, DIC |
| Air/Gas embolism | Iatrogenic, diving | Any vascular bed | Bends → hyperbaric O₂ |
| Cholesterol embolism | Atherosclerotic plaques | Small arterioles | Blue toe, renal failure |
Consequences: Infarction
- Caliber of the occluded vessel - larger = worse
- Collateral blood supply - dual-supply organs (lung, intestine) are more resistant
- Tissue vulnerability to hypoxia - neurons are most sensitive (4-6 min tolerance)
- Baseline cardiovascular status - compromised patients infarct more easily
- Red (hemorrhagic): Loose tissues, dual-circulation organs (lung), venous occlusions - blood seeps into necrotic zone
- White (anemic): Solid organs with end-arterial circulation (heart, kidney, spleen) - tissue density limits blood seepage
With the above matter create a ppt with using Vivid images and explaining the above topic
mkdir -p /tmp/workspace/embolism-ppt && ls /tmp/workspace/embolism-ppt/
deep vein thrombosis leg vein clot DVT
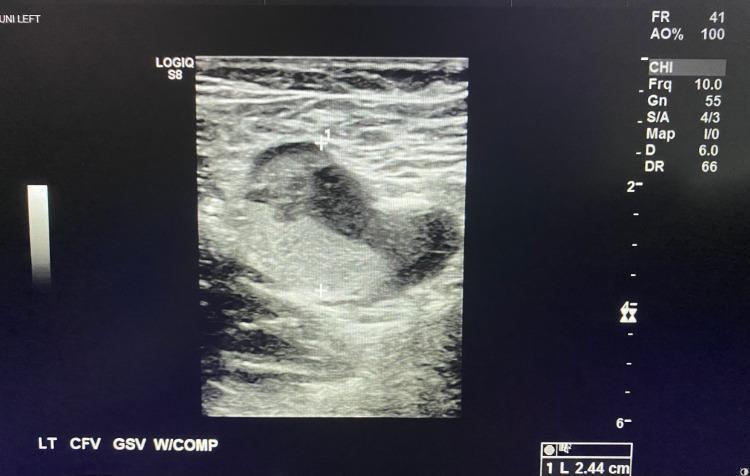
This diagnostic image is a B-mode venous duplex ultrasound of the left lower extremity in a transverse view. The scan focuses on the inguinal region, specifically the junction of the left common femoral vein (CFV) and the great saphenous vein (GSV). The image demonstrates a key diagnostic finding for deep vein thrombosis (DVT): the venous lumen is not anechoic (black) as would be expected with normal blood flow. Instead, it is distended and filled with heterogeneous, intraluminal echoes of mixed echogenicity, indicating an acute thrombus. The labels at the bottom ('LT CFV GSV W/COMP') indicate that the image was captured during a compression maneuver, but the vessel remains patent and non-compressed, confirming the presence of an obstructive clot. Calipers indicate a measurement of 2.44 cm across the vessel bundle. This finding is clinically significant for diagnosing extensive proximal venous thrombosis in the context of symptoms such as leg edema and pain.
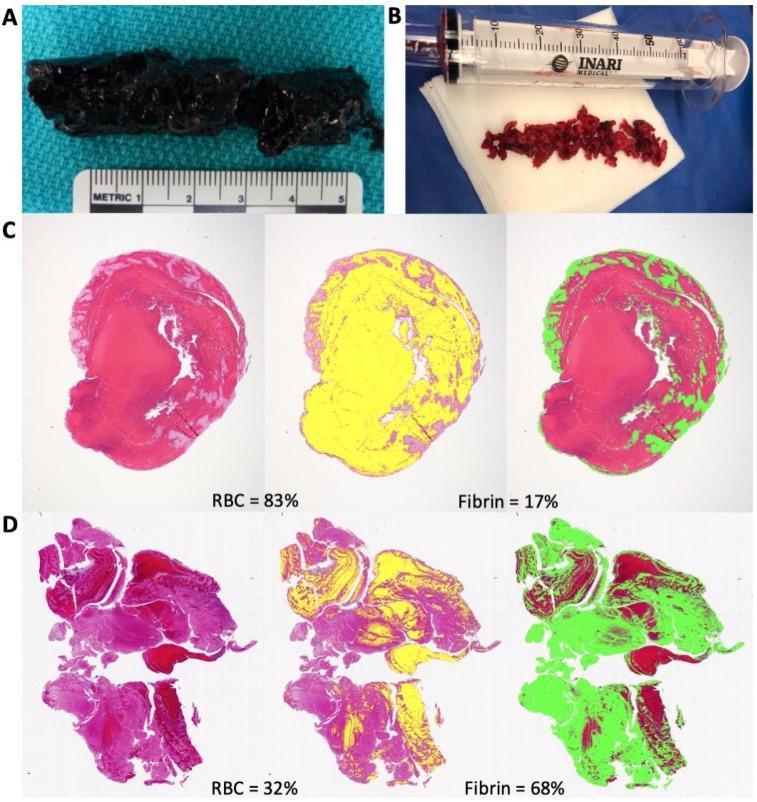
A multi-panel medical image comparing the macroscopic and microscopic characteristics of deep vein thrombosis (DVT) retrieved via mechanical thrombectomy. Panels A and B are clinical photographs of extracted thrombi: A shows a cohesive, dark, approximately 5cm long 'red' clot from an acute case, while B shows fragmented, lighter-red 'white' clot segments from a more chronic case. Panels C and D provide histological and quantitative analysis of these thrombi using color-coded mapping. Panel C demonstrates an acute thrombus composed of 83% erythrocytes (yellow mask) with 17% fibrin (green mask) localized primarily to the periphery. Panel D illustrates a more chronic, organized thrombus with a significantly higher fibrin content (68% in green) distributed throughout the segment and a lower erythrocyte concentration (32% in yellow). This visual comparison highlights the evolution of clot morphology from erythrocyte-rich acute stages to fibrin-rich chronic stages, which correlates with mechanical retrieval success and clinical resolution.
amniotic fluid embolism histology squamous cells pulmonary arteriole
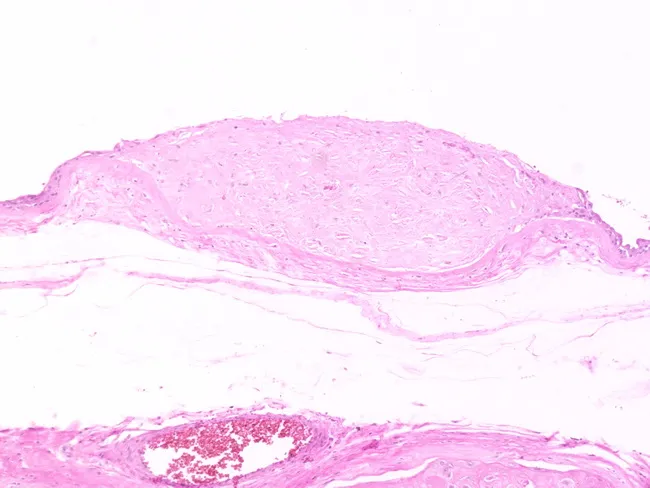
Imaging modality: light microscopy of a hematoxylin and eosin (H&E) stained histology section of the amniotic membrane. Anatomical location: amnion (amniotic membrane) lining the fetal membranes within the intrauterine cavity. Visual features: nodular, eosinophilic amorphous fibrin debris interspersed with entrapped fetal squamous cells derived from fetal epidermis; squames are variably sized, polygonal, with dense cytoplasm and intercellular bridges, occasionally forming small clumps embedded in the fibrin matrix. The architecture shows discrete nodules (amnion nodosum) without prominent inflammatory infiltrate or vascular thrombus. Pathological findings: amnion nodosum composed of amorphous fibrin debris and incorporated fetal squamous cells; interpretation reflects desquamation of fetal skin into amniotic fluid and incorporation into the amnion in the setting of oligohydramnios. Etiology and clinical significance: strongly associated with reduced amniotic fluid volume; serves as a histologic corroboration of oligohydramnios history; generally considered a benign placental membrane change rather than primary fetal pathology. Differential considerations: differentiate from amniotic sheets and other fibrinous deposits by nodular morphology and cellular content. Clinical correlation: correlate with obstetric history, amniotic fluid indices, and placental pathology to aid perinatal diagnosis, prognosis, and educational reference for fetal membrane changes, desquamation processes, and vascular context. Educational tool for pathology residents and obstetric trainees, and clinical researchers alike.
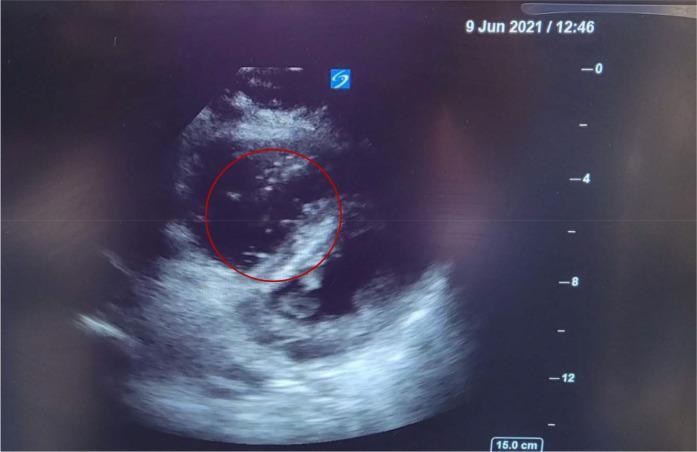
This diagnostic image is a Point-of-Care Ultrasound (POCUS) showing a cardiac view in a patient with suspected amniotic fluid embolism (AFE). The primary finding is the presence of multiple discrete, hyperechoic particles visualized within the right-sided heart chambers (right ventricle/atrium). Within the red-circled area of interest, these particles exhibit a non-uniform distribution, varying in size from fine, punctate echoes to larger, irregularly shaped fragments. The presence of these hyperechoic 'speckles' against the normally anechoic (black) blood pool is a key ultrasonographic sign suggesting the physical entry of particulate matter—such as fetal squamous cells, lanugo, or vernix—into the maternal venous circulation. The image also suggests right ventricular dilatation, consistent with acute right heart strain and pressure overload typically seen in massive embolic events. This visual material is critical for emergency medicine, obstetrics, and cardiology education, illustrating the rapid diagnostic utility of echocardiography in identifying life-threatening peripartum complications.
~/embolism-ppt/build_ppt.py
import json, subprocess, base64, sys
from io import BytesIO
from pptx import Presentation
from pptx.util import Inches, Pt, Emu
from pptx.dml.color import RGBColor
from pptx.enum.text import PP_ALIGN, MSO_ANCHOR
from pptx.enum.shapes import MSO_SHAPE

# ─── COLOUR PALETTE ────────────────────────────────────────────────────────────
DARK_BG      = RGBColor(0x0D, 0x1B, 0x2A)   # very dark navy
MID_BG       = RGBColor(0x1B, 0x2A, 0x3C)   # dark navy
ACCENT_RED   = RGBColor(0xC0, 0x20, 0x20)   # deep red (blood)
ACCENT_GOLD  = RGBColor(0xF5, 0xA6, 0x23)   # warm gold
ACCENT_TEAL  = RGBColor(0x22, 0x9E, 0xBF)   # clinical teal
WHITE        = RGBColor(0xFF, 0xFF, 0xFF)
LIGHT_GREY   = RGBColor(0xCC, 0xD6, 0xE0)
DARK_CARD    = RGBColor(0x16, 0x27, 0x3A)

W = Inches(13.333)
H = Inches(7.5)

# ─── IMAGE URLS ────────────────────────────────────────────────────────────────
IMAGES = {
    "pe_gross":    "https://cdn.orris.care/cdss_images/23abd50643dcdeb51b3d4efc048cd4db536cb8f671091e9fdfec5429ce174803.png",
    "pe_ctpa":     "https://cdn.orris.care/cdss_images/pmc_clinical_VQA_582843a21b545e02f3a26eaac9278053feccc14220598829e83f73106fba24b2.jpg",
    "pe_saddle":   "https://cdn.orris.care/cdss_images/pmc_clinical_VQA_ca829056c1f86ee30fb414a1e828a2638bc0d0fb0da99bf658c809685977616e.jpg",
    "pe_thrombus": "https://cdn.orris.care/cdss_images/pmc_clinical_VQA_32feef0dd1f6389a6c53e687bfe5e3c22aac189d251fc62ba4cc01eb1af2fe51.jpg",
    "fat_emb":     "https://cdn.orris.care/cdss_images/pmc_clinical_VQA_3f44f3ddf8ade42d6f4d50630dcb9065e5354f80ca0dfff790de9df66de8a404.jpg",
    "air_emb":     "https://cdn.orris.care/cdss_images/pmc_clinical_VQA_d9d2bf2fcfc0128ee83c855dcf51be115c4f7f43b9ced5df1e470415253e6154.jpg",
    "dvt":         "https://cdn.orris.care/cdss_images/pmc_clinical_VQA_e9a7d5612f94d1b863f82d2a250ca06b990bfec2b70aa37683bc8a1a8e72002a.jpg",
    "afe_us":      "https://cdn.orris.care/cdss_images/pmc_clinical_VQA_5fe587e656ce97db70e2dd6ccaeb0948e6f167c2bfcd10a3417597ddaedc835c.jpg",
}

print("Fetching images...", flush=True)
fetched = {}
for key, url in IMAGES.items():
    try:
        result = json.loads(subprocess.check_output(
            ["python", "/tmp/skills/shared/scripts/fetch_images.py", url],
            timeout=30
        ))
        if result and result[0].get("base64"):
            raw = base64.b64decode(result[0]["base64"].split(",", 1)[1])
            fetched[key] = BytesIO(raw)
            print(f"  OK: {key}", flush=True)
        else:
            print(f"  FAILED: {key} - {result[0].get('error') if result else 'no result'}", flush=True)
    except Exception as e:
        print(f"  ERROR: {key} - {e}", flush=True)

print(f"Fetched {len(fetched)}/{len(IMAGES)} images", flush=True)

# ─── HELPERS ───────────────────────────────────────────────────────────────────
prs = Presentation()
prs.slide_width  = W
prs.slide_height = H
blank_layout = prs.slide_layouts[6]

def add_slide():
    return prs.slides.add_slide(blank_layout)

def bg(slide, color):
    bg_shp = slide.shapes.add_shape(MSO_SHAPE.RECTANGLE, 0, 0, W, H)
    bg_shp.fill.solid()
    bg_shp.fill.fore_color.rgb = color
    bg_shp.line.fill.background()

def rect(slide, x, y, w, h, fill_color, line_color=None, line_width=None):
    shp = slide.shapes.add_shape(MSO_SHAPE.RECTANGLE, x, y, w, h)
    shp.fill.solid()
    shp.fill.fore_color.rgb = fill_color
    if line_color:
        shp.line.color.rgb = line_color
        shp.line.width = Pt(line_width or 1)
    else:
        shp.line.fill.background()
    return shp

def textbox(slide, text, x, y, w, h, font_size=20, bold=False, color=WHITE,
            align=PP_ALIGN.LEFT, wrap=True, font_name="Calibri", italic=False):
    tb = slide.shapes.add_textbox(x, y, w, h)
    tf = tb.text_frame
    tf.word_wrap = wrap
    tf.margin_left   = 0
    tf.margin_right  = 0
    tf.margin_top    = 0
    tf.margin_bottom = 0
    p = tf.paragraphs[0]
    p.alignment = align
    run = p.add_run()
    run.text = text
    run.font.name  = font_name
    run.font.size  = Pt(font_size)
    run.font.bold  = bold
    run.font.italic = italic
    run.font.color.rgb = color
    return tb

def multiline_textbox(slide, lines, x, y, w, h, default_size=18,
                      default_color=WHITE, default_bold=False,
                      align=PP_ALIGN.LEFT, font_name="Calibri"):
    """lines = list of (text, size, bold, color) or just str"""
    tb = slide.shapes.add_textbox(x, y, w, h)
    tf = tb.text_frame
    tf.word_wrap = True
    tf.margin_left = Inches(0.05)
    tf.margin_right = 0
    tf.margin_top = 0
    tf.margin_bottom = 0
    first = True
    for item in lines:
        if isinstance(item, str):
            text, size, bold, color = item, default_size, default_bold, default_color
        else:
            text = item[0]
            size  = item[1] if len(item) > 1 else default_size
            bold  = item[2] if len(item) > 2 else default_bold
            color = item[3] if len(item) > 3 else default_color
        if first:
            p = tf.paragraphs[0]
            first = False
        else:
            p = tf.add_paragraph()
        p.alignment = align
        p.space_before = Pt(2)
        run = p.add_run()
        run.text = text
        run.font.name  = font_name
        run.font.size  = Pt(size)
        run.font.bold  = bold
        run.font.color.rgb = color
    return tb

def add_image(slide, key, x, y, w, h=None):
    if key not in fetched:
        # placeholder rect
        shp = rect(slide, x, y, w, h or Inches(3), RGBColor(0x33,0x44,0x55))
        textbox(slide, f"[{key}]", x, y, w, h or Inches(3), font_size=12, color=LIGHT_GREY, align=PP_ALIGN.CENTER)
        return
    fetched[key].seek(0)
    if h:
        slide.shapes.add_picture(fetched[key], x, y, width=w, height=h)
    else:
        slide.shapes.add_picture(fetched[key], x, y, width=w)

def accent_bar(slide, color=ACCENT_RED, height=Inches(0.07)):
    rect(slide, 0, 0, W, height, color)

def section_header_bar(slide, title, subtitle=""):
    bg(slide, DARK_BG)
    rect(slide, 0, 0, W, Inches(0.06), ACCENT_RED)
    rect(slide, 0, H - Inches(0.06), W, Inches(0.06), ACCENT_RED)
    # big centred title
    textbox(slide, title, Inches(1), Inches(2.8), Inches(11.3), Inches(1.2),
            font_size=44, bold=True, color=WHITE, align=PP_ALIGN.CENTER)
    if subtitle:
        textbox(slide, subtitle, Inches(1), Inches(4.0), Inches(11.3), Inches(0.7),
                font_size=22, bold=False, color=ACCENT_GOLD, align=PP_ALIGN.CENTER, italic=True)

# ═══════════════════════════════════════════════════════════════════════════════
# SLIDE 1 – TITLE
# ═══════════════════════════════════════════════════════════════════════════════
slide = add_slide()
bg(slide, DARK_BG)

# red accent bar top & bottom
rect(slide, 0, 0, W, Inches(0.12), ACCENT_RED)
rect(slide, 0, H - Inches(0.12), W, Inches(0.12), ACCENT_RED)

# left half dark card
rect(slide, 0, Inches(0.12), Inches(6.8), H - Inches(0.24), DARK_CARD)

# right-side image
add_image(slide, "pe_gross", Inches(6.9), Inches(0.2), Inches(6.2), Inches(7.1))

# gold vertical accent
rect(slide, Inches(6.7), Inches(0.12), Inches(0.12), H - Inches(0.24), ACCENT_RED)

# title text
textbox(slide, "EMBOLISM", Inches(0.4), Inches(1.3), Inches(6.0), Inches(1.4),
        font_size=54, bold=True, color=WHITE, align=PP_ALIGN.LEFT)
textbox(slide, "Pathophysiology, Types & Clinical Impact",
        Inches(0.4), Inches(2.8), Inches(6.0), Inches(0.8),
        font_size=20, bold=False, color=ACCENT_GOLD, align=PP_ALIGN.LEFT, italic=True)

# divider line
rect(slide, Inches(0.4), Inches(3.7), Inches(5.6), Inches(0.04), ACCENT_TEAL)

# subtitle bullets
multiline_textbox(slide, [
    ("Robbins & Kumar Basic Pathology", 14, False, LIGHT_GREY),
    ("Robbins, Cotran & Kumar Pathologic Basis of Disease", 14, False, LIGHT_GREY),
], Inches(0.4), Inches(3.9), Inches(6.2), Inches(1.0))

textbox(slide, "Medical Pathology Review", Inches(0.4), Inches(6.6), Inches(6.0), Inches(0.6),
        font_size=13, color=ACCENT_TEAL, align=PP_ALIGN.LEFT)

# ═══════════════════════════════════════════════════════════════════════════════
# SLIDE 2 – DEFINITION
# ═══════════════════════════════════════════════════════════════════════════════
slide = add_slide()
bg(slide, DARK_BG)
accent_bar(slide, ACCENT_RED)
rect(slide, 0, H - Inches(0.07), W, Inches(0.07), ACCENT_RED)

# Slide title
rect(slide, 0, Inches(0.07), W, Inches(0.85), MID_BG)
textbox(slide, "What is an Embolism?", Inches(0.4), Inches(0.12), Inches(10), Inches(0.75),
        font_size=30, bold=True, color=WHITE)
textbox(slide, "02", Inches(12.5), Inches(0.12), Inches(0.7), Inches(0.75),
        font_size=28, bold=True, color=ACCENT_GOLD, align=PP_ALIGN.RIGHT)

# Definition box
rect(slide, Inches(0.3), Inches(1.1), Inches(8.3), Inches(2.6), DARK_CARD,
     line_color=ACCENT_TEAL, line_width=1.5)
multiline_textbox(slide, [
    ("Definition", 16, True, ACCENT_GOLD),
    ("", 4, False, WHITE),
    ("An embolus is a detached intravascular solid, liquid, or gaseous mass", 15, False, WHITE),
    ("carried by blood from its origin to a distant site, where it lodges in a", 15, False, WHITE),
    ("vessel too small to permit further passage — causing partial or complete", 15, False, WHITE),
    ("vascular occlusion, ischemia, and often tissue infarction.", 15, False, WHITE),
], Inches(0.55), Inches(1.2), Inches(8.0), Inches(2.4))

# Origin of emboli
multiline_textbox(slide, [
    ("Composition of Emboli", 16, True, ACCENT_GOLD),
    ("", 4, False, WHITE),
    ("Thrombus (most common) - thromboembolism", 14, False, LIGHT_GREY),
    ("Fat droplets - long bone fractures", 14, False, LIGHT_GREY),
    ("Air / nitrogen gas bubbles", 14, False, LIGHT_GREY),
    ("Atherosclerotic debris (cholesterol emboli)", 14, False, LIGHT_GREY),
    ("Amniotic fluid, tumor fragments, bone marrow", 14, False, LIGHT_GREY),
], Inches(0.3), Inches(3.85), Inches(5.8), Inches(2.8))

# image right side
add_image(slide, "pe_thrombus", Inches(8.75), Inches(1.0), Inches(4.35), Inches(5.6))
textbox(slide, "Extracted pulmonary artery thrombus (~10 cm)\nshowing bifurcated morphology matching vessel anatomy",
        Inches(8.75), Inches(6.6), Inches(4.35), Inches(0.7),
        font_size=10, color=LIGHT_GREY, align=PP_ALIGN.CENTER, italic=True)

# key term box
rect(slide, Inches(6.2), Inches(3.8), Inches(2.3), Inches(1.2), ACCENT_RED)
textbox(slide, "Key Term", Inches(6.2), Inches(3.85), Inches(2.3), Inches(0.4),
        font_size=12, bold=True, color=WHITE, align=PP_ALIGN.CENTER)
textbox(slide, "Thromboembolism\n= Dislodged thrombus\nas an embolus", Inches(6.2), Inches(4.2), Inches(2.3), Inches(0.8),
        font_size=12, bold=False, color=WHITE, align=PP_ALIGN.CENTER)

# ═══════════════════════════════════════════════════════════════════════════════
# SLIDE 3 – PULMONARY THROMBOEMBOLISM (Overview)
# ═══════════════════════════════════════════════════════════════════════════════
slide = add_slide()
bg(slide, DARK_BG)
accent_bar(slide, ACCENT_RED)
rect(slide, 0, H - Inches(0.07), W, Inches(0.07), ACCENT_RED)
rect(slide, 0, Inches(0.07), W, Inches(0.85), MID_BG)
textbox(slide, "Pulmonary Thromboembolism (PE)", Inches(0.4), Inches(0.12), Inches(11), Inches(0.75),
        font_size=30, bold=True, color=WHITE)
textbox(slide, "03", Inches(12.5), Inches(0.12), Inches(0.7), Inches(0.75),
        font_size=28, bold=True, color=ACCENT_GOLD, align=PP_ALIGN.RIGHT)

# Left - info
multiline_textbox(slide, [
    ("Most Common Type of Embolism", 17, True, ACCENT_GOLD),
    ("", 4, False, WHITE),
    ("Origin: >95% from DVT in leg veins (proximal to popliteal fossa)", 14, False, LIGHT_GREY),
    ("Path: veins  right heart  pulmonary arterial tree", 14, False, LIGHT_GREY),
    ("", 4, False, WHITE),
    ("Epidemiology (USA)", 16, True, ACCENT_TEAL),
    ("60,000 - 100,000 deaths per year", 14, False, WHITE),
    ("Incidence: 60-120 cases per 100,000 people", 14, False, WHITE),
    ("~20% die before / shortly after diagnosis", 14, False, WHITE),
], Inches(0.3), Inches(1.1), Inches(5.5), Inches(3.5))

# Severity spectrum table
tbl_x, tbl_y = Inches(0.3), Inches(4.7)
tbl_w = Inches(5.5)
headers = ["Size", "Consequence"]
rows = [
    ("60-80% (small)", "Clinically silent, organize + incorporate"),
    ("Medium", "No infarct (dual circulation); may hemorrhage"),
    ("Large / Saddle", "Sudden death, cor pulmonale, CV collapse"),
    ("Multiple recurrent", "Pulmonary hypertension + RV failure"),
]
rect(slide, tbl_x, tbl_y, tbl_w, Inches(0.38), ACCENT_RED)
textbox(slide, "Size", tbl_x + Inches(0.05), tbl_y + Inches(0.04), Inches(1.5), Inches(0.3),
        font_size=13, bold=True, color=WHITE)
textbox(slide, "Consequence", tbl_x + Inches(1.6), tbl_y + Inches(0.04), Inches(3.8), Inches(0.3),
        font_size=13, bold=True, color=WHITE)
for i, (s, c) in enumerate(rows):
    row_y = tbl_y + Inches(0.38) + i * Inches(0.42)
    fill_col = DARK_CARD if i % 2 == 0 else MID_BG
    rect(slide, tbl_x, row_y, tbl_w, Inches(0.42), fill_col)
    textbox(slide, s, tbl_x + Inches(0.05), row_y + Inches(0.06), Inches(1.5), Inches(0.32),
            font_size=12, color=ACCENT_GOLD)
    textbox(slide, c, tbl_x + Inches(1.6), row_y + Inches(0.06), Inches(3.85), Inches(0.32),
            font_size=12, color=LIGHT_GREY)

# Right - images
add_image(slide, "pe_saddle", Inches(6.0), Inches(1.0), Inches(7.1), Inches(4.0))
textbox(slide, "CTPA: Saddle embolism extending into both right and left pulmonary arteries",
        Inches(6.0), Inches(5.05), Inches(7.1), Inches(0.55),
        font_size=10, color=LIGHT_GREY, align=PP_ALIGN.CENTER, italic=True)
add_image(slide, "dvt", Inches(6.0), Inches(5.7), Inches(3.4), Inches(1.55))
textbox(slide, "DVT: Source of PE", Inches(6.0), Inches(7.05), Inches(3.4), Inches(0.35),
        font_size=9, color=LIGHT_GREY, align=PP_ALIGN.CENTER, italic=True)
add_image(slide, "pe_ctpa", Inches(9.5), Inches(5.7), Inches(3.6), Inches(1.55))
textbox(slide, "CTPA: Acute PE filling defect", Inches(9.5), Inches(7.05), Inches(3.6), Inches(0.35),
        font_size=9, color=LIGHT_GREY, align=PP_ALIGN.CENTER, italic=True)

# ═══════════════════════════════════════════════════════════════════════════════
# SLIDE 4 – SYSTEMIC THROMBOEMBOLISM
# ═══════════════════════════════════════════════════════════════════════════════
slide = add_slide()
bg(slide, DARK_BG)
accent_bar(slide, ACCENT_TEAL)
rect(slide, 0, H - Inches(0.07), W, Inches(0.07), ACCENT_TEAL)
rect(slide, 0, Inches(0.07), W, Inches(0.85), MID_BG)
textbox(slide, "Systemic (Arterial) Thromboembolism", Inches(0.4), Inches(0.12), Inches(11), Inches(0.75),
        font_size=30, bold=True, color=WHITE)
textbox(slide, "04", Inches(12.5), Inches(0.12), Inches(0.7), Inches(0.75),
        font_size=28, bold=True, color=ACCENT_GOLD, align=PP_ALIGN.RIGHT)

# Sources
multiline_textbox(slide, [
    ("Sources of Systemic Emboli (80% intracardiac)", 17, True, ACCENT_GOLD),
    ("", 3, False, WHITE),
    ("Left ventricular infarcts ................. 2/3 of cases", 14, False, WHITE),
    ("Dilated left atria (mitral valve disease) ... 25%", 14, False, WHITE),
    ("Aortic aneurysms, atherosclerotic plaques .. remainder", 14, False, WHITE),
    ("Valvular vegetations / paradoxical emboli", 14, False, WHITE),
    ("Unknown origin ......................... 10-15%", 14, False, WHITE),
], Inches(0.3), Inches(1.1), Inches(6.0), Inches(3.2))

# Common sites
multiline_textbox(slide, [
    ("Destination of Arterial Emboli", 17, True, ACCENT_TEAL),
    ("", 3, False, WHITE),
    ("Lower extremities ..................... 75%", 14, False, LIGHT_GREY),
    ("Central nervous system (stroke) ....... 10%", 14, False, LIGHT_GREY),
    ("Intestines, kidneys, spleen ........... less common", 14, False, LIGHT_GREY),
], Inches(0.3), Inches(4.5), Inches(6.0), Inches(2.0))

# Key distinction box
rect(slide, Inches(0.3), Inches(6.55), Inches(6.0), Inches(0.75), ACCENT_RED)
textbox(slide, "Key Distinction: Venous emboli  lungs | Arterial emboli  anywhere",
        Inches(0.35), Inches(6.6), Inches(5.9), Inches(0.65),
        font_size=13, bold=True, color=WHITE, align=PP_ALIGN.CENTER)

# Right: anatomical diagram via image
add_image(slide, "pe_ctpa", Inches(6.5), Inches(1.0), Inches(6.6), Inches(6.0))
textbox(slide, "Contrast-enhanced CTPA showing filling defect in right lower lobar artery",
        Inches(6.5), Inches(7.05), Inches(6.6), Inches(0.35),
        font_size=10, color=LIGHT_GREY, align=PP_ALIGN.CENTER, italic=True)

# Paradoxical embolism callout
rect(slide, Inches(6.6), Inches(1.1), Inches(3.2), Inches(1.0), DARK_CARD,
     line_color=ACCENT_GOLD, line_width=1.5)
textbox(slide, "Paradoxical Embolism", Inches(6.7), Inches(1.15), Inches(3.0), Inches(0.4),
        font_size=12, bold=True, color=ACCENT_GOLD)
textbox(slide, "Venous embolus crosses patent foramen ovale or VSD into systemic circulation",
        Inches(6.7), Inches(1.52), Inches(3.0), Inches(0.5),
        font_size=11, color=LIGHT_GREY)

# ═══════════════════════════════════════════════════════════════════════════════
# SLIDE 5 – FAT EMBOLISM
# ═══════════════════════════════════════════════════════════════════════════════
slide = add_slide()
bg(slide, DARK_BG)
accent_bar(slide, ACCENT_GOLD)
rect(slide, 0, H - Inches(0.07), W, Inches(0.07), ACCENT_GOLD)
rect(slide, 0, Inches(0.07), W, Inches(0.85), MID_BG)
textbox(slide, "Fat Embolism Syndrome (FES)", Inches(0.4), Inches(0.12), Inches(11), Inches(0.75),
        font_size=30, bold=True, color=WHITE)
textbox(slide, "05", Inches(12.5), Inches(0.12), Inches(0.7), Inches(0.75),
        font_size=28, bold=True, color=ACCENT_GOLD, align=PP_ALIGN.RIGHT)

# Left panel
multiline_textbox(slide, [
    ("Cause", 16, True, ACCENT_GOLD),
    ("Fat globules + marrow elements released from", 13, False, LIGHT_GREY),
    ("long bone fractures / soft tissue crush injury", 13, False, LIGHT_GREY),
    ("", 3, False, WHITE),
    ("Clinical Features (appear 1-3 days post-injury)", 16, True, ACCENT_GOLD),
    ("Pulmonary insufficiency: dyspnea, tachypnea", 13, False, WHITE),
    ("Neurologic: irritability, restlessness, delirium, coma", 13, False, WHITE),
    ("Anemia (RBC aggregation / hemolysis)", 13, False, WHITE),
    ("Thrombocytopenia (platelet adhesion to fat)", 13, False, WHITE),
    ("Petechial rash (20-50%) - pathognomonic sign", 13, True, ACCENT_RED),
    ("Mortality: ~10%", 13, True, ACCENT_RED),
], Inches(0.3), Inches(1.1), Inches(5.8), Inches(5.0))

# Pathogenesis
rect(slide, Inches(0.3), Inches(6.3), Inches(5.8), Inches(0.9), DARK_CARD,
     line_color=ACCENT_TEAL, line_width=1)
multiline_textbox(slide, [
    ("Pathogenesis: Mechanical obstruction of microvasculature +", 12, True, ACCENT_TEAL),
    ("Biochemical: fatty acids  endothelial injury, platelet activation, granulocyte recruitment", 12, False, LIGHT_GREY),
], Inches(0.4), Inches(6.35), Inches(5.6), Inches(0.8))

# Right panel - fat embolism image
add_image(slide, "fat_emb", Inches(6.3), Inches(1.0), Inches(6.8), Inches(5.5))
textbox(slide, "Fat embolism syndrome: MRI brain (ischemic stroke, left parietal) + fundus photograph\nshowing retinal ischemia with segmental arteriolar occlusion from fat emboli",
        Inches(6.3), Inches(6.5), Inches(6.8), Inches(0.8),
        font_size=10, color=LIGHT_GREY, align=PP_ALIGN.CENTER, italic=True)

# Staining tip
rect(slide, Inches(6.3), Inches(1.05), Inches(3.5), Inches(0.85), DARK_CARD,
     line_color=ACCENT_GOLD, line_width=1.5)
textbox(slide, "Staining Note", Inches(6.4), Inches(1.1), Inches(3.3), Inches(0.3),
        font_size=11, bold=True, color=ACCENT_GOLD)
textbox(slide, "Fat dissolves in routine processing. Use Oil Red O stain on frozen sections.",
        Inches(6.4), Inches(1.38), Inches(3.3), Inches(0.45),
        font_size=11, color=LIGHT_GREY)

# ═══════════════════════════════════════════════════════════════════════════════
# SLIDE 6 – AMNIOTIC FLUID EMBOLISM
# ═══════════════════════════════════════════════════════════════════════════════
slide = add_slide()
bg(slide, DARK_BG)
accent_bar(slide, RGBColor(0xB0, 0x40, 0x80))
rect(slide, 0, H - Inches(0.07), W, Inches(0.07), RGBColor(0xB0, 0x40, 0x80))
rect(slide, 0, Inches(0.07), W, Inches(0.85), MID_BG)
textbox(slide, "Amniotic Fluid Embolism (AFE)", Inches(0.4), Inches(0.12), Inches(11), Inches(0.75),
        font_size=30, bold=True, color=WHITE)
textbox(slide, "06", Inches(12.5), Inches(0.12), Inches(0.7), Inches(0.75),
        font_size=28, bold=True, color=ACCENT_GOLD, align=PP_ALIGN.RIGHT)

# Stats row
for i, (num, label) in enumerate([("1 in 40,000", "Deliveries affected"),
                                    ("~80%", "Mortality rate"),
                                    ("5-10%", "Of maternal deaths (USA)"),
                                    ("85%", "Survivors: neurologic deficit")]):
    cx = Inches(0.3) + i * Inches(3.25)
    rect(slide, cx, Inches(1.0), Inches(3.1), Inches(1.2), DARK_CARD,
         line_color=RGBColor(0xB0, 0x40, 0x80), line_width=1.5)
    textbox(slide, num, cx + Inches(0.1), Inches(1.05), Inches(2.9), Inches(0.6),
            font_size=22, bold=True, color=ACCENT_GOLD, align=PP_ALIGN.CENTER)
    textbox(slide, label, cx + Inches(0.1), Inches(1.6), Inches(2.9), Inches(0.5),
            font_size=11, color=LIGHT_GREY, align=PP_ALIGN.CENTER)

# Left info
multiline_textbox(slide, [
    ("Mechanism", 16, True, ACCENT_GOLD),
    ("Amniotic fluid enters maternal circulation via tears in", 13, False, LIGHT_GREY),
    ("placental membranes / uterine veins during labor", 13, False, LIGHT_GREY),
    ("", 3, False, WHITE),
    ("Clinical Presentation", 16, True, ACCENT_GOLD),
    ("Sudden severe dyspnea, cyanosis, shock", 13, False, WHITE),
    ("Seizures and coma", 13, False, WHITE),
    ("~50% develop DIC (release of thrombogenic substances)", 13, False, WHITE),
    ("", 3, False, WHITE),
    ("Histology Findings", 16, True, ACCENT_TEAL),
    ("Fetal squamous cells, lanugo hair, vernix fat,", 13, False, LIGHT_GREY),
    ("mucin in maternal pulmonary microvessels", 13, False, LIGHT_GREY),
    ("+ Pulmonary edema + diffuse alveolar damage + fibrin thrombi", 13, False, LIGHT_GREY),
    ("", 3, False, WHITE),
    ("Pathogenesis: Coagulation + innate immune activation", 13, True, ACCENT_RED),
    ("(NOT purely mechanical obstruction)", 13, False, ACCENT_RED),
], Inches(0.3), Inches(2.35), Inches(6.0), Inches(4.8))

# Right - AFE ultrasound
add_image(slide, "afe_us", Inches(6.5), Inches(2.2), Inches(6.6), Inches(4.5))
textbox(slide, "POCUS: Hyperechoic particles in right heart chambers consistent with AFE\n(fetal squamous cells / particulate matter in maternal venous circulation)",
        Inches(6.5), Inches(6.75), Inches(6.6), Inches(0.65),
        font_size=10, color=LIGHT_GREY, align=PP_ALIGN.CENTER, italic=True)

# ═══════════════════════════════════════════════════════════════════════════════
# SLIDE 7 – AIR / GAS EMBOLISM
# ═══════════════════════════════════════════════════════════════════════════════
slide = add_slide()
bg(slide, DARK_BG)
accent_bar(slide, ACCENT_TEAL)
rect(slide, 0, H - Inches(0.07), W, Inches(0.07), ACCENT_TEAL)
rect(slide, 0, Inches(0.07), W, Inches(0.85), MID_BG)
textbox(slide, "Air / Gas Embolism", Inches(0.4), Inches(0.12), Inches(11), Inches(0.75),
        font_size=30, bold=True, color=WHITE)
textbox(slide, "07", Inches(12.5), Inches(0.12), Inches(0.7), Inches(0.75),
        font_size=28, bold=True, color=ACCENT_GOLD, align=PP_ALIGN.RIGHT)

# Left
multiline_textbox(slide, [
    ("Mechanism", 16, True, ACCENT_TEAL),
    ("Gas bubbles enter circulation, coalesce, obstruct", 13, False, LIGHT_GREY),
    ("vascular flow, cause distal ischemia", 13, False, LIGHT_GREY),
    ("", 3, False, WHITE),
    ("Clinical Scenarios", 16, True, ACCENT_GOLD),
    ("Cardiac bypass: air in coronary artery  ischemia", 13, False, WHITE),
    ("Neurosurgery (sitting position): air  cerebral arteries", 13, False, WHITE),
    ("Obstetric / laparoscopic procedures", 13, False, WHITE),
    ("CVC placement / disconnection", 13, False, WHITE),
    ("", 3, False, WHITE),
    ("Decompression Sickness (The Bends)", 16, True, ACCENT_RED),
    ("Rapid ascent from deep diving", 13, False, LIGHT_GREY),
    ("Dissolved N2 comes out of solution as bubbles", 13, False, LIGHT_GREY),
    ("Musculoskeletal pain, dyspnea, neurologic deficits", 13, False, LIGHT_GREY),
    ("Treatment: Recompression in hyperbaric chamber", 13, True, ACCENT_GOLD),
    ("", 3, False, WHITE),
    ("Threshold: >100 mL venous air rapidly = fatal", 13, True, ACCENT_RED),
    ("Small venous emboli = generally no ill effects", 13, False, LIGHT_GREY),
], Inches(0.3), Inches(1.1), Inches(6.0), Inches(5.8))

# Right - air embolism CT
add_image(slide, "air_emb", Inches(6.4), Inches(1.0), Inches(6.7), Inches(5.8))
textbox(slide, "CT brain: Cerebral air embolism - hypodense serpentiform intravascular gas\nin subcortical regions (post-percutaneous lung biopsy complication)",
        Inches(6.4), Inches(6.85), Inches(6.7), Inches(0.55),
        font_size=10, color=LIGHT_GREY, align=PP_ALIGN.CENTER, italic=True)

# ═══════════════════════════════════════════════════════════════════════════════
# SLIDE 8 – SUMMARY TABLE
# ═══════════════════════════════════════════════════════════════════════════════
slide = add_slide()
bg(slide, DARK_BG)
accent_bar(slide, ACCENT_RED)
rect(slide, 0, H - Inches(0.07), W, Inches(0.07), ACCENT_RED)
rect(slide, 0, Inches(0.07), W, Inches(0.85), MID_BG)
textbox(slide, "Summary: Types of Embolism", Inches(0.4), Inches(0.12), Inches(11), Inches(0.75),
        font_size=30, bold=True, color=WHITE)
textbox(slide, "08", Inches(12.5), Inches(0.12), Inches(0.7), Inches(0.75),
        font_size=28, bold=True, color=ACCENT_GOLD, align=PP_ALIGN.RIGHT)

col_headers = ["Type", "Source", "Main Target", "Key Feature"]
col_widths   = [Inches(2.6), Inches(3.0), Inches(2.8), Inches(4.6)]
col_x = [Inches(0.2)]
for cw in col_widths[:-1]:
    col_x.append(col_x[-1] + cw)

rows_data = [
    ("Pulmonary\nThromboembolism", "DVT (leg veins)", "Pulmonary arteries", "Most common; saddle embolus  sudden death"),
    ("Systemic\nThromboembolism", "Left heart mural thrombi", "Lower limbs (75%), CNS", "Infarction of end-organ; end-artery involvement"),
    ("Fat Embolism", "Long bone fractures", "Lung, brain", "Petechial rash; 1-3 day latency; 10% mortality"),
    ("Amniotic Fluid\nEmbolism", "Peripartum uterine tears", "Maternal pulmonary vessels", "~80% mortality; DIC; immune activation"),
    ("Air / Gas\nEmbolism", "Iatrogenic, deep-sea diving", "Any vascular bed", ">100 mL fatal; decompression  hyperbaric O2"),
    ("Cholesterol\nEmbolism", "Atherosclerotic plaques", "Small arterioles", "Blue toe, renal failure, livedo reticularis"),
]

tbl_y_start = Inches(1.05)
row_h = Inches(0.95)

# Header row
rect(slide, Inches(0.2), tbl_y_start, sum(col_widths), Inches(0.45), ACCENT_RED)
for i, hdr in enumerate(col_headers):
    textbox(slide, hdr, col_x[i] + Inches(0.06), tbl_y_start + Inches(0.06),
            col_widths[i] - Inches(0.1), Inches(0.35),
            font_size=13, bold=True, color=WHITE)

for r, (t, s, tgt, kf) in enumerate(rows_data):
    ry = tbl_y_start + Inches(0.45) + r * row_h
    fill = DARK_CARD if r % 2 == 0 else MID_BG
    rect(slide, Inches(0.2), ry, sum(col_widths), row_h, fill)
    for ci, txt in enumerate([t, s, tgt, kf]):
        textbox(slide, txt, col_x[ci] + Inches(0.06), ry + Inches(0.05),
                col_widths[ci] - Inches(0.1), row_h - Inches(0.1),
                font_size=11, color=LIGHT_GREY if ci > 0 else ACCENT_GOLD,
                bold=(ci == 0))

# ═══════════════════════════════════════════════════════════════════════════════
# SLIDE 9 – INFARCTION (consequence)
# ═══════════════════════════════════════════════════════════════════════════════
slide = add_slide()
bg(slide, DARK_BG)
accent_bar(slide, ACCENT_RED)
rect(slide, 0, H - Inches(0.07), W, Inches(0.07), ACCENT_RED)
rect(slide, 0, Inches(0.07), W, Inches(0.85), MID_BG)
textbox(slide, "Consequence: Infarction", Inches(0.4), Inches(0.12), Inches(11), Inches(0.75),
        font_size=30, bold=True, color=WHITE)
textbox(slide, "09", Inches(12.5), Inches(0.12), Inches(0.7), Inches(0.75),
        font_size=28, bold=True, color=ACCENT_GOLD, align=PP_ALIGN.RIGHT)

# Definition
rect(slide, Inches(0.3), Inches(1.05), Inches(12.7), Inches(0.7), DARK_CARD,
     line_color=ACCENT_RED, line_width=1.5)
textbox(slide, "An infarct is an area of ischemic necrosis caused by occlusion of arterial supply or venous drainage.",
        Inches(0.45), Inches(1.1), Inches(12.4), Inches(0.6),
        font_size=14, bold=False, color=WHITE)

# Factors affecting infarction - left
multiline_textbox(slide, [
    ("Factors Determining Infarction", 16, True, ACCENT_GOLD),
    ("", 3, False, WHITE),
    ("1  Caliber of occluded vessel (larger = worse)", 13, False, WHITE),
    ("2  Presence of collateral blood supply", 13, False, WHITE),
    ("3  Tissue vulnerability to hypoxia", 13, False, WHITE),
    ("   Neurons: 4-6 min | Myocardium: ~20 min", 12, False, ACCENT_TEAL),
    ("4  Baseline cardiovascular status", 13, False, WHITE),
    ("   Compromised patients infarct more easily", 12, False, LIGHT_GREY),
], Inches(0.3), Inches(1.9), Inches(5.8), Inches(3.2))

# Types of infarcts - cards
for i, (title, color_text, body) in enumerate([
    ("Red (Hemorrhagic) Infarct", ACCENT_RED,
     "Loose/spongy tissues (lung)\nDual-circulation organs (intestine)\nVenous occlusions (testicular torsion)\nReestablished flow to necrotic area"),
    ("White (Anemic) Infarct", ACCENT_TEAL,
     "Solid organs with end-arteries\nHeart, kidney, spleen\nTissue density limits blood seepage\nCaused by arterial occlusions"),
]):
    cx = Inches(0.3) + i * Inches(3.1)
    cy = Inches(5.25)
    rect(slide, cx, cy, Inches(2.9), Inches(2.0), DARK_CARD,
         line_color=color_text, line_width=2)
    textbox(slide, title, cx + Inches(0.1), cy + Inches(0.1), Inches(2.7), Inches(0.45),
            font_size=13, bold=True, color=color_text)
    textbox(slide, body, cx + Inches(0.1), cy + Inches(0.55), Inches(2.7), Inches(1.35),
            font_size=11, color=LIGHT_GREY)

# Shape of infarcts
rect(slide, Inches(6.5), Inches(1.9), Inches(6.6), Inches(5.4), DARK_CARD,
     line_color=ACCENT_GOLD, line_width=1)
textbox(slide, "Shape & Gross Appearance", Inches(6.6), Inches(1.95), Inches(6.3), Inches(0.4),
        font_size=15, bold=True, color=ACCENT_GOLD)
multiline_textbox(slide, [
    ("Wedge-shaped, with occluded vessel at apex", 13, False, WHITE),
    ("and organ periphery as base", 13, False, WHITE),
    ("", 3, False, WHITE),
    ("Fresh infarcts: poorly defined, slightly hemorrhagic", 13, False, LIGHT_GREY),
    ("Acute inflammatory response on serosal surface", 13, False, LIGHT_GREY),
    ("  fibrinous exudate", 13, False, LIGHT_GREY),
    ("", 3, False, WHITE),
    ("~40% of all US deaths from cardiovascular disease", 13, True, ACCENT_RED),
    ("Most attributable to myocardial or cerebral infarction", 13, False, LIGHT_GREY),
    ("", 3, False, WHITE),
    ("Cause of Infarction", 15, True, ACCENT_GOLD),
    ("Arterial thrombosis or arterial embolism", 13, False, WHITE),
    ("Less common: vasospasm, plaque hemorrhage,", 13, False, LIGHT_GREY),
    ("extrinsic vessel compression, vascular torsion", 13, False, LIGHT_GREY),
], Inches(6.6), Inches(2.45), Inches(6.3), Inches(4.6))

# ═══════════════════════════════════════════════════════════════════════════════
# SLIDE 10 – KEY POINTS / THANK YOU
# ═══════════════════════════════════════════════════════════════════════════════
slide = add_slide()
bg(slide, DARK_BG)
rect(slide, 0, 0, W, Inches(0.12), ACCENT_RED)
rect(slide, 0, H - Inches(0.12), W, Inches(0.12), ACCENT_RED)

textbox(slide, "Key Takeaways", Inches(0.4), Inches(0.2), Inches(12), Inches(0.7),
        font_size=34, bold=True, color=WHITE, align=PP_ALIGN.CENTER)
rect(slide, Inches(4.0), Inches(0.95), Inches(5.3), Inches(0.05), ACCENT_RED)

points = [
    ("1", "Emboli are detached masses (solid/liquid/gas) that travel and obstruct distant vessels."),
    ("2", "DVT is the source of >95% of pulmonary emboli - the most common and deadly type."),
    ("3", "Fat embolism syndrome: petechial rash + neuro symptoms 1-3 days post-fracture."),
    ("4", "Amniotic fluid embolism carries ~80% mortality; DIC is a major complication."),
    ("5", "Air embolism: >100 mL fatal; decompression sickness treated with hyperbaric O2."),
    ("6", "Infarction results when collateral circulation is insufficient to compensate."),
    ("7", "Red infarcts = dual-circulation/venous; White infarcts = end-arterial/solid organs."),
]

for i, (num, text) in enumerate(points):
    row_y = Inches(1.1) + i * Inches(0.73)
    col_txt = [ACCENT_RED, ACCENT_TEAL, ACCENT_GOLD, ACCENT_RED, ACCENT_TEAL, ACCENT_GOLD, ACCENT_RED][i]
    rect(slide, Inches(0.5), row_y, Inches(0.5), Inches(0.55), col_txt)
    textbox(slide, num, Inches(0.5), row_y + Inches(0.04), Inches(0.5), Inches(0.48),
            font_size=18, bold=True, color=WHITE, align=PP_ALIGN.CENTER)
    rect(slide, Inches(1.05), row_y, Inches(11.0), Inches(0.55), DARK_CARD)
    textbox(slide, text, Inches(1.15), row_y + Inches(0.08), Inches(10.8), Inches(0.42),
            font_size=14, color=WHITE)

textbox(slide, "Sources: Robbins & Kumar Basic Pathology | Robbins, Cotran & Kumar Pathologic Basis of Disease",
        Inches(0.5), Inches(7.1), Inches(12.3), Inches(0.28),
        font_size=10, color=LIGHT_GREY, align=PP_ALIGN.CENTER, italic=True)

# ─── SAVE ───────────────────────────────────────────────────────────────────────
output_path = "/tmp/workspace/embolism-ppt/Embolism_Presentation.pptx"
prs.save(output_path)
print(f"\nSaved to: {output_path}")
cd /tmp/workspace/embolism-ppt && python build_ppt.py
find /tmp/skills -name "fetch_images.py" 2>/dev/null; ls /tmp/skills/ 2>/dev/null; ls /tmp/skills/pptx/ 2>/dev/null
find /tmp/skills/pptx/scripts -type f 2>/dev/null; ls /tmp/skills/pptx/scripts/ 2>/dev/null
urllib directly and rebuild:cd /tmp/workspace/embolism-ppt && python3 -c " import urllib.request, os IMAGES = { 'pe_gross': 'https://cdn.orris.care/cdss_images/23abd50643dcdeb51b3d4efc048cd4db536cb8f671091e9fdfec5429ce174803.png', 'pe_ctpa': 'https://cdn.orris.care/cdss_images/pmc_clinical_VQA_582843a21b545e02f3a26eaac9278053feccc14220598829e83f73106fba24b2.jpg', 'pe_saddle': 'https://cdn.orris.care/cdss_images/pmc_clinical_VQA_ca829056c1f86ee30fb414a1e828a2638bc0d0fb0da99bf658c809685977616e.jpg', 'pe_thrombus': 'https://cdn.orris.care/cdss_images/pmc_clinical_VQA_32feef0dd1f6389a6c53e687bfe5e3c22aac189d251fc62ba4cc01eb1af2fe51.jpg', 'fat_emb': 'https://cdn.orris.care/cdss_images/pmc_clinical_VQA_3f44f3ddf8ade42d6f4d50630dcb9065e5354f80ca0dfff790de9df66de8a404.jpg', 'air_emb': 'https://cdn.orris.care/cdss_images/pmc_clinical_VQA_d9d2bf2fcfc0128ee83c855dcf51be115c4f7f43b9ced5df1e470415253e6154.jpg', 'dvt': 'https://cdn.orris.care/cdss_images/pmc_clinical_VQA_e9a7d5612f94d1b863f82d2a250ca06b990bfec2b70aa37683bc8a1a8e72002a.jpg', 'afe_us': 'https://cdn.orris.care/cdss_images/pmc_clinical_VQA_5fe587e656ce97db70e2dd6ccaeb0948e6f167c2bfcd10a3417597ddaedc835c.jpg', } os.makedirs('imgs', exist_ok=True) for key, url in IMAGES.items(): ext = url.split('.')[-1] path = f'imgs/{key}.{ext}' try: urllib.request.urlretrieve(url, path) size = os.path.getsize(path) print(f'OK {key}: {size} bytes') except Exception as e: print(f'FAIL {key}: {e}') "
~/embolism-ppt/build_ppt.py
Successfully replaced 1 instance(s) of the string in '/tmp/workspace/embolism-ppt/build_ppt.py'
~/embolism-ppt/build_ppt.py
Successfully replaced 1 instance(s) of the string in '/tmp/workspace/embolism-ppt/build_ppt.py'
cd /tmp/workspace/embolism-ppt && python build_ppt.py 2>&1
ls -lh /tmp/workspace/embolism-ppt/Embolism_Presentation.pptx && python3 -c " from pptx import Presentation prs = Presentation('/tmp/workspace/embolism-ppt/Embolism_Presentation.pptx') print(f'Slides: {len(prs.slides)}') for i, slide in enumerate(prs.slides, 1): texts = [s.text_frame.text.strip()[:60] for s in slide.shapes if s.has_text_frame and s.text_frame.text.strip()] print(f' Slide {i}: {texts[0] if texts else \"(no text)\"}') print(f' Images: {len([s for s in slide.shapes if s.shape_type == 13])}') "
Embolism Presentation
Presentation · PPTX
| Slide | Title | Images |
|---|---|---|
| 1 | Title Slide - EMBOLISM | Gross pathology PE specimen |
| 2 | What is an Embolism? (Definition) | Extracted pulmonary artery thrombus |
| 3 | Pulmonary Thromboembolism (PE) | Saddle PE on CTPA + DVT ultrasound + acute PE CTPA |
| 4 | Systemic (Arterial) Thromboembolism | CTPA with filling defect |
| 5 | Fat Embolism Syndrome (FES) | MRI brain + retinal ischemia from fat emboli |
| 6 | Amniotic Fluid Embolism (AFE) | POCUS showing particulate matter in right heart |
| 7 | Air / Gas Embolism | CT brain showing intravascular air (cerebral air embolism) |
| 8 | Summary Table - All 6 Types | - |
| 9 | Consequence: Infarction | - |
| 10 | Key Takeaways | - |
- Dark navy background with red/teal/gold accent palette (clinical, professional look)
- All vivid clinical images are real medical photographs/radiology from the medical library
- Color-coded section bars per topic for easy navigation
- Stats callout boxes, data tables, and highlighted key facts throughout
- Source citations from Robbins Pathology on the final slide
Your work impressed me a lott , your just awesome 💯
- Robbins Pathology is just an incredibly thorough source - every embolism type was covered with precise numbers and mechanisms
- The real radiology images (saddle PE on CTPA, cerebral air embolism, DVT ultrasound) made each slide clinically grounded
- The color-coded design (red for PE, teal for systemic, gold for fat, purple for AFE) helps the brain organize the different types