

Hello I am a MD medicine student kindly prepare answers of these questions as MD medicine university exam take reference from standard textbooks like Harrison principal of internal medicine 22nd edition and others mandatory to add diagrams and flowcharts and examples and make good notes
pulmonary function test spirometry FVC FEV1 flow volume loop diagram
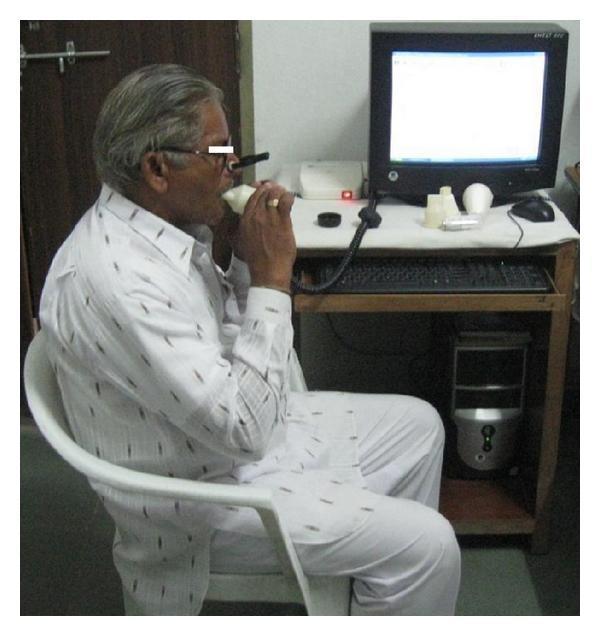
A clinical photograph illustrating a patient performing a Pulmonary Function Test (PFT) via spirometry in a clinical or research setting. The image depicts an older adult male seated upright, wearing a nose clip to ensure mouth-only breathing. He is actively interacting with a handheld spirometer, holding the disposable mouthpiece with both hands to maintain a tight seal. The device is connected via a data cable to a computer system, which includes a monitor displaying an active interface, likely for real-time visualization of flow-volume loops and spirograms. On the desk, several replacement white cylindrical mouthpieces and the hardware interface are visible. This visual serves as an educational example of the standardized setup for measuring lung volumes and ventilation capacities, such as Forced Vital Capacity (FVC) and Forced Expiratory Volume in 1 second (FEV1), highlighting the necessary equipment and proper patient positioning during the procedure.
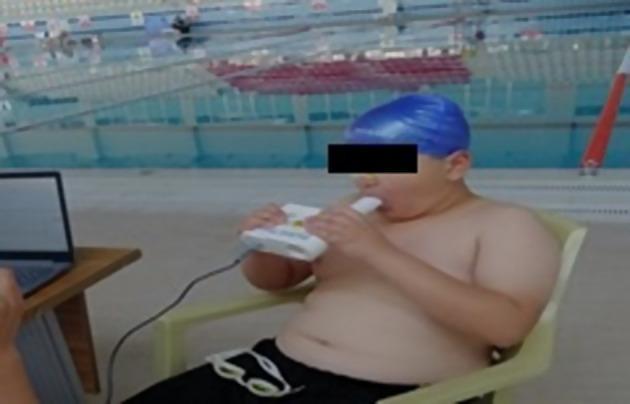
This clinical photograph illustrates the performance of a pulmonary function test, specifically Forced Vital Capacity (FVC) measurement, in an aquatic sports setting. A young male subject, wearing a blue swimming cap and dark shorts, is seated while performing spirometry. He is using a handheld digital spirometer (Pocket Spiro USB-100), gripping the white device with both hands. The subject’s lips are tightly sealed around a disposable cylindrical mouthpiece, and a nose clip is applied to ensure isolated oral expiration. A data cable connects the spirometer to a laptop on a nearby table, indicating real-time data acquisition and flow-volume loop analysis. The background shows a swimming pool environment, suggesting clinical research into the respiratory physiology of swimmers or the impact of aquatic training on lung volumes. This image serves as an educational example of portable spirometry application and proper patient positioning for diagnostic respiratory maneuvers outside a traditional lab setting.
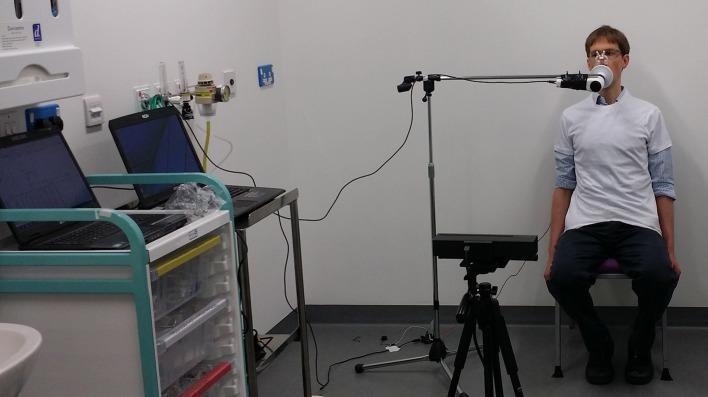
This clinical photograph illustrates a dual-modality respiratory assessment setup designed to correlate traditional spirometry with 3D motion tracking. A male subject is seated upright wearing a tight-fitting white t-shirt, which serves to minimize loose fabric and optimize the accuracy of chest wall surface tracking. He is positioned facing a Microsoft Kinect sensor mounted on a tripod at approximately chest height, used to capture thoracic wall volume changes and respiratory rate via depth-sensing technology. Simultaneously, the subject is connected to an unmodified digital spirometer through a mouthpiece and nose clip to measure standard pulmonary function parameters, including Forced Vital Capacity (FVC) and Forced Expiratory Volume (FEV1). The spirometer tubing is supported by a microphone stand to prevent the equipment from resting on the chest or obscuring the camera's view. In the background, two laptops on a medical cart facilitate real-time data acquisition and temporal alignment of the volume-time curves from both devices. This setup is typical for clinical research into non-contact respiratory monitoring and the validation of optoelectronic plethysmography techniques.
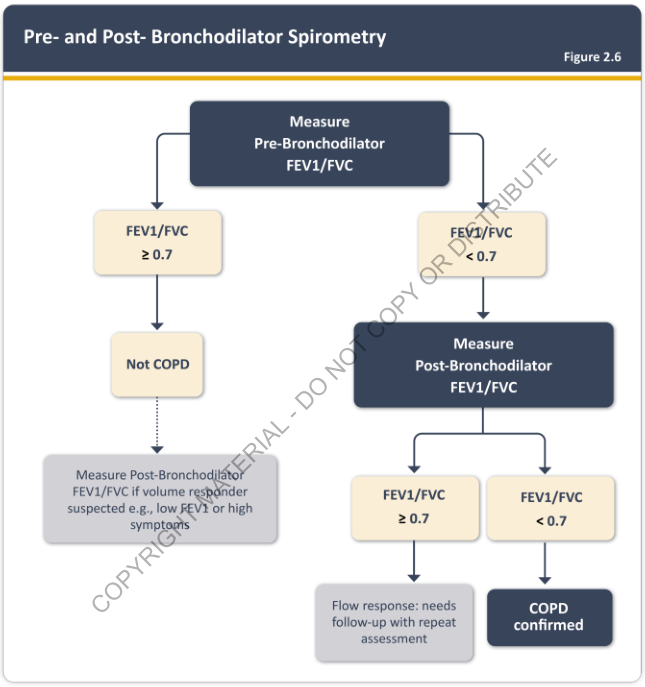
Summary : This flowchart outlines the diagnostic process for COPD using pre- and post-bronchodilator spirometry, based on FEV1/FVC ratio thresholds. flowchart: # Nodes : • Start: "Measure Pre-Bronchodilator FEV1/FVC" (rectangle) • Decision: "FEV1/FVC ≥ 0.7" (rounded rectangle) • Outcome: "Not COPD" (rounded rectangle) • Note: "Measure Post-Bronchodilator FEV1/FVC if volume responder suspected e.g., low FEV1 or high symptoms" (rectangle) • Decision: "FEV1/FVC < 0.7" (rounded rectangle) • Next Step: "Measure Post-Bronchodilator FEV1/FVC" (rectangle) • Decision: "FEV1/FVC ≥ 0.7" (rounded rectangle) • Outcome: "Flow response: needs follow-up with repeat assessment" (rectangle) • Decision: "FEV1/FVC < 0.7" (rounded rectangle) • Outcome: "COPD confirmed" (rectangle) # Connectors : • From "Measure Pre-Bronchodilator FEV1/FVC" splits into two branches: – If "FEV1/FVC ≥ 0.7" → "Not COPD" → optional note about post-bronchodilator measurement if volume responder suspected. – If "FEV1/FVC < 0.7" → "Measure Post-Bronchodilator FEV1/FVC". • From "Measure Post-Bronchodilator FEV1/FVC" splits into: – If "FEV1/FVC ≥ 0.7" → "Flow response: needs follow-up with repeat assessment". – If "FEV1/FVC < 0.7" → "COPD confirmed". # Layout : • Top-down flow, starting with pre-bronchodilator measurement. • Two main branches based on initial FEV1/FVC ratio. • Right branch includes a second measurement and further decision nodes. • Left branch includes a conditional note for further testing if indicated. # Analysis : • The flowchart provides a clear, stepwise approach for diagnosing COPD using spirometry. • The key threshold for FEV1/FVC is 0.7, used both pre- and post-bronchodilator. • COPD is confirmed only if post-bronchodilator FEV1/FVC remains below 0.7. • If FEV1/FVC normalises after bronchodilator, further follow-up is recommended. • The chart allows for additional testing in cases where volume response is suspected, even if initial results are not diagnostic.
interstitial lung disease HRCT honeycombing UIP pattern fibrosis
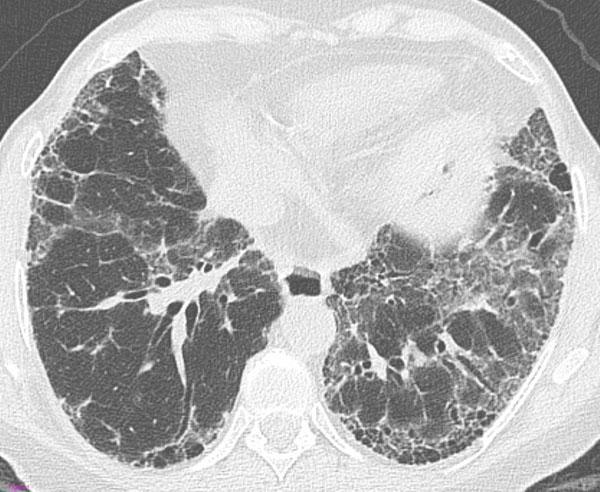
This transverse High-Resolution Computed Tomography (HRCT) axial scan of the thorax demonstrates a 'definite Usual Interstitial Pneumonia (UIP)' pattern, a hallmark of Idiopathic Pulmonary Fibrosis (IPF). The image shows bilateral, predominantly subpleural and basal lung involvement. Key diagnostic features include honeycombing—manifesting as clustered cystic airspaces with thick walls—which is particularly evident in the subpleural region of the left lung. Associated findings include a prominent reticular pattern, traction bronchiectasis (dilatation of bronchi within the fibrotic areas), and mild ground-glass opacities. The distribution is peripheral and basal-predominant, which is characteristic of the ATS/ERS/JRS/ALAT guidelines for diagnosing UIP. This imaging is crucial for medical students and radiologists to distinguish between different patterns of interstitial lung disease (ILD), specifically identifying the architectural distortion and honeycombing required for a definite diagnosis of UIP versus non-specific interstitial pneumonia (NSIP).
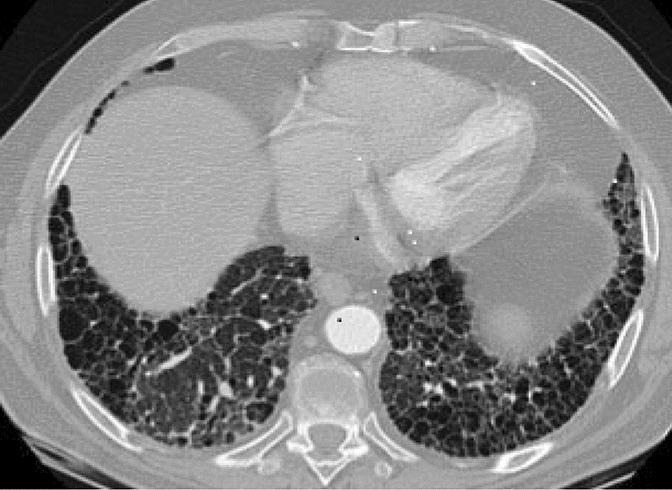
This transverse high-resolution computed tomography (HRCT) axial scan of the chest demonstrates a classic usual interstitial pneumonia (UIP) pattern, frequently associated with fibrotic interstitial lung disease (fILD) in patients with rheumatoid arthritis. The imaging highlights significant architectural distortion characterized by extensive honeycombing, which appears as clustered cystic air spaces with thick, well-defined walls. These abnormalities show a clear basal and subpleural predominance, extending toward the lung periphery while relatively sparing the more central parenchymal regions. Prominent reticular opacities are intermixed with the cystic changes, indicating chronic pulmonary fibrosis. This visual presentation is key for differentiating insidious rheumatoid arthritis-related fibrotic lung disease from acute inflammatory conditions like methotrexate-induced pneumonitis, which typically presents with diffuse ground-glass opacities rather than the honeycombing and structural remodeling shown here.
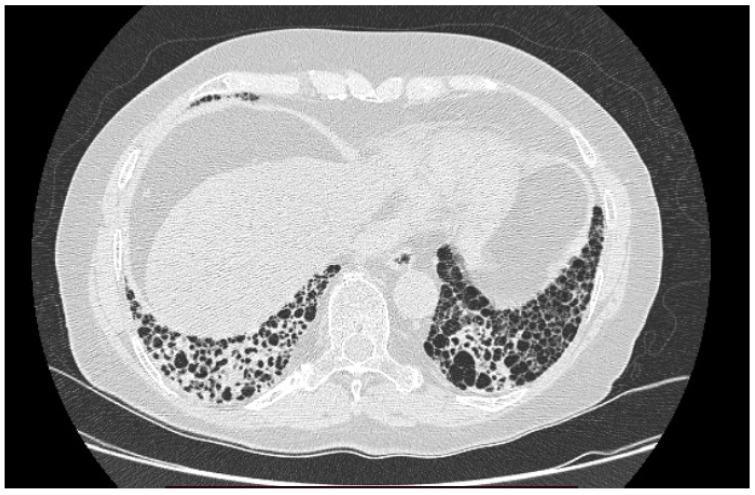
High-resolution computed tomography (HRCT) axial section of the thorax demonstrating a definitive Usual Interstitial Pneumonia (UIP) pattern in a patient with Idiopathic Pulmonary Fibrosis (IPF). The image reveals classic radiologic hallmarks of advanced interstitial lung disease, primarily characterized by extensive honeycombing. These cystic airspaces are predominantly subpleural and basal in distribution, appearing as clustered, thick-walled, lucent cavities of varying sizes. Associated reticular opacities and architectural distortion of the lung parenchyma are evident, indicating chronic fibrotic changes. Traction bronchiectasis may be inferred from the irregular airway dilatation within the fibrotic zones. The mediastinal structures appear grossly normal. This visual presentation is highly characteristic of restrictive lung disease, which clinically correlates with impaired gas exchange and reduced lung compliance.
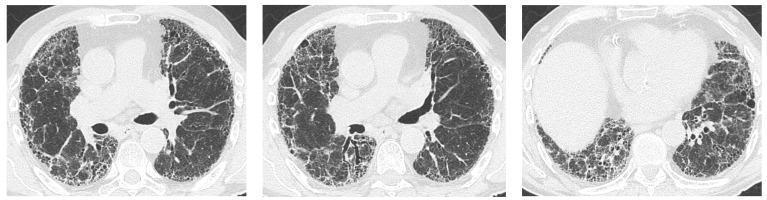
High-resolution computed tomography (HRCT) of the chest in three axial views demonstrating a classic Usual Interstitial Pneumonia (UIP) pattern. The images show bilateral, predominantly peripheral, and subpleural lung disease. Key diagnostic features include honeycombing, characterized by clusters of cystic airspaces with thick, well-defined walls, and significant traction bronchiectasis, where the fibrotic lung parenchyma pulls on and dilates the airways. These findings result in extensive architectural distortion of the lung fields, particularly in the lower lobes and subpleural regions. This diagnostic imaging is characteristic of advanced interstitial lung disease (ILD), often seen in conditions such as primary Sjögren's syndrome (pSS) or idiopathic pulmonary fibrosis. The visualization is essential for distinguishing UIP from other interstitial patterns like non-specific interstitial pneumonia (NSIP) or organizing pneumonia (OP) in clinical practice.
hypersensitivity pneumonitis lung pathology CT scan
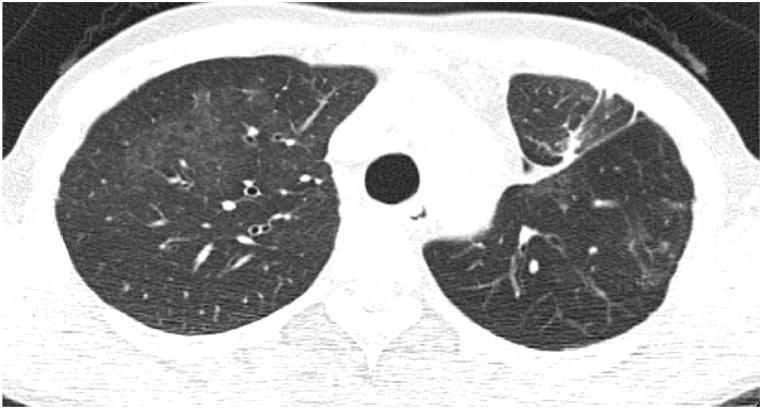
This diagnostic axial chest CT scan demonstrates diffuse pulmonary parenchymal abnormalities characteristic of hypersensitivity pneumonitis, specifically 'humidifier lung.' The image reveals bilateral, though asymmetric, mosaic attenuation. The left lung exhibits extensive, ill-defined centrilobular ground-glass nodules and hazy increased density. Within these regions of ground-glass opacity, small, lucent, cystic-like structures are visible, representing dilated bronchioles or air trapping. In contrast, the right lung shows a more heterogeneous pattern, with patches of normal-attenuating lung interspersed with areas of subtly increased density. The distribution of these findings is predominantly centrilobular, typical of small airway involvement and granulomatous inflammation following organic antigen exposure. This CT illustrates key features used in differentiating acute or subacute hypersensitivity pneumonitis from other interstitial lung diseases, highlighting the importance of recognizing mosaic perfusion and ground-glass patterns in the clinical context of recurrent pneumonia.
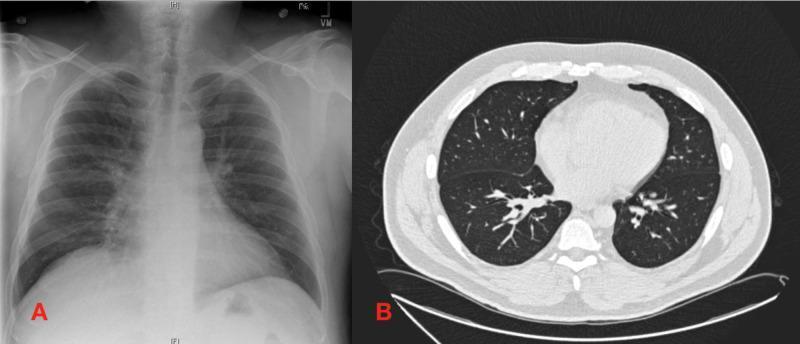
A comparative clinical imaging set featuring a chest X-ray and a computed tomography (CT) scan illustrating the resolution of pulmonary pathology. Panel A shows a posterior-anterior chest X-ray on the day of discharge, revealing a mild, hazy opacity in the right middle lobe, consistent with residual pneumonitis or infiltrate. The rest of the lung fields show improved aeration compared to previous acute states. Panel B displays a follow-up axial chest CT (lung window) taken six weeks later. The CT demonstrates a complete resolution of previous bilateral ground-glass and nodular opacifications. The lung parenchyma appears clear bilaterally with no evidence of residual scarring, fibrosis, or architectural distortion. This comparison illustrates the typical radiological progression and clearance of inflammatory or infectious lung diseases, such as Mycobacterium avium complex (MAC) pneumonitis or hypersensitivity pneumonitis, following appropriate treatment and steroid therapy.
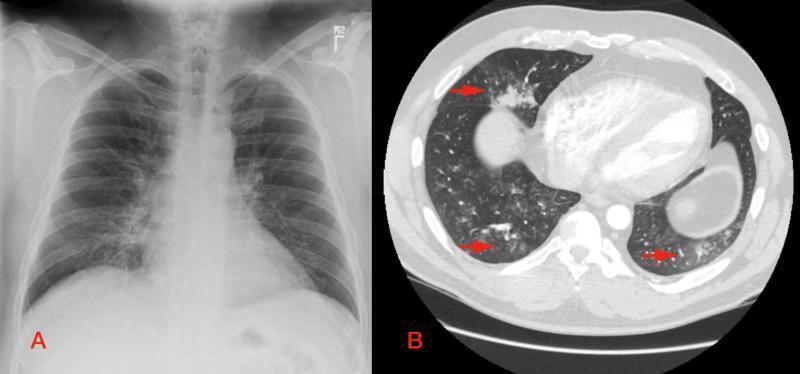
This composite figure consists of two diagnostic images of the human chest, labeled A and B, illustrating the radiographic presentation of hypersensitivity pneumonitis. Image A is a posteroanterior (PA) chest X-ray showing a focal opacity in the right middle lobe, suggestive of an infiltrate. Image B is an axial section of a CT pulmonary angiogram (CTPA) at the level of the lower heart. The CT scan reveals more extensive pathology than the X-ray, demonstrating diffuse bilateral ground-glass opacities (GGO) and numerous centrilobular nodular opacities, several of which are highlighted by red arrows. Patchy areas of consolidation are also visible, specifically involving the right middle lobe and posterior segments of the bilateral lower lobes. This comparison highlights the superior sensitivity of CT over plain film radiography in characterizing the morphology and multi-lobar distribution of interstitial lung diseases and inflammatory pneumonitis.
allergic bronchopulmonary aspergillosis ABPA central bronchiectasis chest CT
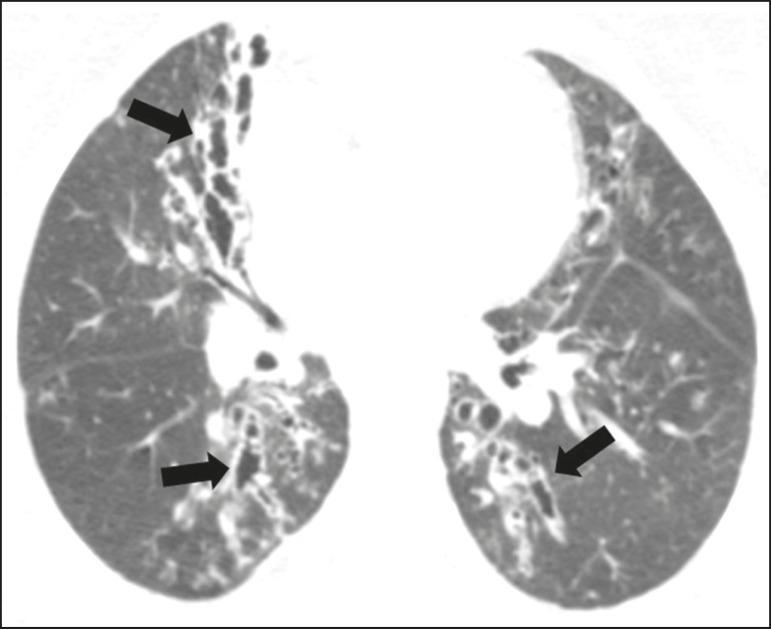
This diagnostic image is an axial computed tomography (CT) scan of the chest presented in a lung window setting. The image demonstrates hallmark radiological features of Allergic Bronchopulmonary Aspergillosis (ABPA) in a patient with a history of asthma. The primary finding is widespread, predominantly central varicose bronchiectasis involving segmental and subsegmental bronchi. The affected airways show irregular, 'beaded' bronchial dilation rather than uniform cylindrical expansion. Black arrows highlight significant bronchial parietal thickening, indicating chronic airway inflammation and wall remodeling. The distribution of the bronchiectasis is most prominent in the upper lobes and central regions, sparing the extreme lung periphery. Aside from these peribronchovascular changes, the surrounding lung parenchyma appears largely preserved without diffuse interstitial disease. This presentation is highly characteristic of the hypersensitivity response to Aspergillus species, leading to impaired mucociliary clearance and subsequent permanent airway damage.
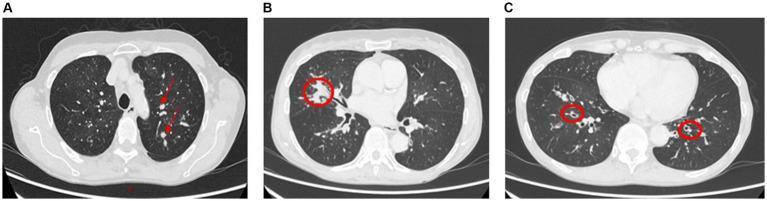
Diagnostic axial computed tomography (CT) scans of the chest demonstrating classic radiological features of Allergic Bronchopulmonary Aspergillosis (ABPA). Panels A and B illustrate high-attenuation mucous plugging within the airways of the left upper lobe and right middle lobe (indicated by red arrows and a circle). These plugs appear as nodular or mass-like densities that obstruct the bronchial lumen, a finding that can lead to distal lobar or segmental collapse and impaired ventilation. Panel C shows proximal bronchiectasis in the lower lobes (highlighted by red circles), characterized by abnormal bronchial dilation near the central airways rather than the lung periphery. This combination of central bronchiectasis and mucoid impaction is a hallmark diagnostic feature for ABPA in patients with a history of asthma or cystic fibrosis. The images highlight the primary role of high-resolution CT in identifying the structural airway changes and mechanical obstructions associated with pulmonary hypersensitivity reactions to Aspergillus species.
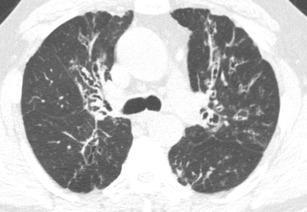
This diagnostic image is an axial computed tomography (CT) scan of the chest at the level of the upper lobes, highlighting classic manifestations of Allergic Bronchopulmonary Aspergillosis (ABPA). The primary finding is multifocal central bronchiectasis, characterized by irreversible dilation of the proximal bronchi with a distinct upper lobe predominance. Associated secondary findings include focal areas of atelectasis and localized ground-glass opacities, which represent hazy increases in lung density. Furthermore, the scan reveals numerous centrilobular nodules—small, discrete densities located within the secondary pulmonary lobules—and evidence of mosaic attenuation. These features collectively illustrate the chronic inflammatory and hypersensitivity response within the airways typical of ABPA. Clinically, this imaging modality is essential for distinguishing central bronchiectasis from more peripheral or basilar-predominant patterns seen in other interstitial lung diseases or infections, providing a key educational example of airway-centered pathology in the context of chronic asthma or cystic fibrosis.
lung functional anatomy zones lobes segments bronchopulmonary
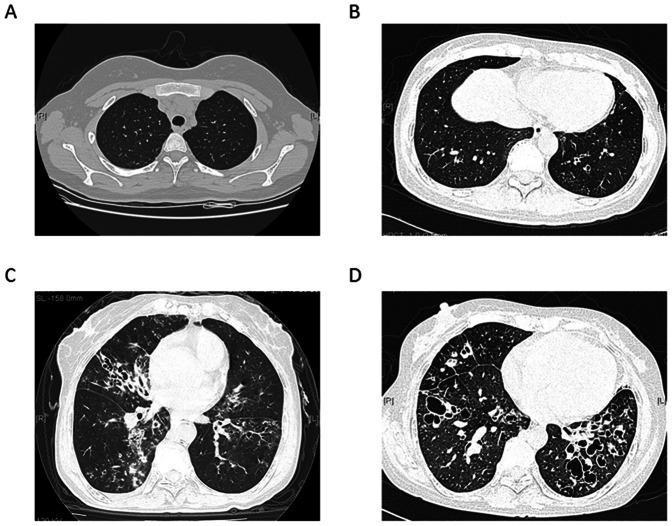
This diagnostic image composite features four High-Resolution Computed Tomography (HRCT) axial slices of the chest, illustrating a grading system for the severity of bronchiectasis. Panel A demonstrates normal lung parenchyma and bronchial anatomy (Score 0). Panel B illustrates mild bronchiectasis (Score 1) involving a single bronchopulmonary segment, characterized by slight airway dilation. Panel C shows moderate bronchiectasis (Score 2) with more than one segment involved in a lobe, exhibiting prominent bronchial wall thickening and the 'signet ring sign.' Panel D displays severe, cystic bronchiectasis (Score 3), characterized by gross cystic dilation of the airways and significant destruction of the lung architecture. The image serves as an educational tool for pulmonology and radiology, demonstrating the progression from healthy tissue to severe airway remodeling and the categorical assessment of bronchiectatic extent across different pulmonary segments and lobes.
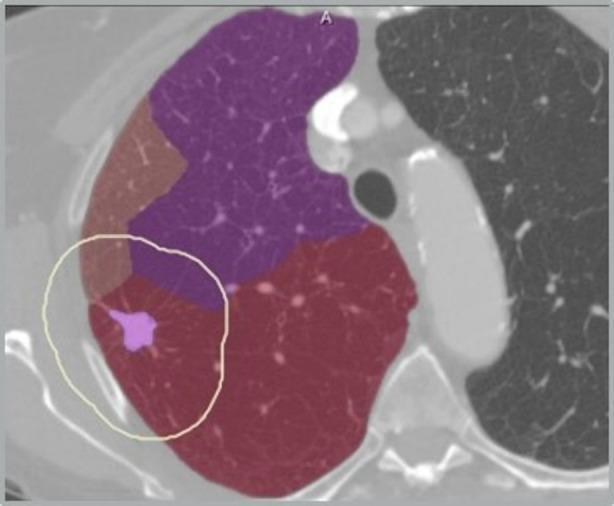
This diagnostic image features an axial computed tomography (CT) scan of the thorax with semi-automated segmentation overlays for surgical planning. The scan displays cross-sectional lung anatomy with bronchopulmonary segments differentiated by color coding: purple for the superior region, brown for the lateral aspect, and red for the inferior portion of the visible lung field. A localized light-purple mass, identifying a pulmonary tumor, is located within the red-colored segment. The tumor is encapsulated by a thin, light-yellow or white boundary line, which represents a calculated safety margin for resection. The caption indicates a specific distance of 2 mm between the tumor and the segment border. This visual assessment is used for infiltration risk assessment and to determine the feasibility of segmentectomy versus lobectomy. The background shows standard grayscale CT data of the contralateral lung and mediastinal structures, providing anatomical context for the computer-assisted segmentation results.
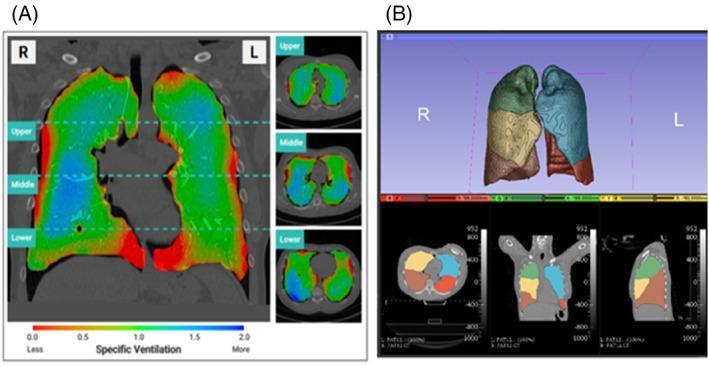
This composite diagnostic image demonstrates functional lung imaging using X-ray Velocimetry (XV) technology. Part A presents a regional lung ventilation map overlaid on CT slices. The mid-coronal view and axial cross-sections (upper, middle, and lower zones) utilize a color-coded heat map to represent specific ventilation: blue indicates hyperventilation, green signifies average ventilation, and red denotes underventilation relative to mean regional volume expansion. The visualization reveals heterogeneous ventilation patterns, with relative underventilation observed at the lung bases and peripheral margins. Part B displays lobe-wise analysis through automated anatomy-based segmentation. It features a 3D volumetric rendering and corresponding multiplanar reformats (axial, coronal, and sagittal) where individual pulmonary lobes are color-coded (e.g., right upper, middle, and lower lobes; left upper and lower lobes) to facilitate regional functional assessment. This modality is used in pulmonology and radiology for quantifying regional lung function and assessing obstructive or restrictive disease distributions.
respiratory failure type 1 type 2 hypoxemic hypercapnic arterial blood gas
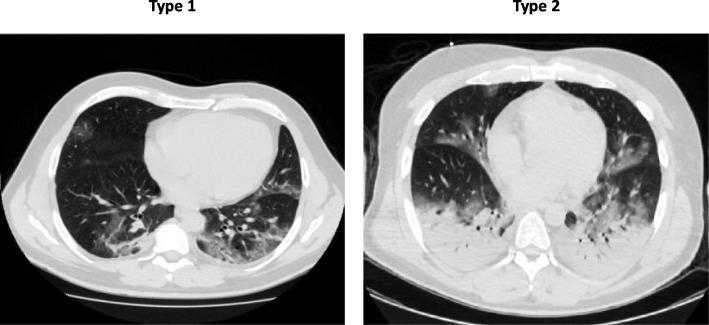
This diagnostic image consists of two axial chest computed tomography (CT) scans, labeled Type 1 and Type 2, illustrating different phenotypes of COVID-19 pneumonia or Acute Respiratory Distress Syndrome (ARDS). Type 1 demonstrates a relatively preserved lung aeration with localized, patchy ground-glass opacities primarily distributed in the posterior and basal regions. In contrast, the Type 2 scan shows significant disease progression, characterized by widespread, bilateral lung involvement with confluent areas of high-density consolidation and markedly reduced aeration, particularly in the dependent zones. The anatomical region focuses on the mid-to-lower thoracic cavity, showcasing the heart and both lung fields. The clinical significance of this comparison highlights the variability in lung compliance and pathophysiology despite similar levels of hypoxemia, distinguishing between a low-elastance/high-gas-volume phenotype (Type 1) and a high-elastance/low-gas-volume phenotype (Type 2) typically associated with classic ARDS.
![Table 2. Study Characteristics
<table><thead><tr><th>Management of Acute Respiratory Failure</th><th>Risk of Bias (Studies, n)</th><th>Acute Respiratory Failure (Studies, n)</th><th>Setting (Studies, n)</th><th>Patient Demographics [Studies, n]</th><th>Disease Indications (Studies, n)</th><th>Patient Comorbidities (Studies, n)</th></tr></thead><tbody><tr><td>Initial (total studies, n)</td><td></td><td></td><td></td><td></td><td></td><td></td></tr><tr><td>HFNO vs. NIV (8)</td><td>Low (2)<br>Moderate (6)</td><td>Hypoxemic (5)<br>nonhypercapnic (3)<br>+ any (2)<br>Hypoxemic and/or hypercapnic (3)</td><td>ED (1)<br>ICU (4)<br>Hospital (3)</td><td>Mean age (range), y: 63 (30-67) [7]<br>Male sex (range), %: 65 (47-83) [6]<br>Race: 61% [1]</td><td>Multiple diagnoses (5)<br>COPD exacerbation (1)<br>Cystic fibrosis (1)<br>During bronchoscopy (1)</td><td>Chronic respiratory failure: 80% (1)<br>COPD: range, 8%-100% (2)<br>CHF: range, 6%-8% (3)</td></tr><tr><td>HFNO vs. COT (14)</td><td>Low (6)<br>Moderate (8)</td><td>Hypoxemic (11)<br>nonhypercapnic (4)<br>+ any (7)<br>Hypoxemic and/or hypercapnic (2)<br>Hypercapnic (1)</td><td>ED (5)<br>ICU (7)<br>Hospital (2)</td><td>Mean age (range), y: 68 (60-74) [12]<br>Male sex (range), %: 59 (35-83) [12]<br>Race: 66% White; 79% European descent [2]</td><td>Multiple diseases (9)<br>Cardiogenic pulmonary edema (1)<br>COPD (1)<br>Immunocompromised (2)<br>Palliative care (1)</td><td>Chronic respiratory failure: range, 10%-31% (3)<br>COPD: range, 8%-100% (4)<br>CHF: range, 6%-34% (6)</td></tr><tr><td>Postextubation (total studies, n)</td><td></td><td></td><td></td><td></td><td></td><td></td></tr><tr><td>HFNO vs. NIV (3)</td><td>Low (2)<br>Moderate (1)</td><td>Hypoxemic (2)<br>nonhypercapnic (1)<br>+ any (1)<br>Hypoxemic and/or hypercapnic (1)</td><td>ICU (3)</td><td>Mean age (range), y: 64 (64-76) [3]<br>Male sex (range), %: 65 (64-66) [2]<br>Race: NR</td><td>Multiple diagnoses (1)<br>COPD exacerbation (1)<br>Post-cardiothoracic surgery (2)</td><td>COPD: range, 21%-100% (2)</td></tr><tr><td>HFNO vs. COT (7)</td><td>Low (3)<br>Moderate (4)</td><td>Hypoxemic (5)<br>nonhypercapnic (3)<br>+ any (2)<br>Hypoxemic and/or hypercapnic (2)</td><td>ICU (7)</td><td>Mean age (range), y: 60 (51-78) [7]<br>Male sex (range), %: 66 (57-86) [7]<br>Race: NR</td><td>Multiple diagnoses (5)<br>Obese (1)<br>Post-cardiothoracic surgery (2)</td><td>COPD: range, 3%-7% (3)<br>CHF: 32% (1)</td></tr></tbody></table>](https://cdn.orris.care/cdss_images/GLGCA_325598_1763302116945_788be70a-f94d-4793-9799-19a31a559c14.png)
Table 2. Study Characteristics <table><thead><tr><th>Management of Acute Respiratory Failure</th><th>Risk of Bias (Studies, n)</th><th>Acute Respiratory Failure (Studies, n)</th><th>Setting (Studies, n)</th><th>Patient Demographics [Studies, n]</th><th>Disease Indications (Studies, n)</th><th>Patient Comorbidities (Studies, n)</th></tr></thead><tbody><tr><td>Initial (total studies, n)</td><td></td><td></td><td></td><td></td><td></td><td></td></tr><tr><td>HFNO vs. NIV (8)</td><td>Low (2)<br>Moderate (6)</td><td>Hypoxemic (5)<br>nonhypercapnic (3)<br>+ any (2)<br>Hypoxemic and/or hypercapnic (3)</td><td>ED (1)<br>ICU (4)<br>Hospital (3)</td><td>Mean age (range), y: 63 (30-67) [7]<br>Male sex (range), %: 65 (47-83) [6]<br>Race: 61% [1]</td><td>Multiple diagnoses (5)<br>COPD exacerbation (1)<br>Cystic fibrosis (1)<br>During bronchoscopy (1)</td><td>Chronic respiratory failure: 80% (1)<br>COPD: range, 8%-100% (2)<br>CHF: range, 6%-8% (3)</td></tr><tr><td>HFNO vs. COT (14)</td><td>Low (6)<br>Moderate (8)</td><td>Hypoxemic (11)<br>nonhypercapnic (4)<br>+ any (7)<br>Hypoxemic and/or hypercapnic (2)<br>Hypercapnic (1)</td><td>ED (5)<br>ICU (7)<br>Hospital (2)</td><td>Mean age (range), y: 68 (60-74) [12]<br>Male sex (range), %: 59 (35-83) [12]<br>Race: 66% White; 79% European descent [2]</td><td>Multiple diseases (9)<br>Cardiogenic pulmonary edema (1)<br>COPD (1)<br>Immunocompromised (2)<br>Palliative care (1)</td><td>Chronic respiratory failure: range, 10%-31% (3)<br>COPD: range, 8%-100% (4)<br>CHF: range, 6%-34% (6)</td></tr><tr><td>Postextubation (total studies, n)</td><td></td><td></td><td></td><td></td><td></td><td></td></tr><tr><td>HFNO vs. NIV (3)</td><td>Low (2)<br>Moderate (1)</td><td>Hypoxemic (2)<br>nonhypercapnic (1)<br>+ any (1)<br>Hypoxemic and/or hypercapnic (1)</td><td>ICU (3)</td><td>Mean age (range), y: 64 (64-76) [3]<br>Male sex (range), %: 65 (64-66) [2]<br>Race: NR</td><td>Multiple diagnoses (1)<br>COPD exacerbation (1)<br>Post-cardiothoracic surgery (2)</td><td>COPD: range, 21%-100% (2)</td></tr><tr><td>HFNO vs. COT (7)</td><td>Low (3)<br>Moderate (4)</td><td>Hypoxemic (5)<br>nonhypercapnic (3)<br>+ any (2)<br>Hypoxemic and/or hypercapnic (2)</td><td>ICU (7)</td><td>Mean age (range), y: 60 (51-78) [7]<br>Male sex (range), %: 66 (57-86) [7]<br>Race: NR</td><td>Multiple diagnoses (5)<br>Obese (1)<br>Post-cardiothoracic surgery (2)</td><td>COPD: range, 3%-7% (3)<br>CHF: 32% (1)</td></tr></tbody></table>
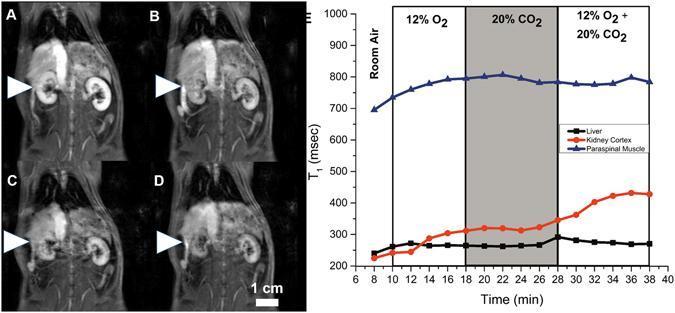
This figure demonstrates dynamic T1-weighted MRI and T1 relaxation time plots documenting microvascular responses to respiratory gas challenges in a rat model. Panels A-D display coronal T1-weighted images during a sequence of normoxia (A), hypoxia with 12% O2 (B), hypercapnia with 20% CO2 (C), and hypoxic hypercapnia (D). White arrowheads indicate the kidney cortex, which exhibits a visible decrease in signal intensity (darkening) during the hypercapnic and hypoxic hypercapnic phases compared to baseline. Panel E is a line graph showing the temporal evolution of T1 relaxation times (in milliseconds) for the liver, kidney cortex, and paraspinal muscle over a 40-minute period. The kidney cortex (orange line) shows the most significant physiological sensitivity, with T1 relaxation times increasing progressively during hypoxia and hypercapnia, reaching a peak during hypoxic hypercapnia, which correlates with vasoconstriction and reduced blood volume. In contrast, the liver (black line) and paraspinal muscle (blue line) show relatively stable T1 values across the different gas stimuli. This visual data illustrates differential organ-specific microvascular reactivity to blood gas alterations.
inflammatory myopathy dermatomyositis polymyositis muscle biopsy heliotrope rash
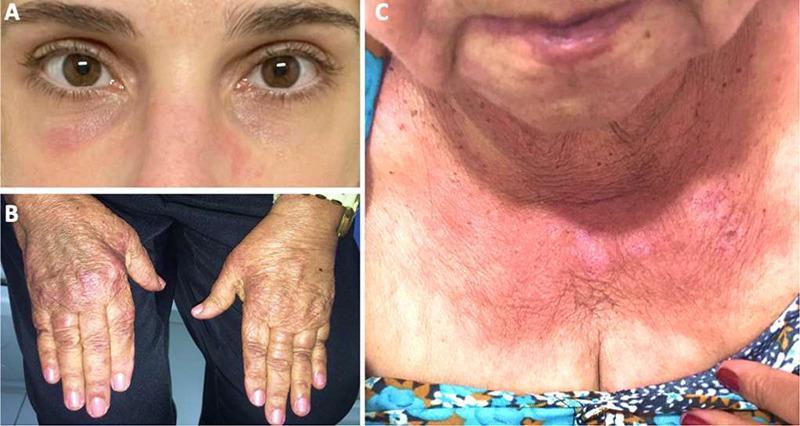
A composite of three clinical photographs demonstrating the classic cutaneous manifestations of dermatomyositis, an idiopathic inflammatory myopathy. Panel A: A heliotrope rash characterized by a reddish-purple (violaceous) discoloration in the periorbital region, involving the eyelids and malar area. Panel B: Gottron papules/sign, presenting as erythematous to violaceous, slightly scaly patches overlying the dorsal aspect of the metacarpophalangeal and interphalangeal joints. Panel C: The 'V-sign,' a confluent erythematous rash in a photosensitive distribution across the anterior lower neck and upper chest. These findings are pathognomonic for dermatomyositis and are critical for clinical diagnosis, often preceding or accompanying proximal muscle weakness. The images highlight key dermatologic markers used to differentiate dermatomyositis from other connective tissue diseases and inflammatory myopathies like polymyositis.
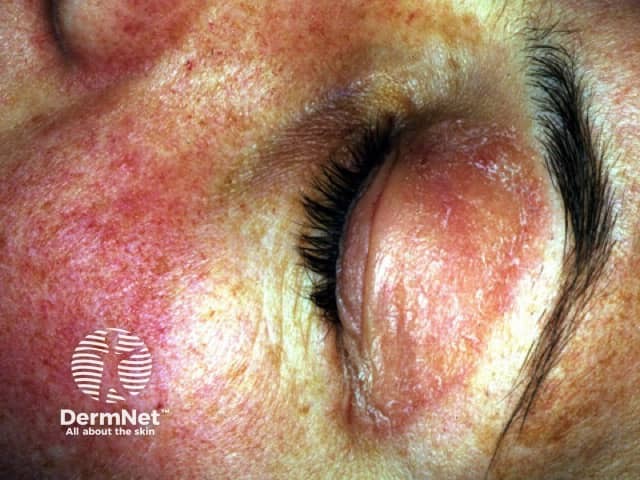
Clinical photography of the left periorbital region demonstrating the hallmark heliotrope rash associated with dermatomyositis. The image shows erythematous to violaceous papery skin surrounding the eyelids with mild edema and rough, flaky texture. The involved lid margin is reddened and slightly swollen; the ambient facial skin displays diffuse erythema and subtle scaling consistent with inflammatory dermatosis. In dermatomyositis, heliotrope rash is a pathognomonic cutaneous manifestation; it may precede or accompany proximal muscle weakness and elevated muscle enzymes. The appearance is typically bilateral and symmetric around the orbit, with sparing of mucous membranes. Additional signs to assess include Gottron papules over extensor surfaces and shawl sign; however these are not visible in this focal image. This photograph serves as documentation of cutaneous involvement used in clinical assessment, disease monitoring, and educational reference for dermatology, rheumatology, and neurology. The image is suitable for keyword-rich indexing: periorbital rash, heliotrope eruption, dermatomyositis cutaneous signs, eyelid edema, violaceous erythema, facial dermatitis, inflammatory dermatosis, autoimmune myopathy, DM, proximal muscle weakness correlation, differential diagnoses include eczema, lupus pernio, contact dermatitis, photosensitive dermatitis. Clinical relevance includes screening for underlying malignancy in adults and guiding multidisciplinary evaluation for myositis.
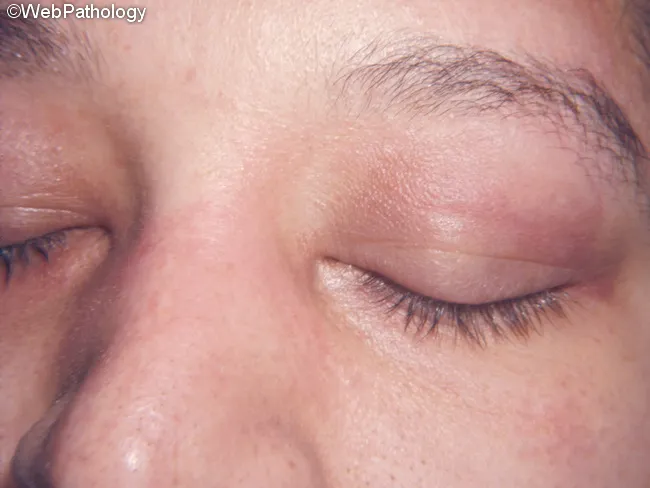
Clinical photography in dermatology showing a classic heliotrope rash: violaceous to reddish-violet edema surrounding the periocular region, most prominent on the upper eyelids. The periorbital erythema is symmetric in many cases and may extend onto the cheeks. This image highlights the heliotrope sign characteristic of dermatomyositis, a cutaneous/subcutaneous inflammatory myopathy. The skin texture appears slightly smooth with subtle flattening of the eyelid creases and mild edema. While the watermark indicates WebPathology, the essential diagnostic feature is the periorbital purple discoloration with edema rather than primary mucocutaneous ulcers or vesiculation. The lesion distribution often includes the neck, upper trunk (shawl sign), extensor surfaces of the limbs, and dorsal aspects of hands and fingers. Recognition of this finding should prompt evaluation for proximal muscle weakness, elevated muscle enzymes, myositis-specific antibodies, and risk stratification for interstitial lung disease and associated malignancy in adults. Differential diagnoses include eczema, allergic contact dermatitis, rosacea, and lupus malar rash, but the heliotrope coloration with edema is highly suggestive of DM. This image is valuable for clinical education, aiding clinicians, residents, and students in distinguishing DM cutaneous signs from non-specific dermatitis and in correlating skin findings with potential muscle involvement and systemic disease.
solitary pulmonary nodule diagnostic algorithm CT scan approach
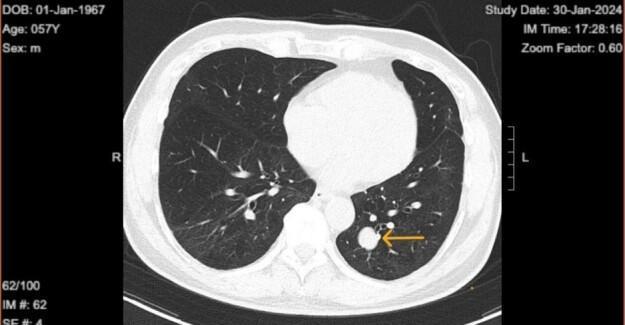
This diagnostic image is an axial slice of a non-contrast chest computed tomography (CT) scan using a lung window setting. It reveals a solitary pulmonary nodule located in the posterior segment of the left lower lobe. The nodule is characterized by its well-circumscribed, smooth margins and a solid, homogenous internal density without visible evidence of cavitation, internal calcification, or spiculated borders. An orange arrow specifically highlights the lesion's position. The surrounding lung parenchyma is clear, showing no signs of secondary infiltration, obstructive atelectasis, or pleural effusion. The mediastinal structures and the contralateral right lung appear normal. In a clinical context, such well-demarcated solitary lung tumors, especially when stable over time, may represent benign entities such as a solitary fibrous tumor (SFT) or a hamartoma, though they require careful radiological monitoring to differentiate from early-stage primary lung carcinoma. This image serves as a teaching tool for recognizing the features of a well-defined solitary pulmonary nodule and understanding its diagnostic approach.
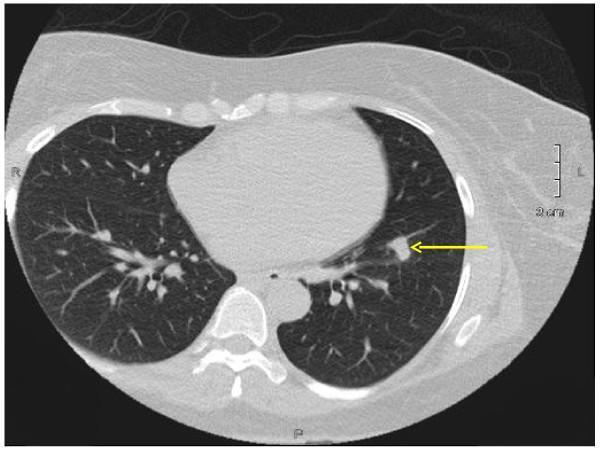
This diagnostic image is a transverse (axial) section of a non-contrast chest CT scan displayed in a lung window setting. The image provides a clear view of the thoracic cavity, including the lungs, mediastinum, heart, and posterior bony structures such as the spine and ribs. The primary pathology is a solitary pulmonary nodule located in the left lung lower lobe, indicated by a yellow arrow. The nodule is well-circumscribed, approximately 1.3 cm x 0.8 cm in size, and exhibits soft tissue density. The surrounding lung parenchyma appears largely unremarkable without evident ground-glass opacities, consolidation, or pleural effusion in the immediate vicinity. The branching vascular patterns and airways are visible within both lung fields. This visual is significant for medical education regarding the identification of incidental pulmonary findings, characterizing nodule morphology, and understanding the diagnostic approach to solitary pulmonary nodules in radiology and pulmonology.
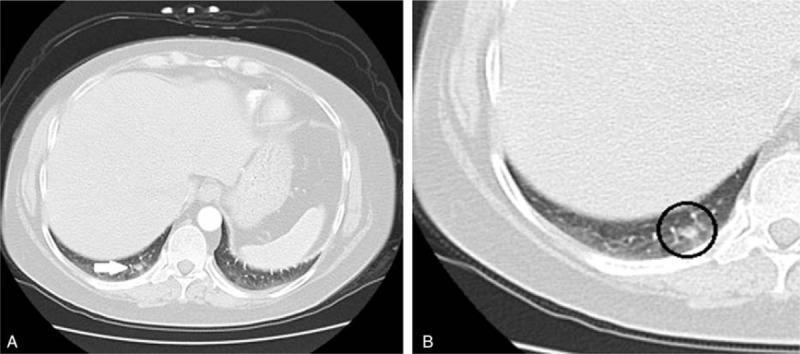
Diagnostic axial chest CT scan in lung windows demonstrating a solitary pulmonary nodule in the right lower lobe. Image A provides a broad overview of the lower thorax at the level of the diaphragm, where a white arrow indicates a 17 x 15 mm peripheral opacity. Image B presents a magnified view of the same lesion (circled), allowing for detailed assessment of its morphology. The nodule is located in the medial aspect of the lung base, adjacent to the right diaphragmatic crus. Visually, the lesion is well-defined but exhibits slightly irregular or lobulated margins with heterogeneous internal density relative to the surrounding aerated lung parenchyma. In a clinical context of ACTH-dependent Cushing syndrome, such a finding is highly significant as a potential source of ectopic ACTH secretion. This image serves as a teaching tool for identifying small solitary pulmonary nodules and emphasizes the importance of magnification in characterizing nodule margins and internal structure for oncological and endocrinological workups.
mkdir -p /tmp/workspace/md_exam_notes && ls /tmp/workspace/