
ARDS in MD Anesthesia
"acute respiratory distress syndrome" AND "lung protective ventilation"
ARDS acute respiratory distress syndrome chest X-ray bilateral infiltrates
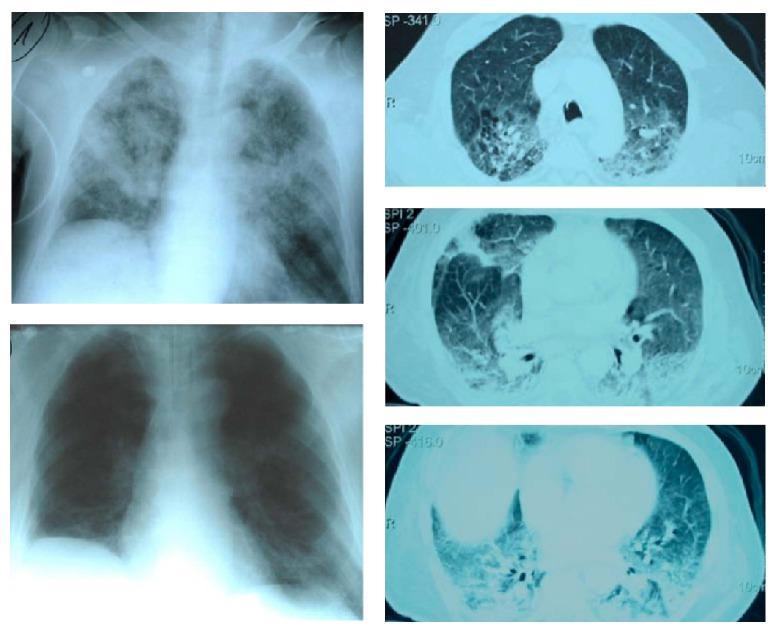
This composite diagnostic image includes chest X-rays and axial CT scans illustrating the progression and resolution of Acute Respiratory Distress Syndrome (ARDS). The top-left anterior-posterior chest X-ray shows diffuse, patchy bilateral alveolar infiltrates and ground-glass opacities in a postoperative patient, characteristic of pulmonary edema. To the right, three axial CT scan slices (cranial to caudal) demonstrate significant bilateral dorsal consolidation and dependent infiltrates with air bronchograms, typical of ARDS morphology. The bottom-left chest X-ray shows the same patient following Continuous Extrathoracic Negative Pressure Ventilation (CENPV), displaying marked regression of the bilateral infiltrates, improved lung aeration, and a reduction in previously noted pleural effusions. The educational focus is on the radiographic monitoring of lung recruitment and the resolution of pulmonary consolidations in critical care. This material is relevant for pulmonary medicine, anesthesia, and intensive care specialties.
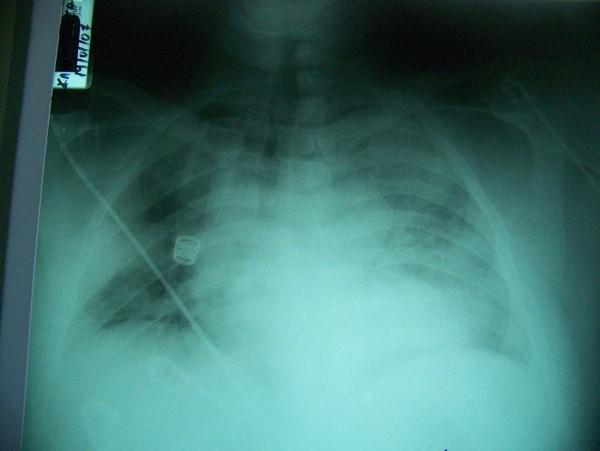
This diagnostic image is an anteroposterior (AP) chest x-ray demonstrating clinical features consistent with Acute Respiratory Distress Syndrome (ARDS). The radiograph reveals diffuse, bilateral pulmonary infiltrates with extensive alveolar opacities and increased density in both lung fields, appearing as a 'white-out' effect that obscures the normal bronchovascular markings. The distribution is patchy and widespread, affecting both central and peripheral regions, indicative of non-cardiogenic pulmonary edema or severe inflammatory consolidation. A prominent medical device is visible: a catheter or pulmonary artery line enters from the left upper thoracic region, traversing diagonally across the right lung field, featuring a distinct coiled (pigtail) component. The image illustrates the radiographic progression of respiratory failure in the context of critical care management, such as that seen in severe pneumonia or systemic inflammatory responses like the Jarisch-Herxheimer reaction.
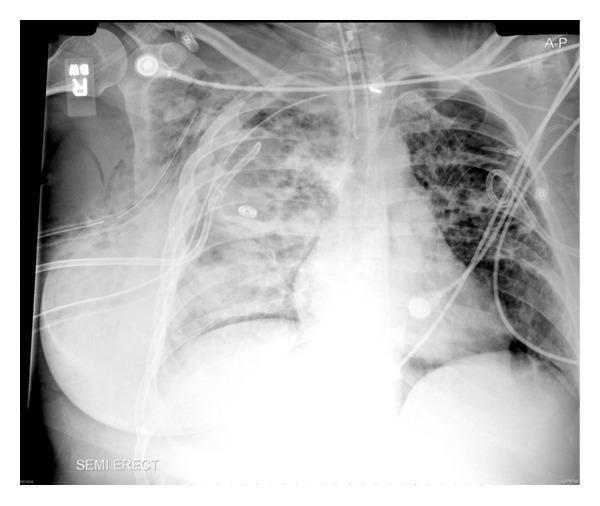
This anteroposterior (AP) chest X-ray, taken in a semi-erect position, demonstrates classic radiological findings of Acute Respiratory Distress Syndrome (ARDS) complicated by barotrauma. The lung fields exhibit widespread, bilateral patchy infiltrates and diffuse opacities, consistent with pulmonary edema and severe inflammation. Significant hyperlucency and pleural separation indicate the presence of multiple pneumothoraces, likely secondary to a bronchopleural fistula as indicated by the clinical context. Extensive medical instrumentation is visible, including an endotracheal tube for mechanical ventilation, a central venous catheter in the superior vena cava, and multiple thoracostomy (chest) tubes placed bilaterally to manage air leaks and drainage. External monitoring leads and tubing are also present across the chest wall. This image serves as an educational example of critical care pathology, highlighting the diagnostic features of acute lung injury, secondary pneumothorax, and the complex management of a patient requiring advanced life support.
ARDS - A Comprehensive Review for MD Anesthesia
1. Definition and Historical Background
2. Berlin Definition (2012) - Diagnostic Criteria
| Criterion | Requirement |
|---|---|
| Timing | Within 1 week of a known clinical insult, or new/worsening respiratory symptoms |
| Chest imaging | Bilateral opacities on CXR or CT - not fully explained by effusions, lobar/lung collapse, or nodules |
| Origin of edema | Respiratory failure not fully explained by cardiac failure or fluid overload (echo to exclude hydrostatic edema if no risk factor present) |
| Oxygenation | See severity classification below |
Berlin Severity Classification
| Severity | PaO2/FiO2 | Ventilatory Setting | Mortality |
|---|---|---|---|
| Mild | 200-300 mmHg | PEEP or CPAP ≥5 cm H2O | ~27% |
| Moderate | 100-200 mmHg | PEEP ≥5 cm H2O | ~32% |
| Severe | <100 mmHg | PEEP ≥5 cm H2O | ~45-46% |
Key exam point: Mild ARDS replaced the old "ALI" (PaO2/FiO2 <300). Overall mortality ranges from 35% (mild) to 46% (severe).
3. Etiology / Risk Factors
Direct (Pulmonary) Causes
- Pneumonia (most common direct cause)
- Aspiration of gastric contents
- Pulmonary contusion
- Inhalation injury
- Near drowning
Indirect (Extrapulmonary) Causes
- Sepsis (most common overall cause)
- Major trauma / multiple transfusions (TRALI)
- Acute pancreatitis
- Burns
- Drug overdose (amiodarone, chemotherapy agents, radiation)
- Cardiopulmonary bypass
4. Pathophysiology
Phase 1 - Exudative Phase (Days 1-7)
- Initial V/Q mismatch followed by progressive shunt
- Inflammatory cytokines (TNF-α, IL-1, IL-6, IL-8) recruit neutrophils to alveolar-capillary interface
- Neutrophil-mediated release of proteases, reactive oxygen species, and platelet-activating factor damages type I pneumocytes and capillary endothelium
- Loss of alveolar-capillary barrier integrity → protein-rich edema floods alveolar spaces
- Diffuse Alveolar Damage (DAD) - pathologic hallmark with hyaline membrane formation
- Type II pneumocyte dysfunction: reduced surfactant production → alveolar collapse, reduced compliance
- Gross lung: heavy, red, consolidated (hepatization)
Phase 2 - Proliferative / Fibroproliferative Phase (Days 7-21)
- Type II pneumocyte proliferation (repair attempt)
- Fibroblast activation → early fibrosis
- Some patients recover; others progress
Phase 3 - Fibrotic Phase (>21 days)
- Extensive collagen deposition, obliteration of alveolar architecture
- Severe loss of compliance, pulmonary hypertension
- Increased dead space and inability to wean from ventilator
Key Physiological Consequences
- Hypoxemia: primarily from intrapulmonary shunt (V/Q = 0 units)
- Low compliance (stiff lungs) → high plateau pressures at normal tidal volumes
- Increased dead space ventilation (V/Q = ∞ units) → hypercapnia in severe disease
- Pulmonary hypertension → RV strain
5. Radiological Findings
6. Management: The Stepwise Approach
A. Treat the Underlying Cause
B. Lung-Protective Ventilation (LPV) - ARDSNet Strategy
| Parameter | Target |
|---|---|
| Tidal Volume (Vt) | 4-8 mL/kg predicted body weight (PBW) - start at 6 mL/kg |
| Plateau Pressure (Pplat) | ≤30 cm H2O |
| Driving Pressure (ΔP) | Aim <15 cm H2O (ΔP = Pplat - PEEP) |
| PEEP | Titrate using PEEP-FiO2 tables (lower or higher PEEP strategy) |
| PaO2 | 55-80 mmHg |
| SpO2 | 88-95% |
| pH | Allow ≥7.25 with permissive hypercapnia |
| FiO2 | Minimize to achieve SpO2 target |
| RR | Up to 35/min to maintain minute ventilation |
- Males: 50 + 2.3 × (height in inches - 60)
- Females: 45.5 + 2.3 × (height in inches - 60)
C. PEEP Titration
- Overdistension of aerated lung → volutrauma/barotrauma
- Impaired venous return → reduced cardiac output
| FiO2 | Lower PEEP | Higher PEEP |
|---|---|---|
| 0.3 | 5 | 5 |
| 0.4 | 5-8 | 12-14 |
| 0.5 | 8-10 | 14-16 |
| 0.6 | 10 | 14-18 |
| 0.7 | 10-14 | 16-18 |
| 0.8 | 14 | 18-20 |
| 0.9 | 14-18 | 18-22 |
| 1.0 | 18-24 | 22-24 |
D. Adjunct Therapies for Moderate-Severe ARDS (PaO2/FiO2 <150)
1. Prone Positioning
- Improves V/Q matching by recruiting dependent (dorsal) lung regions, reduces dorsoventral transpulmonary pressure gradient
- PROSEVA trial (2013): Prone positioning for ≥16 hr/day in severe ARDS (PaO2/FiO2 <150) reduced 28-day mortality from 32.8% to 16.0%
- Initiate within 36 hours of moderate-severe ARDS
- Continue for ≥16 hr/day until PaO2/FiO2 >150 on PEEP ≤10, FiO2 ≤0.6
- Murray & Nadel's, Current Surgical Therapy 14e
2. Neuromuscular Blockade (NMB)
- Cisatracurium infusion for 48 hours in moderate-severe ARDS (ACURASYS trial, 2010) improved 90-day survival and reduced pneumothorax
- Proposed mechanisms: improved ventilator synchrony, reduced oxygen consumption, decreased lung and systemic inflammation
- ROSE trial (2019) did NOT confirm mortality benefit with routine NMB
- Current practice: NMB reserved for refractory hypoxemia or ventilator dyssynchrony
3. Inhaled Pulmonary Vasodilators
- Inhaled NO (iNO) or inhaled prostacyclin (iloprost): Improve V/Q matching by selective pulmonary vasodilation in ventilated regions
- Improve oxygenation transiently but no mortality benefit demonstrated
- Use as bridge therapy or for RV failure
4. Recruitment Maneuvers (RM)
- Brief application of high airway pressure (e.g., 40 cm H2O for 40 seconds) to open collapsed alveoli
- ART trial (2017) showed increased mortality with high-pressure RM + high PEEP strategy - now generally not recommended routinely
5. Conservative Fluid Strategy
- ARDS Network Fluid and Catheter Treatment Trial (FACTT): Conservative fluid management reduced duration of mechanical ventilation and ICU stay without worsening kidney function in patients not in shock
- Goal: lowest intravascular pressure that maintains adequate perfusion; use diuresis to achieve fluid balance
6. Corticosteroids
- High-dose steroids - NOT beneficial (5 large RCTs failed to show mortality reduction; may increase harm)
- Low-dose methylprednisolone (1 mg/kg/day) in late ARDS (fibroproliferative phase): Some benefit in improving oxygenation but inconclusive mortality data
- NOT routinely recommended based on current evidence - Murray & Nadel's Textbook of Respiratory Medicine
7. High-Frequency Oscillatory Ventilation (HFOV)
- No longer recommended - OSCAR and OSCILLATE trials showed no benefit; OSCILLATE showed increased mortality with HFOV
- Abandoned as rescue therapy
E. Rescue Therapies for Refractory ARDS
Veno-Venous ECMO (VV-ECMO)
- CESAR trial (2009): Transfer to ECMO center improved survival (63% vs. 47%) in severe ARDS
- EOLIA trial (2018): 60-day mortality 35% (ECMO) vs. 46% (control) - p=0.07; significant crossover from control to ECMO
- 2026 network meta-analysis (PMID 41781628): VV-ECMO + LPV remains the most effective rescue strategy for long-term mortality
- Indications (Gattinoni criteria): PaO2/FiO2 <80 despite optimal ventilation, severe hypercapnia (pH <7.15), or air leak syndrome
- Target "ultra-protective" ventilation on ECMO: Vt 3-4 mL/kg, Pplat ≤20 cm H2O, RR 4-10
Extracorporeal CO2 Removal (ECCO2R)
- Lower-flow system to correct hypercapnia, allow ultra-low Vt
- Under investigation (SUPERNOVA trial data)
7. Anesthesia-Specific Considerations
Intraoperative Ventilation in ARDS Patients
- Continue LPV strategy in the OR (Vt 6 mL/kg PBW, Pplat ≤30, PEEP titrated)
- Monitor driving pressure intraoperatively - correlates with postoperative pulmonary complications
- Avoid disconnection from PEEP (causes alveolar derecruitment)
- Prone-position surgery requires multidisciplinary coordination, careful padding, and airway security
Sedation in Mechanically Ventilated ARDS
- A 2026 meta-analysis (PMID 41380284) compared inhaled vs. IV sedation agents
- Propofol or midazolam infusions are standard; dexmedetomidine for lighter sedation and early waking
- ABCDEF bundle (Assess, Breathe, Choose, Delirium, Early mobility, Family) improves outcomes
- Target lightest effective sedation (RASS -1 to -2 for most patients; deeper for prone/NMB)
One-Lung Ventilation (OLV) and ARDS Risk
- OLV creates de facto intrapulmonary shunt - ARDS patients poorly tolerate this
- If ARDS present, OLV has high risk; use lowest FiO2 tolerated, CPAP to non-dependent lung
- Intraoperative acute lung injury: use Vt 4-6 mL/kg, PEEP 5-10 cm H2O, avoid Pplat >30
ARDS After Cardiac Surgery
- Cardiopulmonary bypass activates complement, cytokines - 0.5-2% incidence of post-bypass ARDS
- Management identical to standard ARDS protocol
- TRALI from FFP/platelets: clinical presentation identical to ARDS; supportive management
8. Key Landmark Trials Summary
| Trial | Year | Key Finding |
|---|---|---|
| ARDSNet (ARMA) | 2000 | 6 mL/kg PBW Vt reduced 28-day mortality by 22% vs. 12 mL/kg |
| ALVEOLI, LOVS, EXPRESS | 2004-2008 | Higher PEEP improved oxygenation but no mortality benefit |
| FACTT | 2006 | Conservative fluid strategy reduced ventilator days |
| ACURASYS | 2010 | Cisatracurium 48h improved 90-day survival (single center) |
| PROSEVA | 2013 | Prone ≥16h/day reduced 28-day mortality 32.8% → 16.0% |
| OSCAR / OSCILLATE | 2013 | HFOV - no benefit / increased mortality; abandoned |
| CESAR | 2009 | ECMO center transfer improved survival |
| EPVent-2 | 2019 | Esophageal pressure-guided PEEP = no benefit vs. table-guided |
| ROSE | 2019 | Routine cisatracurium NMB - no mortality benefit vs. light sedation |
| EOLIA | 2018 | ECMO trend toward benefit (p=0.07) in severe ARDS |
| ART | 2017 | High-pressure RM + titrated PEEP - increased mortality |
9. Monitoring in ARDS
| Parameter | Clinical Significance |
|---|---|
| Pplat | Lung + chest wall distension; target ≤30 cm H2O |
| PEEP | Recruitment vs. overdistension balance |
| Driving Pressure (ΔP) | Pplat - PEEP; strongest predictor of mortality; target <15 cm H2O |
| P0.1 | Respiratory drive; if high, patient's effort may cause self-inflicted lung injury (P-SILI) |
| Compliance (CRS) | Vt / ΔP; normal 60-100 mL/cm H2O; ARDS typically <40 mL/cm H2O |
| Mechanical Power | Total energy delivered per breath; emerging mortality predictor |
| EtCO2 / PaCO2 gap | Increases with dead space - marker of severity |
| PA catheter / Echo | Distinguish ARDS from cardiogenic pulmonary edema; assess RV function |
10. Differences: ARDS vs. Cardiogenic Pulmonary Edema
| Feature | ARDS | Cardiogenic Edema |
|---|---|---|
| PAWP | Normal (<18 mmHg) | Elevated (>18 mmHg) |
| Protein/edema fluid ratio | High (>0.7) | Low (<0.5) |
| Onset | Hours-days after trigger | Sudden |
| Response to diuretics | Poor | Prompt |
| BNP | Normal/mildly elevated | Markedly elevated |
| Chest X-ray | Bilateral, peripheral, no cardiomegaly | Perihilar "bat wing," cardiomegaly, Kerley B |
11. Outcomes and Post-ARDS Sequelae
- Overall ICU mortality: 27-46% based on severity
- Survivors have significant long-term morbidity: pulmonary fibrosis, muscle weakness, PTSD, cognitive impairment, depression
- "Post-intensive care syndrome (PICS)" - physical, cognitive, and psychological impairment
- Return to work may take months to years; exercise tolerance may remain permanently reduced
Recent Evidence Updates (2025-2026)
- Driving pressure-limited vs. conventional LPV (PMID 41345693): Systematic review confirms driving pressure-limited strategies are non-inferior and may reduce harm compared to conventional LPV.
- Network meta-analysis of adjuncts + LPV for long-term mortality (PMID 41781628): VV-ECMO combined with LPV had the greatest effect on long-term mortality.
- Inhaled vs. IV sedation in ARDS (PMID 41380284): Inhaled agents (isoflurane, sevoflurane) may offer bronchodilator benefit; evidence still evolving.
Goal directed fluid therapy in MD Anesthesia
"goal-directed fluid therapy" AND perioperative
Frank-Starling curve fluid responsiveness stroke volume preload
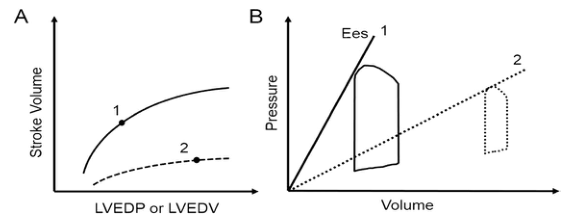
Summary : This figure compares cardiac function under two conditions using two types of plots: (A) the Frank-Starling relationship between stroke volume and left ventricular filling, and (B) pressure-volume loops with end-systolic elastance (Ees) lines. line and schematic plot: # Panel A: Frank-Starling Curve : • Y-axis: Stroke Volume (no units shown). • X-axis: LVEDP or LVEDV (Left Ventricular End-Diastolic Pressure or Volume; no units shown). • Two curves are shown: – Curve 1: Higher, solid line, labeled "1". – Curve 2: Lower, dashed line, labeled "2". • Each curve has a point marked (solid dot) on it. # Panel B: Pressure-Volume Loop and End-Systolic Elastance : • Y-axis: Pressure (no units shown). • X-axis: Volume (no units shown). • Two pressure-volume loops: – Loop 1: Solid line, larger, leftward, labeled "1". – Loop 2: Dashed line, smaller, rightward, labeled "2". • Two Ees (end-systolic elastance) lines: – Ees 1: Steeper, solid line, labeled "1". – Ees 2: Less steep, dashed line, labeled "2". # Design Encodings : • Solid lines for condition 1, dashed lines for condition 2. • Dots mark specific points on the curves in panel A. • Pressure-volume loops are outlined, with loop 2 shown as a dashed outline. # Analysis : • Panel A shows that condition 1 (solid line) has a higher stroke volume for any given LVEDP/LVEDV compared to condition 2 (dashed line), indicating better cardiac function. • Panel B shows that condition 1 has a larger, leftward pressure-volume loop and a steeper Ees line, indicating greater contractility. Condition 2 has a smaller, rightward loop and a less steep Ees line, indicating reduced contractility. • The figure visually contrasts normal/enhanced versus impaired cardiac function using both stroke volume response and pressure-volume relationships.
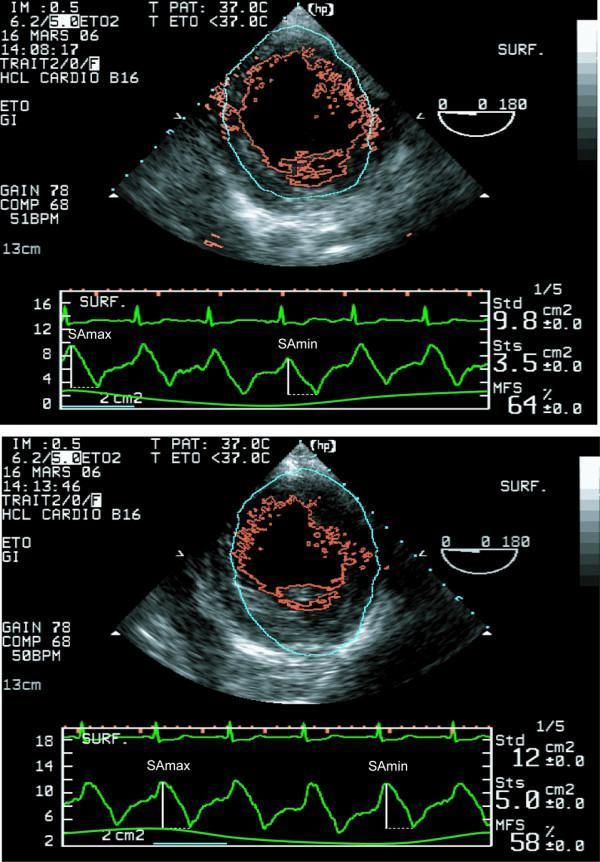
This diagnostic image displays two panels of transoesophageal echocardiography (TEE) in a transgastric, cross-sectional view of the left ventricle (LV) at the mid-papillary muscle level. The panels compare baseline cardiac function (top) with status after volume expansion via a passive leg raising maneuver (bottom). Both panels feature automated border detection (ABD) software, visually represented by red contours tracing the endocardial blood-tissue interface and a blue boundary for the region of interest. Below the ultrasound images, synchronized physiological tracings include a green electrocardiogram (ECG), a respiratory curve, and a continuous left ventricular area curve. Key parameters for assessing fluid responsiveness are shown, including maximal stroke area (SAmax) and minimal stroke area (SAmin). Numerical data on the right indicate an increase in the end-diastolic area (Std) from 9.8 cm² to 12 cm² following volume expansion, alongside changes in systolic area (Sts) and myocardial fractional shortening (MFS). This image demonstrates the use of dynamic echocardiographic indices and ABD technology in hemodynamic monitoring and preload assessment.
Goal-Directed Fluid Therapy (GDFT) - A Comprehensive Review for MD Anesthesia
1. Concept and Historical Background
2. The Problem with Traditional Fluid Management
Too Little (Hypovolemia):
- Decreased cardiac output → tissue hypoperfusion
- Acute kidney injury, bowel ischemia, anastomotic leak
- Increased risk of SSI, multi-organ dysfunction
Too Much (Fluid Overload):
- Interstitial edema → impaired tissue oxygen delivery (despite increased intravascular volume)
- Anastomotic leakage, pulmonary edema, pneumonia
- Wound infection, postoperative ileus, prolonged hospitalization
- Excess fluids increase body weight by 3-6 kg, impairing early mobilization
- Dilutional coagulopathy (especially with saline-based fluids)
3. Definition of GDFT
- Detecting fluid responsiveness using dynamic hemodynamic variables
- Administering fluid only when the patient is on the steep part of the Frank-Starling curve (i.e., when a bolus will meaningfully increase SV/CO)
- Avoiding both under- and over-resuscitation
- Heart rate, MAP
- Stroke Volume (SV), Stroke Volume Index (SVI)
- Cardiac Output (CO), Cardiac Index (CI)
- Pulse Pressure Variation (PPV)
- Stroke Volume Variation (SVV)
- Plethysmographic Variability Index (PVI)
4. Physiological Basis: Frank-Starling Mechanism and Fluid Responsiveness
5. Static vs. Dynamic Predictors of Fluid Responsiveness
Static Indicators (Unreliable - Now Largely Abandoned)
| Parameter | Normal Value | Limitation |
|---|---|---|
| CVP | 3-8 mmHg | Poor predictor of fluid responsiveness (sensitivity ~55%, specificity ~55%) |
| PCWP | 6-12 mmHg | Requires PAC; no better than CVP for predicting responsiveness |
| IVC diameter (static) | <2.1 cm | Affected by intrathoracic pressure, compliance |
| Urine output | >0.5 mL/kg/h | Oliguria is non-specific; may not reflect cardiac preload |
CVP and PCWP are no longer recommended as sole guides for fluid resuscitation. - Barash Clinical Anesthesia, 9e
Dynamic Indicators (Validated and Preferred)
- Inspiration → ↑ intrathoracic pressure → ↓ RV preload → ↓ RV stroke volume
- After 2-3 beats → ↓ LV filling (expiration phase) → ↓ LV stroke volume
- The cyclic variation in SV with the respiratory cycle indicates preload dependence
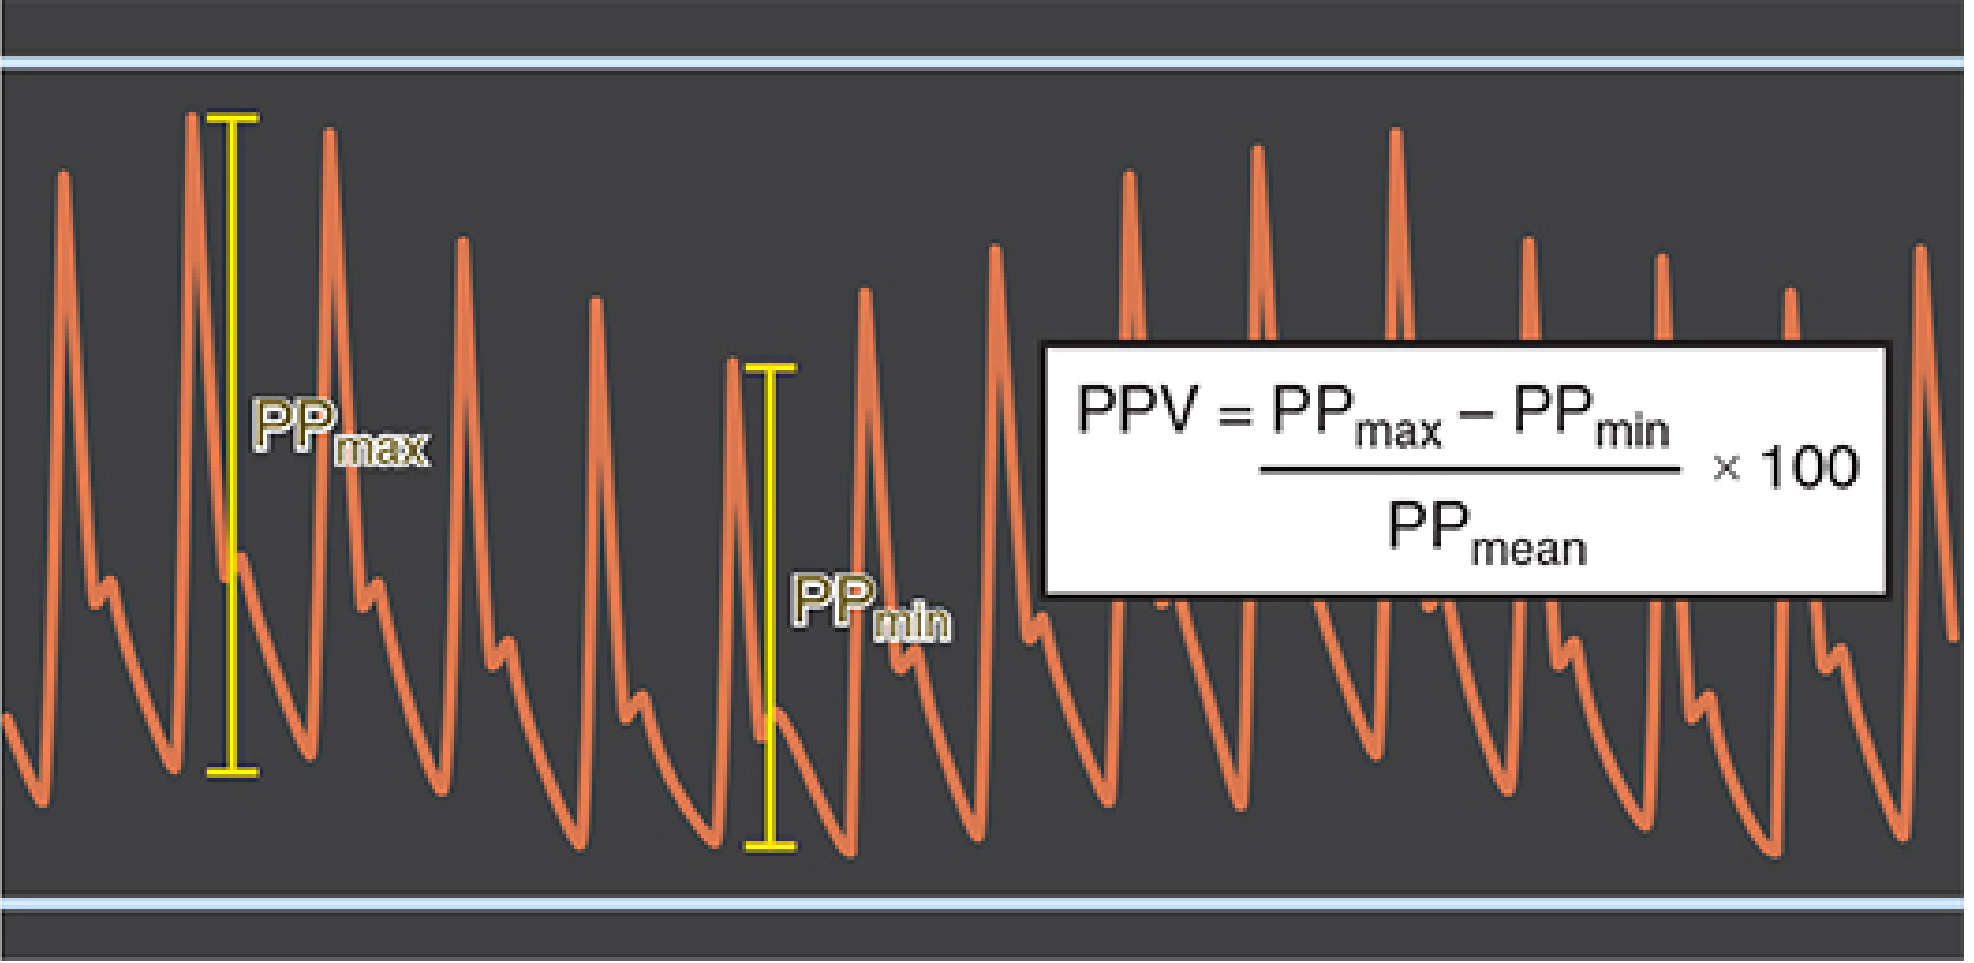
A. Pulse Pressure Variation (PPV)
- PPV >13% is predictive of fluid responsiveness (sensitivity ~72%, specificity ~89%)
- As fluid is administered, PPV decreases (patient moves to flat part of Starling curve)
B. Stroke Volume Variation (SVV)
- SVV >10-13% indicates fluid responsiveness
- More direct than PPV as it measures actual SV change
- Requires continuous CO monitoring device (e.g., FloTrac/Vigileo, LiDCO, PiCCO)
C. Systolic Pressure Variation (SPV)
- SPV >10 mmHg suggests fluid responsiveness
- Delta-down component (fall in SBP below apneic baseline) is the most preload-sensitive component
- Historically the first dynamic index used
D. Inferior Vena Cava (IVC) Distensibility Index
- dIVC >18% (mechanically ventilated) predicts fluid responsiveness
- Measured via ultrasound (subcostal or TTE view)
- Collapsibility index used in spontaneously breathing patients (>50% collapse = responsive)
E. Plethysmographic Variability Index (PVI)
- Non-invasive photoplethysmography-based (pulse oximeter waveform)
- PVI >14% predicts fluid responsiveness
- A 2025 meta-analysis (PMID 40778974) confirms PVI-guided GDFT reduces intraoperative fluid use and postoperative complications
Limitations of Dynamic Indices
| Condition Required | Clinical Implication |
|---|---|
| Controlled mechanical ventilation (no spontaneous breathing) | Unreliable in spontaneously breathing/partially weaned patients |
| Sinus rhythm | Arrhythmias (AF, ectopics) falsely elevate variation |
| Tidal volume ≥8 mL/kg PBW | May be unreliable with lung-protective ventilation (6 mL/kg) - tidal volume challenge test can help |
| Closed chest | Unreliable in open-chest cardiac surgery |
| No significant RV dysfunction | RV failure independently increases respiratory variation |
6. Tests for Fluid Responsiveness
A. Fluid Challenge (Mini-Fluid Challenge)
- Administer 100-250 mL IV fluid over 1-2 minutes
- Measure CO/SV before and after
- ≥10-15% increase in CO/SV = fluid responsive
- Limitations: irreversible if patient develops edema
B. Passive Leg Raise (PLR) Test
- Raise legs to 45° from supine position (transfers ~250-500 mL from lower limbs as autotransfusion)
- Simultaneously measure CO by continuous CO monitor or echocardiography
- ≥10% increase in CO = fluid responsive
- Completely reversible (legs lowered, fluid returns to venous reservoir)
- Valid in spontaneously breathing patients, arrhythmias, low tidal volume ventilation
- The most versatile and reversible fluid responsiveness test available
C. End-Expiratory Occlusion Test (EEOT)
- Occlude expiratory circuit for 15 seconds during mechanical ventilation
- Prevents cyclic decrease in preload; effective "auto-fluid challenge"
- ≥5% increase in pulse pressure or CO = fluid responsive
- Valid even during arrhythmias and spontaneous breathing
7. Monitoring Devices for GDFT
Invasive Devices
| Device | Method | Parameters |
|---|---|---|
| Pulmonary Artery Catheter (PAC) | Thermodilution | CO, CI, PCWP, SvO2, SVR - now rarely used |
| PiCCO (Pulsion) | Transpulmonary thermodilution + pulse contour | CO, SVV, EVLW, ITBV |
| LiDCO Plus | Lithium dilution + pulse contour | CO, SV, SVV, PPV |
| Vigilance / PA catheter | Continuous thermodilution | CO, SvO2, SVI |
Minimally Invasive Devices
| Device | Method | Parameters |
|---|---|---|
| FloTrac/Vigileo (Edwards) | Pulse contour (arterial line only) | CO, SV, SVV - no calibration required |
| LiDCO Rapid | Pulse power analysis | CO, SV, SVV |
| CNAP Monitor | Non-invasive pulse contour (finger) | Continuous BP, CO, SVV |
| ClearSight (Edwards) | Non-invasive vascular unloading (finger cuff) | CO, SV, SVV |
Non-Invasive Devices
| Device | Method | Parameters |
|---|---|---|
| Esophageal Doppler (CardioQ) | Doppler of descending aorta | SV, CO, corrected flow time (FTc) |
| NICOM (Cheetah) | Bioreactance | CO, SV |
| Transthoracic Echocardiography (TTE/TEE) | VTI × LVOT area | SV, CO, preload assessment |
Esophageal Doppler - Key Exam Points
- FTc (corrected flow time): Normal = 330-360 ms
- FTc <330 ms → preload deficiency → give fluid
- FTc >360 ms → vasoplegia → consider vasopressor
- Peak velocity (PV): Reflects contractility; reduced PV = poor contractility → consider inotrope
- Validated in major abdominal, orthopedic, and cardiac surgery; reduces complications and length of stay
8. GDFT Endpoints / Goals
Oxygen Delivery Optimization (Shoemaker Protocol - Historical)
- DO2 >600 mL/min/m²
- VO2 >170 mL/min/m²
- CI >4.5 L/min/m² These "supranormal" targets were associated with reduced mortality in Shoemaker's original work but not consistently reproduced.
Current Standard GDFT Goals (Perioperative)
| Parameter | Target |
|---|---|
| MAP | ≥65 mmHg (or within 20% of baseline) |
| SVI (Stroke Volume Index) | >35 mL/m²; aim for maximized SVI on Starling curve |
| SVV / PPV | <10-13% (fluid responsive threshold) |
| FTc (Esophageal Doppler) | 330-360 ms |
| ScvO2 / SvO2 | ScvO2 >70%, SvO2 >65% |
| Lactate | <2 mmol/L; clearance >10% per 2 hours |
| Urine output | >0.5 mL/kg/h (not used in isolation) |
| Cardiac Index | >2.5 L/min/m² |
9. GDFT Algorithm (Stepwise Perioperative Approach)
START: Intraoperative patient (major surgery, high-risk)
         |
         v
ASSESS fluid responsiveness (SVV/PPV/PLR/FTc)
         |
    SVV >13% or FTc <330ms?
   YES                    NO
    |                      |
Give fluid bolus         Assess MAP
(250 mL colloid         MAP <65 mmHg?
 or 500 mL crystalloid)   |        |
         |               YES       NO
         |                |        |
    Reassess SVV       Vasopressor  Reassess
         |             (norepinephrine)  CO/SVI
    Still responsive?     |
   YES → repeat        MAP ≥65 mmHg
   NO → stop fluids        |
                      CI <2.5 L/min/m²?
                         |         |
                        YES        NO
                         |         |
                    Inotrope    Optimize analgesia
                  (dobutamine)  Temp, Hgb, etc.
10. Fluid Types in GDFT
| Physiological Requirement | First-Line Fluid | Volume |
|---|---|---|
| Insensible losses (closed abdomen) | Balanced crystalloid (LR/PlasmaLyte) | 0.5 mL/kg/h |
| Insensible losses (open abdomen) | Balanced crystalloid | 1 mL/kg/h |
| Urine replacement | Crystalloid | Volume for volume |
| Blood loss (intravascular deficit) | Colloid (iso-oncotic, balanced) | 1:1 ratio |
| Further preload deficit | Colloid guided by CO monitor | Per SVV/FTc |
| Blood loss ≥ transfusion trigger | pRBCs (Hgb <7-8 g/dL) | Unit for unit |
- Morgan & Mikhail's Clinical Anesthesiology, 7e
- Colloids: Albumin 4-5%, gelatin (Gelofusine), starch (HES - caution in sepsis/renal impairment)
- HES 130/0.4: Avoided in septic patients (increased AKI, need for RRT - CHEST trial, 6S trial)
- Albumin is the preferred colloid in sepsis and ARDS
11. GDFT in Enhanced Recovery After Surgery (ERAS)
- GDFT is a core component of ERAS protocols for major abdominal, colorectal, esophageal, and orthopedic surgery
- In the ERAS context, the target is "zero balance" fluid strategy: 3-5 mL/kg/h crystalloid baseline + blood loss replacement 1:1.5 crystalloid ratio
- GDFT is most beneficial when blood loss is expected >1000 mL or in high-risk patients (ASA III-IV, major vascular/abdominal surgery)
- In laparoscopic/robotic surgery: benefit of GDFT is less clear (less blood loss, less fluid shift)
- Current Surgical Therapy 14e
- Pearse et al. (OPTIMISE trial, 2014): Doppler-guided GDFT with dopexamine reduced complications in high-risk surgical patients
- 2025 meta-analysis in oncologic surgery (PMID 40305698): GDFT reduced postoperative complications and hospital LOS in cancer surgeries
- 2024 meta-analysis in elderly (PMID 40994091): GDFT reduced major complications and ICU admissions in elderly surgical patients
12. High-Risk Surgical Patients - Indications for GDFT
- ASA ≥ III with major surgery
- Expected blood loss >1000 mL
- Major abdominal, vascular, thoracic, or orthopedic surgery
- Esophagectomy (particularly sensitive to fluid excess and deficit)
- Cardiac surgery with bypass
- Septic patients undergoing emergency surgery
- Patients with pre-existing cardiac or renal dysfunction
13. Limitations and Controversies
| Issue | Detail |
|---|---|
| RELIEF trial | Restrictive strategy increased AKI - caution against overly restrictive protocols |
| GDFT in ERAS | No added benefit over standard ERAS in some trials (ERAS alone reduces fluid excess) |
| Low tidal volume ventilation | Reduces reliability of PPV/SVV (validated mainly with Vt ≥8 mL/kg) |
| Spontaneous breathing | Dynamic indices unreliable; use PLR or EEOT instead |
| Arrhythmias | All arterial waveform-derived dynamic indices become unreliable |
| Open abdomen / laparoscopy | Pneumoperitoneum and head-down position alter SVV/PPV thresholds |
| Right heart failure | False elevations in SVV/PPV independent of preload |
| Colloid choice | HES avoided in sepsis; albumin preferred |
14. Comparison of Fluid Strategies
| Strategy | Principle | Best Use | Risk |
|---|---|---|---|
| Liberal | Give fixed large volumes | Older dogma, not recommended | Fluid overload, edema, AKI |
| Restrictive | Minimize fluids | May reduce anastomotic leak - but RELIEF showed increased AKI | Hypovolemia, organ hypoperfusion |
| Zero-balance / ERAS | Maintain euvolemia, replace only losses | Laparoscopic/minimally invasive surgery | Requires precise loss estimation |
| GDFT | Individualize by hemodynamic endpoints | High-risk patients, major surgery, expected large blood loss | Requires monitoring equipment, training |
15. Key Landmark Trials in GDFT
| Trial | Year | Findings |
|---|---|---|
| Shoemaker | 1983 | Supranormal DO2 targets reduced mortality in high-risk surgical patients - origin of GDFT |
| Boyd (Dopexamine) | 1993 | Esophageal Doppler + dopexamine reduced mortality post major surgery |
| Mythen & Webb | 1995 | Esophageal Doppler GDFT reduced gut mucosal hypoperfusion in cardiac surgery |
| Gan et al. (CardioQ) | 2002 | Esophageal Doppler reduced hospital LOS and time to diet in major abdominal surgery |
| OPTIMISE (Pearse) | 2014 | Doppler GDFT + dopexamine: trend to reduced 30-day complications in high-risk abdominal surgery (p=0.08) |
| RELIEF | 2018 | Restrictive crystalloid increased AKI vs. liberal strategy; positive 1-2L balance recommended |
| MYLES (RELIEF full) | 2018 | No benefit in disability-free survival with restrictive vs liberal strategy |
| GDFT in Oncology (PMID 40305698) | 2025 | GDFT reduced complications and LOS in oncologic surgery |
| GDFT in Elderly (PMID 40994091) | 2024 | GDFT reduced major complications and ICU admissions in elderly |
16. Quick Summary for Viva/MCQ
| Question | Answer |
|---|---|
| First described by whom? | Shoemaker et al., 1983 |
| Best non-invasive CO monitor | Esophageal Doppler (CardioQ) |
| PPV threshold for fluid responsiveness | >13% |
| SVV threshold | >10-13% |
| PLR autotransfusion volume | ~250-500 mL |
| PLR positive response (CO increase) | ≥10% |
| FTc normal | 330-360 ms |
| FTc <330 ms → | Give fluid (preload deficiency) |
| FTc >360 ms → | Vasopressor (vasoplegia) |
| Why CVP is unreliable | Poor predictor of fluid responsiveness (~55/55% sensitivity/specificity) |
| Why PPV unreliable in AF | Arrhythmia independently varies arterial amplitude |
| Fluid target in ERAS | Zero balance; 3-5 mL/kg/h + replace losses 1:1.5 |
| RELIEF trial lesson | Neither purely restrictive nor purely liberal is ideal; 1-2 L positive balance optimal |
| Colloid to avoid in sepsis | HES (hydroxyethyl starch) - increases AKI |
| Most versatile FR test | Passive Leg Raise (valid in spontaneous breathing, arrhythmias) |
TEG, ROTEM, Sonoslot in MD anaesthesia
"thromboelastography" AND "ROTEM" AND perioperative
viscoelastic hemostasis testing transfusion guidance
TEG thromboelastography tracing parameters R time K angle MA normal
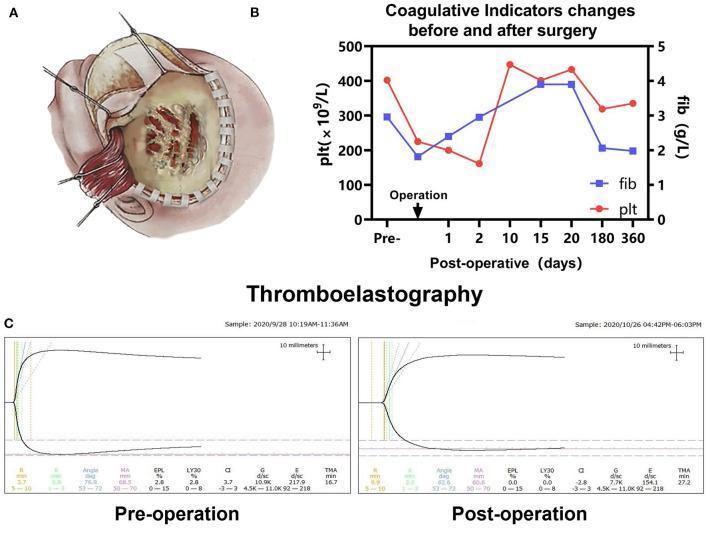
Educational panel consisting of a surgical diagram, a longitudinal line graph, and diagnostic tracing images related to a pediatric neurosurgical case. Panel A: An anatomical diagram illustrating a left frontotemporal craniotomy on an infant. The illustration shows a reflected scalp flap held by retractors, exposing an abnormal skull surface characterized by thinning and distinctive dark-red, worm-like vascular changes and blood seeping, indicative of tumor invasion. Panel B: A line graph tracking coagulative indicators from pre-operative status through 360 days post-operative. Platelet count (plt, x10^9/L) is shown in red, and fibrinogen (fib, g/L) in blue. The graph demonstrates a sharp perioperative decline in both markers followed by a recovery phase peaking around day 10–20. Panel C: Pre-operative and post-operative Thromboelastography (TEG) tracings showing normal clot formation kinetics, including R-time, K-time, alpha angle, and Maximum Amplitude (MA). The tracings represent a stable coagulation profile despite the significant surgical intervention for a suspected intracranial Kaposiform Hemangioendothelioma (KHE).
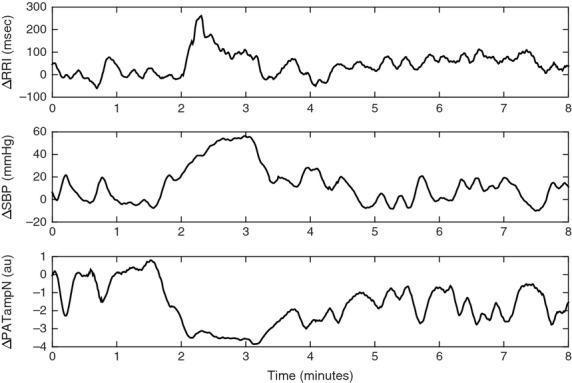
This physiological tracing displays changes in cardiac and vascular parameters during a Cold Face Stimulation (CFS) test in a human subject over an 8-minute period. The image consists of three vertically aligned time-series plots. The top tracing shows the change in R-R interval (ΔRRI) in milliseconds, indicating a sharp transient increase (bradycardia) starting at the 2-minute mark (CFS onset), peaking near 250 msec. The middle tracing shows the change in systolic blood pressure (ΔSBP) in mmHg, which demonstrates a progressive increase reaching approximately 60 mmHg between 2 and 3.5 minutes. The bottom tracing represents the change in normalized Peripheral Arterial Tone amplitude (ΔPATampN) in arbitrary units, showing a marked drop to approximately -3.5 units during stimulation, which signifies intense peripheral vasoconstriction. These synchronous measurements illustrate the trigeminal-cardiac reflex and the sympathetic vascular response elicited by the cold stimulus, making this a relevant educational tool for understanding autonomic nervous system regulation and cardiovascular reflex testing.
This lateral cervical spine radiograph demonstrates the radiological parameters used to assess sagittal alignment and spinal canal relationships. Two primary measurements are illustrated: the cervical lordotic angle (Cobb angle) and the K-line. The cervical lordotic angle (labeled with the Greek letter alpha, α) is constructed by drawing two reference lines parallel to the inferior endplates of the C2 and C7 vertebral bodies; the intersection of their perpendiculars defines the degree of lordosis. The K-line is represented as a straight solid line connecting the midpoints of the spinal canal at the C2 and C7 levels. This line serves as a critical marker in evaluating cervical spondylotic myelopathy or ossification of the posterior longitudinal ligament (OPLL), particularly in determining whether the pathology is anterior or posterior to this reference. The image provides a clear anatomical view of the cervical vertebrae (C1-C7), highlighting the neutral sagittal curvature and the relationship between the bony landmarks and canal geometry used in preoperative surgical planning.
TEG ROTEM guided transfusion bleeding outcomes
TEG, ROTEM, and Sonoclot - A Comprehensive Review for MD Anesthesia
1. Introduction: Why Viscoelastic Testing?
- Performed on platelet-poor plasma (not whole blood)
- Measure only the initiation of coagulation, not clot strength or fibrinolysis
- Take 45-60 minutes for results (too slow for active bleeding)
- Poor correlation with surgical bleeding
- Cannot detect hypercoagulability or fibrinolysis
2. Principle of Viscoelastic Testing
| Device | Manufacturer | Movement | Transducer |
|---|---|---|---|
| TEG 5000 | Haemonetics (Boston, MA) | Cup rotates 4°45' every 5 sec | Electromagnetic/torsion wire |
| TEG 6s | Haemonetics | Vibration (resonance, no rotation) | LED optical |
| ROTEM delta/sigma | Werfen (Barcelona) | Pin rotates 4°75' every 6 sec | Optical |
| Sonoclot | Sienco Inc. | Pin vibrates ultrasonically | Impedance to pin motion |
3. TEG: Parameters and Normal Values
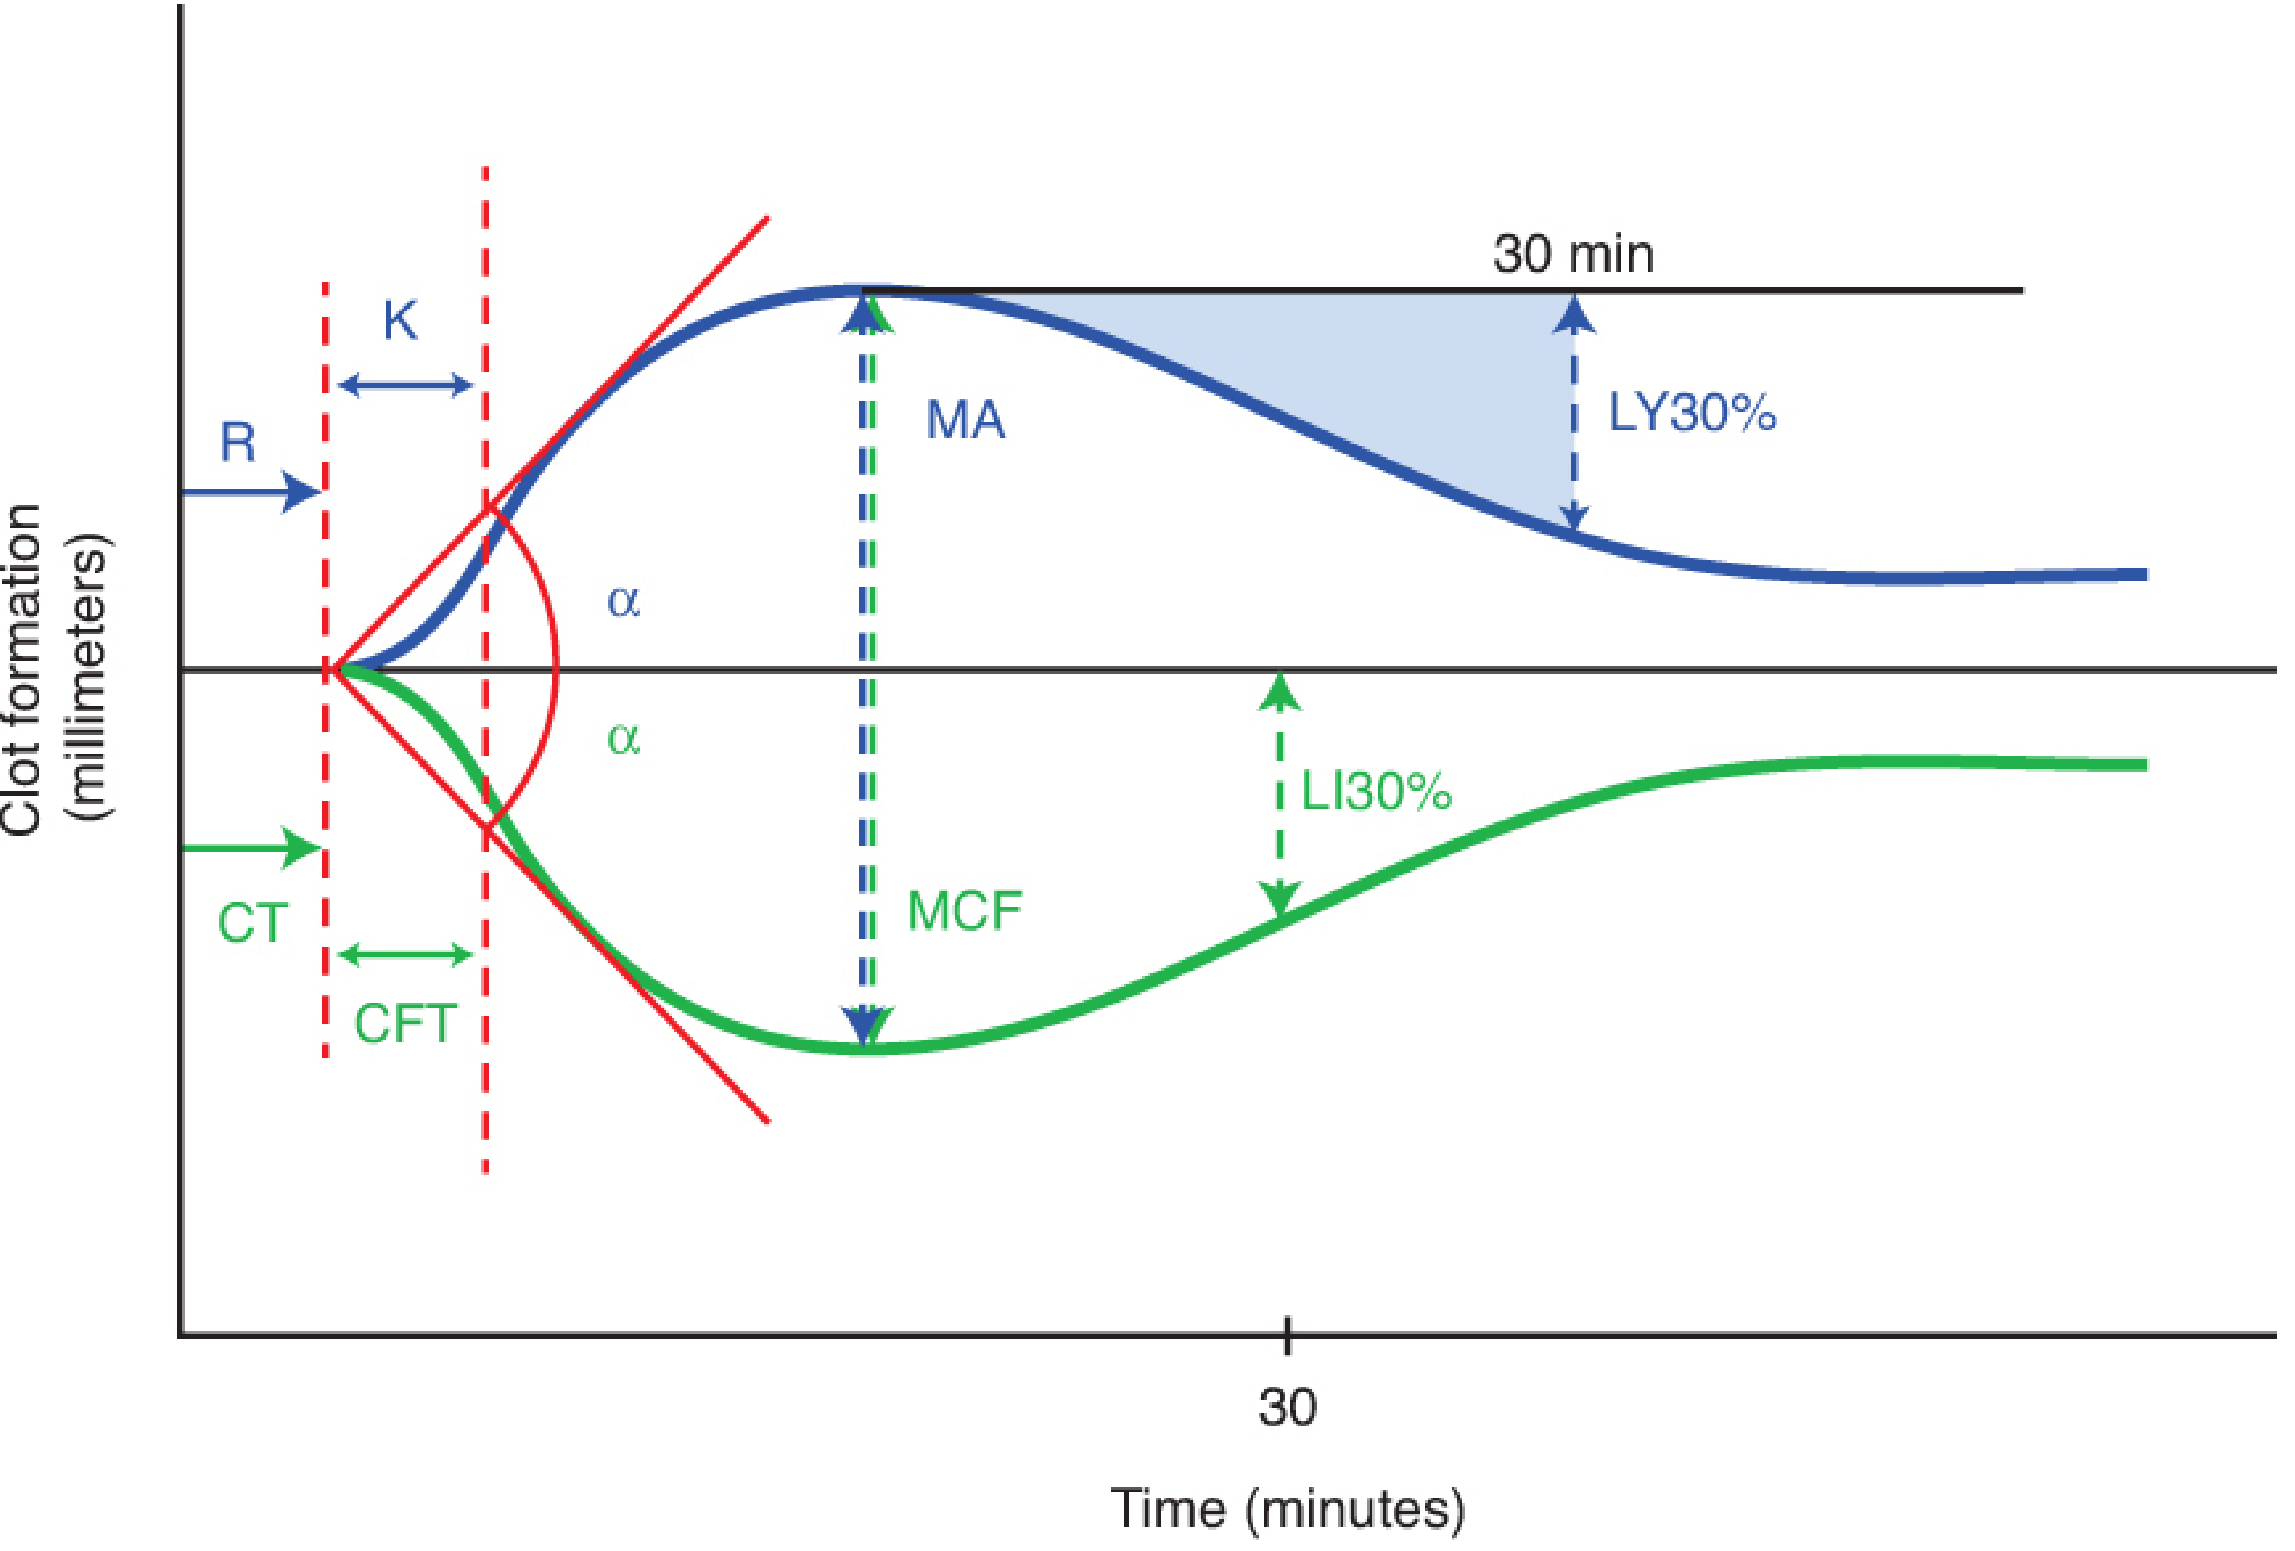
TEG Parameters
| Parameter | Definition | Reflects | Normal Value | Prolonged/Abnormal = |
|---|---|---|---|---|
| R (Reaction time) | Time from start to first 2mm amplitude | Initiation of coagulation (clotting factor activity) | 5-10 min | ↑ = factor deficiency, heparin effect; ↓ = hypercoagulable |
| K (Kinetic time) | Time from 2mm to 20mm amplitude | Kinetics of fibrin formation (fibrinogen, platelets) | 1-3 min | ↑ = low fibrinogen/platelets; ↓ = hypercoagulable |
| α (Alpha angle) | Angle of slope from K point to MA | Rate of fibrin polymerization and crosslinking | 53-72° | ↓ = low fibrinogen; ↑ = hypercoagulable |
| MA (Maximum Amplitude) | Greatest width of tracing | Maximum clot strength - reflects platelet + fibrin contribution (80% platelets, 20% fibrin) | 51-69 mm | ↓ = thrombocytopenia, platelet dysfunction; ↑ = hypercoagulable |
| CI (Coagulation Index) | Composite score using R, K, α, MA | Global coagulability | -3 to +3 | <-3 = hypocoagulable; >+3 = hypercoagulable |
| LY30 | % clot lysis at 30 minutes | Fibrinolysis | <8% | >8% = hyperfibrinolysis → give TXA |
| EPL (Estimated % Lysis) | Predicted lysis at 30 min | Fibrinolysis early warning | <15% | >15% = significant fibrinolysis |
TEG Activators
| Test | Activator | Pathway Tested |
|---|---|---|
| Kaolin TEG | Kaolin (contact activator) | Intrinsic pathway (standard) |
| rTEG (Rapid TEG) | Tissue factor (TF) + kaolin | Extrinsic + intrinsic (results in 5-15 min) |
| Functional Fibrinogen (FF-TEG) | Kaolin + abciximab (GP IIb/IIIa blocker) | Fibrinogen contribution only (platelets inhibited) |
| Platelet Mapping | ADP or arachidonic acid | Platelet aggregation / antiplatelet drug effect |
| Heparinase TEG | Kaolin + heparinase | Neutralizes heparin to unmask coagulopathy |
4. ROTEM: Parameters and Normal Values
ROTEM Parameters
| ROTEM Parameter | TEG Equivalent | Definition | Normal Value |
|---|---|---|---|
| CT (Clotting Time) | R time | Time to 2mm amplitude (clot initiation) | EXTEM: 38-79 sec, INTEM: 100-240 sec |
| CFT (Clot Formation Time) | K time | Time from 2mm to 20mm amplitude | EXTEM: 34-159 sec |
| α-angle | α-angle | Tangent of slope at CFT point | EXTEM: 63-83° |
| MCF (Max Clot Firmness) | MA | Maximum clot strength | EXTEM: 50-72 mm |
| A5, A10, A20 | - | Amplitude at 5, 10, 20 minutes (early prediction) | Correlates with MCF |
| CLI30 (Clot Lysis Index 30) | LY30 | % remaining clot firmness at 30 min | >85% (values <85% = fibrinolysis) |
ROTEM Test Channels
| Channel | Activator | Information | Clinical Use |
|---|---|---|---|
| EXTEM | Tissue factor (TF) + phospholipids | Extrinsic pathway (Factor VII, X, V, II, fibrinogen, platelets) | Screening, heparin-free assessment |
| INTEM | Ellagic acid (contact activator) | Intrinsic pathway (Factors XII, XI, IX, VIII, X, V, II) | Sensitive to heparin, factor deficiencies |
| FIBTEM | TF + cytochalasin D (platelet inhibitor) | Fibrinogen contribution only (platelets blocked) | Guides fibrinogen concentrate / cryoprecipitate |
| HEPTEM | Ellagic acid + heparinase | INTEM with heparin neutralized | Distinguishes heparin effect from coagulopathy |
| APTEM | TF + aprotinin (fibrinolysis inhibitor) | EXTEM with fibrinolysis inhibited | Confirms fibrinolysis (if APTEM corrects EXTEM = fibrinolysis) |
- EXTEM MCF - FIBTEM MCF = platelet contribution to clot strength
- FIBTEM MCF <8 mm → fibrinogen deficiency → give fibrinogen concentrate or cryoprecipitate
5. TEG vs. ROTEM: Key Differences
| Feature | TEG | ROTEM |
|---|---|---|
| Movement | Cup rotates | Pin rotates (cup fixed) |
| Activation | Kaolin / TF | Ellagic acid / TF by channel |
| Terminology | R, K, α, MA, LY30 | CT, CFT, α, MCF, CLI30 |
| Separate test channels | Requires multiple wells | Yes (EXTEM, INTEM, FIBTEM, APTEM, HEPTEM simultaneously) |
| Heparin detection | Heparinase cup separately | HEPTEM channel (simultaneous with INTEM) |
| Fibrinogen isolation | FF-TEG (separate) | FIBTEM (simultaneous) |
| Result time | Standard: 30-60 min; rTEG: 5-15 min | Standard: 30-60 min; A5/A10 early: 5-15 min |
| Preferred in | Trauma centers (North America) | Europe, cardiac surgery centers |
| Latest generation | TEG 6s (resonance, cartridge) | ROTEM sigma (automated) |
6. Sonoclot
Principle
Parameters
| Parameter | Normal Value | Reflects |
|---|---|---|
| Activated Clotting Time (ACT) | Depends on activator used | Time to initial clot detection |
| Clot Rate (CR) | Speed of rise of signature curve | Fibrin polymerization rate, fibrinogen levels |
| Platelet Function (PF) | 1-5 (peak-to-valley ratio) | Platelet contribution to clot retraction |
| Time to Peak (TP) | - | Time to maximum clot formation |
Sonoclot Signature Interpretation
| Pattern | Appearance | Interpretation |
|---|---|---|
| Normal | Gradual rise, peak, then slight descent | Normal hemostasis |
| Flat | No rise | No clotting - severe coagulopathy / anticoagulation |
| High clot rate, low PF | Steep rise, no peak descent | Fibrinogen excess / hypercoagulable without platelet retraction |
| Low clot rate | Slow, shallow rise | Fibrinogen deficiency |
| Absent peak/retraction | Plateau without descent | Platelet dysfunction (thrombocytopenia, aspirin, GPIIb/IIIa inhibitors) |
| Downslope after peak | Clot forms then dissolves | Fibrinolysis |
Sonoclot Activators
| Test | Activator | Clinical Use |
|---|---|---|
| SonACT | Glass beads (intrinsic) | General clotting, heparin monitoring |
| gbACT+ | Glass beads + heparin neutralizer | Post-protamine reversal check |
| kaolin ACT | Kaolin | Faster activation, cardiac surgery |
Sonoclot vs. TEG/ROTEM: Key Differences
| Feature | Sonoclot | TEG/ROTEM |
|---|---|---|
| Probe motion | Axial vibration (ultrasonic) | Rotational |
| Output | "Signature" (impedance vs. time) | Symmetric spindle tracing |
| Platelet function | Assessed via clot retraction (PF score) | Via MA (TEG) / MCF (ROTEM) |
| Heparin monitoring | Excellent (gbACT) | Less direct |
| Cardiac surgery use | Excellent for heparin/protamine | Also used |
| Clinical uptake | Less widespread | More widely validated |
7. TEG/ROTEM Tracings in Pathological States
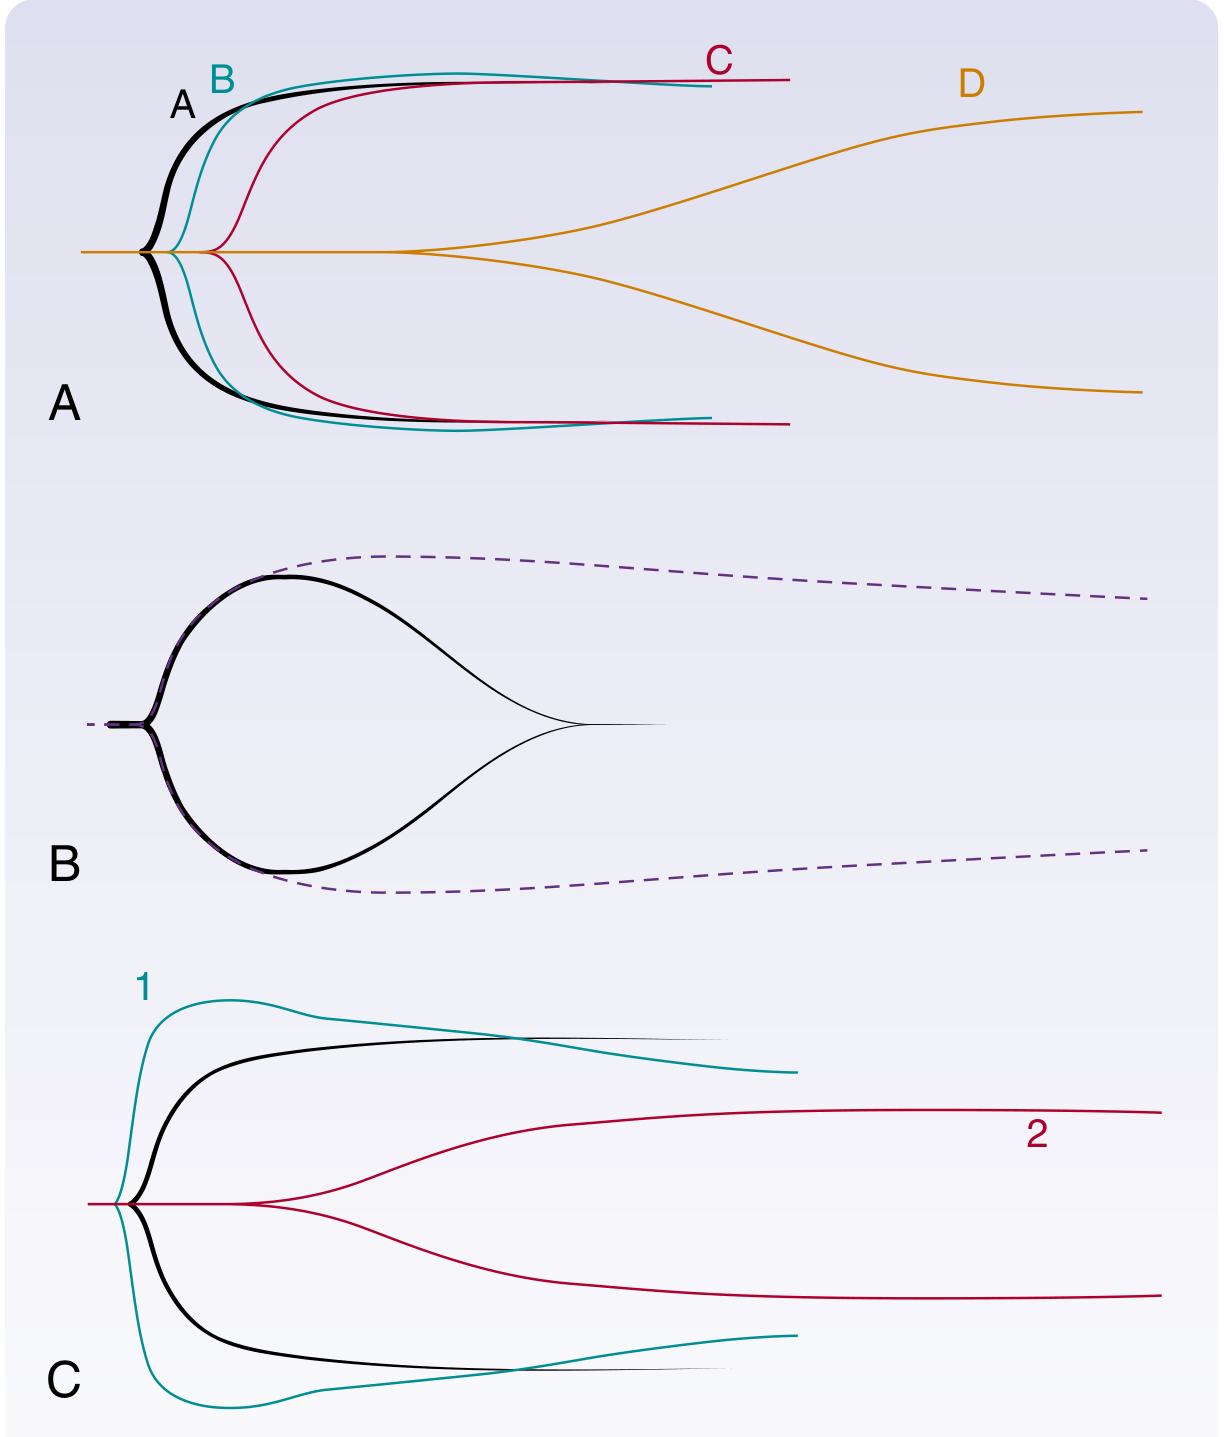
| Condition | R/CT | K/CFT | α-angle | MA/MCF | LY30/CLI30 | Action |
|---|---|---|---|---|---|---|
| Normal | Normal | Normal | Normal | Normal | Normal (<8%) | - |
| Factor deficiency (e.g., Hemophilia) | ↑ | ↑ | ↓ | Normal/↓ | Normal | FFP or factor concentrate |
| Low fibrinogen | Normal | ↑ | ↓ | ↓ | Normal | Cryoprecipitate or fibrinogen concentrate |
| Thrombocytopenia / platelet dysfunction | Normal | ↑ | ↓ | ↓ | Normal | Platelet transfusion, DDAVP |
| Hyperfibrinolysis | Normal | Normal | Normal | ↓ (falling MA) | ↑↑ (>8%) | Tranexamic acid (TXA), EACA |
| Heparin effect | ↑ | ↑ | ↓ | ↓ | Normal | Protamine |
| Stage 1 DIC (hypercoagulable) | ↓ | ↓ | ↑ | ↑ | Mildly ↑ | Treat underlying cause |
| Stage 2 DIC (consumptive) | ↑ | ↑ | ↓ | ↓ | ↑ | FFP + cryoprecipitate + platelets + TXA |
| Warfarin / VKA | ↑ | ↑ | ↓ | Normal | Normal | PCC or vitamin K |
| Hypercoagulable | ↓ | ↓ | ↑ | ↑ | ↓ | Anticoagulation |
| Dilutional coagulopathy | ↑ | ↑ | ↓ | ↓ | Normal/↑ | Balanced blood products |
8. ROTEM Channel Interpretation Guide
| Finding | Channel Abnormality | Diagnosis | Action |
|---|---|---|---|
| Prolonged EXTEM CT, normal INTEM CT | EXTEM CT ↑, INTEM normal | FVII deficiency (extrinsic only) | Factor VII |
| Prolonged INTEM CT, normal EXTEM CT | INTEM CT ↑, EXTEM normal | Heparin effect | Check HEPTEM; if corrected → protamine |
| Both EXTEM + INTEM CT prolonged | Both CT ↑ | Factor deficiency (Factors X/V/II/fibrinogen) or combined | FFP |
| Low EXTEM MCF + normal FIBTEM MCF | EXTEM ↓, FIBTEM normal | Platelet problem | Platelet transfusion |
| Low EXTEM MCF + low FIBTEM MCF | Both ↓ | Fibrinogen deficiency | Fibrinogen concentrate / cryoprecipitate |
| EXTEM shows rapid descent after MCF, corrected by APTEM | APTEM corrects EXTEM | Fibrinolysis confirmed | TXA or EACA |
9. Clinical Applications in Anesthesia
A. Cardiac Surgery (CPB)
- Monitor heparin effect (INTEM/HEPTEM comparison)
- Confirm adequacy of protamine reversal (if HEPTEM CT = INTEM CT → heparin fully neutralized)
- Detect post-bypass coagulopathy: distinguish factor deficiency, platelet dysfunction, fibrinolysis
- TEG-guided algorithms in cardiac surgery reduce transfusion of FFP and platelets by up to 50%
- Detect residual heparin (common cause of post-CPB bleeding) - INTEM prolonged, HEPTEM normal
B. Trauma
- Detect Trauma-Induced Coagulopathy (TIC) rapidly at the bedside
- TIC on TEG: prolonged R time, low MA, elevated LY30 (hyperfibrinolysis)
- Guide damage control resuscitation: when to give FFP, platelets, cryoprecipitate, TXA
- Hyperfibrinolysis in trauma: LY30 >8% → immediate TXA (within 3 hours)
- 2019 European guideline on management of major bleeding recommends TEG/ROTEM be used alongside PT, aPTT, fibrinogen, and platelet count to characterize and guide therapy - Current Surgical Therapy 14e
C. Liver Transplantation
- Liver disease creates complex coagulopathy (low procoagulants + low anticoagulants = "balanced")
- INR alone is misleading (reflects only procoagulant side)
- A patient with INR of 3.0 may be hypercoagulable if anticoagulant proteins (Protein C, S, antithrombin) are equally reduced
- TEG/ROTEM reveals the true balance: normal or narrow tracing = balanced (avoid over-transfusing)
- Identifies hyperfibrinolysis during anhepatic phase (common; the liver normally clears tPA)
- Guides targeted replacement: FIBTEM MCF <8 mm → give fibrinogen/cryoprecipitate; Low platelet contribution → give platelets - Barash Clinical Anesthesia 9e
D. Obstetrics (Postpartum Hemorrhage)
- FIBTEM MCF <8 mm (or A5 <6 mm on FIBTEM) is the earliest predictor of severity of PPH and requirement for massive transfusion
- Guides fibrinogen concentrate therapy in PPH (early hypofibrinogenemia is key in obstetric coagulopathy)
- Detects amniotic fluid embolism (severe hyperfibrinolysis pattern: flat MA with rapid lysis)
- TEG/ROTEM-guided PPH management reduces allogeneic blood product use
E. Major Abdominal and Vascular Surgery
- Guides transfusion in major hepatic resections, Whipple procedures, aortic surgery
- Avoids unnecessary FFP administration (FFP associated with TRALI, immunomodulation, increased infection)
- Can detect hypercoagulability and help guide DVT prophylaxis timing
10. TEG/ROTEM-Guided Transfusion Algorithm
Example: Surgical Bleeding with TEG Guide
BLEEDING PATIENT → Draw TEG/ROTEM sample
         |
Is R time (CT) prolonged?
YES → Give FFP (10-15 mL/kg) or PCC
         |
Is MA (MCF) low?
   |                    |
FIBTEM MCF <8mm?      EXTEM MCF low but FIBTEM normal?
   YES                     YES
Give fibrinogen          Give platelets
concentrate/cryo         (1-2 pools or 1 apheresis)
(30-50 mg/kg)
         |
Is LY30 >8%? (CLI30 <85%?)
YES → Tranexamic acid 1g IV (or EACA 100 mg/kg)
         |
Still bleeding? → Consider DDAVP (platelet dysfunction)
                  Consider recombinant FVIIa (last resort)
11. Limitations of TEG/ROTEM/Sonoclot
| Limitation | Detail |
|---|---|
| Temperature | Tested at 37°C; may not reflect true hypothermic coagulopathy (though algorithms exist for 32°C and 39°C) |
| Normal in certain conditions | VWD (Type 1), mild warfarin effect, DOACs (unreliable) |
| Anticoagulants | DOACs (apixaban, rivaroxaban) may not be detected reliably on standard TEG/ROTEM |
| Time to full result | Full fibrinolysis analysis takes 30-60 min (though early parameters A5/A10/rTEG give rapid data in 5-15 min) |
| Calibration | Requires daily quality calibration and trained staff |
| Shear sensitivity | Tests performed at low shear (venous blood model); may underestimate arterial hemostasis |
| VWF not assessed | VWF-platelet interactions not captured (VWD Type 1-2 may appear normal) |
| No flow | Static model - does not replicate flowing blood hemostasis |
| Long testing times for fibrinolysis | LY30/CLI30 still requires 30 minutes |
12. Comparison with Conventional Coagulation Tests
| Feature | PT/INR | aPTT | Platelet Count | Fibrinogen | TEG/ROTEM |
|---|---|---|---|---|---|
| Sample | Platelet-poor plasma | Plasma | Whole blood | Plasma | Whole blood |
| Measures | Extrinsic initiation | Intrinsic initiation | Count only | Quantitative only | Global clot formation + strength + lysis |
| Platelet function | No | No | Count only | No | Yes (MA/MCF) |
| Fibrinolysis | No | No | No | Indirectly | Yes (LY30/CLI30) |
| Time to result | 30-45 min | 30-45 min | 30-60 min | 30-45 min | 5-15 min (early) to 30-60 min (full) |
| Point-of-care | No | No | No | No | Yes |
| Hypercoagulability | No | No | No | No | Yes |
| Heparin detection | No | Yes | No | No | Yes (HEPTEM/heparinase) |
| Guide transfusion | Poorly | Poorly | Inadequate | Partially | Best |
13. Current Evidence
- 2026 Cochrane systematic review (PMID 42145275): TEG or ROTEM-guided algorithms in bleeding patients - reduce allogeneic blood product use and may reduce mortality; evidence strongest in cardiac surgery and trauma.
- 2025 Updated systematic review (PMID 41004381): TEG/ROTEM algorithms associated with reduced FFP and platelet transfusion; no consistent reduction in all-cause mortality across all contexts.
- 2025 Systematic review (PMID 39623709): Confirms reduction in blood product use; highlights that benefit is context-dependent (greatest in cardiac surgery).
- Cochrane analysis caveat: While blood product use is reduced, impact on morbidity and mortality needs further prospective trials (especially outside cardiac surgery) - Current Surgical Therapy 14e
14. Quick Viva/MCQ Reference Table
| Question | Answer |
|---|---|
| TEG cup rotation arc | 4°45' every 5 seconds |
| ROTEM pin rotation arc | 4°75' every 6 seconds |
| R time represents | Clotting factor activity (initiation phase) |
| MA represents | Max clot strength (80% platelets, 20% fibrin) |
| Normal R time | 5-10 min |
| Normal MA | 51-69 mm |
| Normal LY30 | <8% |
| LY30 >8% → treatment | Tranexamic acid (TXA) |
| Low MA + normal FIBTEM MCF → | Platelet transfusion |
| Low FIBTEM MCF (<8 mm) → | Fibrinogen concentrate / cryoprecipitate |
| HEPTEM normalizes INTEM CT → | Residual heparin present; give protamine |
| Prolonged R, prolonged K, low α, low MA → | Combined factor + fibrinogen + platelet deficiency → FFP + cryo + platelets |
| Sonoclot PF measures | Clot retraction - platelet contribution |
| TEG: heparin detection method | Heparinase cup (compares native vs. heparinase-treated) |
| ROTEM: fibrinolysis confirmation test | APTEM corrects EXTEM → fibrinolysis confirmed |
| TEG in liver disease (INR 3.0 but narrow tracing) | May be hypercoagulable - do NOT over-transfuse FFP |
| Best indicator of fibrinogen in PPH | FIBTEM A5 or FIBTEM MCF <8 mm |
15. Summary: TEG vs. ROTEM vs. Sonoclot
| Feature | TEG | ROTEM | Sonoclot |
|---|---|---|---|
| Year introduced | 1948 (Hartert) | 1990s | 1975 |
| Cup/Pin movement | Cup (rotates) | Pin (rotates) | Pin (vibrates axially) |
| Output | Spindle tracing | Spindle tracing | Ascending "signature" |
| Separate channels | Limited | 5 channels simultaneously | Limited |
| Fibrinogen isolation | FF-TEG (separate run) | FIBTEM channel | No |
| Platelet function | MA | MCF, EXTEM-FIBTEM | PF score |
| Heparin monitoring | Heparinase cup | HEPTEM channel | gbACT (excellent) |
| Cardiac surgery | Good | Excellent | Excellent |
| Availability | Widespread (North America) | Widespread (Europe, globally) | Less common |
| Point-of-care | Yes | Yes | Yes |