
wagner classification with images in a single slide like image
Wagner classification diabetic foot ulcer grades 0-5 clinical images diagram
A clean medical education single slide showing the Wagner Classification of Diabetic Foot Ulcers. The slide has a dark navy blue header bar with white bold title text "Wagner Classification of Diabetic Foot Ulcers". Below the header, there are 6 grade boxes arranged horizontally in a single row, each with a distinct color gradient from green (Grade 0) progressing through yellow, orange, to deep red (Grade 5), representing severity. Each grade box contains: the grade number in large bold font at the top, a simple clean clinical illustration or icon of the foot showing the lesion depth/extent, and 3-4 bullet points of key features below. Grade 0 (green): "Foot at Risk - No open lesion, Bony deformities, Thick calluses, Neuropathy present". Grade 1 (yellow-green): "Superficial Ulcer - Skin full thickness broken, No subcutaneous tissue involvement, Not infected". Grade 2 (yellow): "Deep Ulcer - Extends to tendon/capsule/bone, Fat and ligaments exposed, Not infected". Grade 3 (orange): "Deep Ulcer + Abscess/Osteomyelitis - Deep infection, Abscess formation, Osteomyelitis or septic arthritis". Grade 4 (red-orange): "Partial Gangrene - Forefoot or heel gangrene, Limited necrosis of toes, Vascular involvement". Grade 5 (deep red/black): "Extensive Gangrene - Whole foot gangrene, Systemic sepsis, Major amputation required". At the bottom of the slide, a color-coded severity arrow spans left to right labeled 'Increasing Severity' with 'Management' row showing: Grade 0=Accommodative footwear; Grade 1=Total contact cast; Grade 2=Surgical debridement; Grade 3=Debridement + antibiotics; Grade 4=Partial amputation; Grade 5=Major amputation. Clean white background, professional medical style, high contrast.
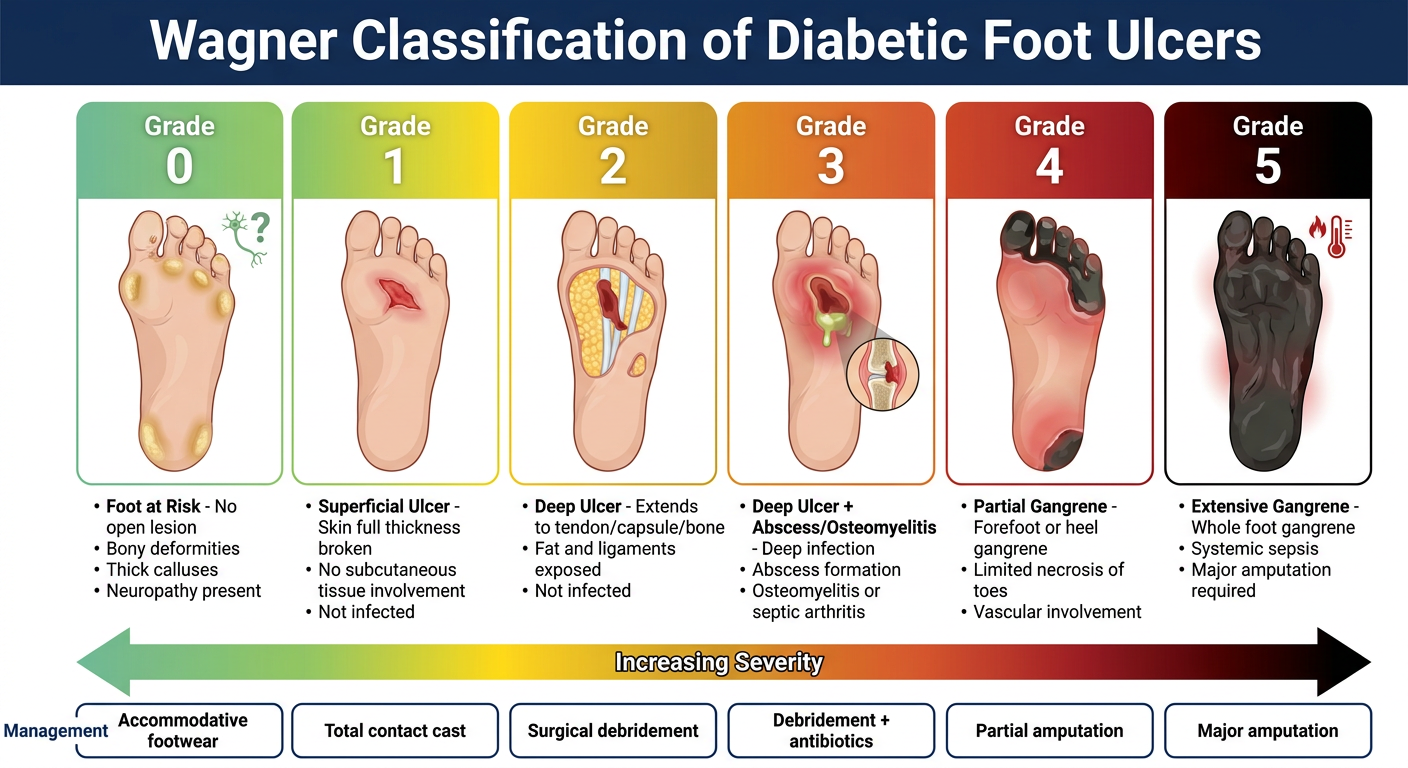

Wagner Classification of Diabetic Foot Ulcers - Summary
| Grade | Description | Key Features | Management |
|---|---|---|---|
| 0 | Foot at Risk | No open lesion; bony deformities, thick calluses, neuropathy | Accommodative footwear, serial exams, patient education |
| 1 | Superficial Ulcer | Full-thickness skin break; no subcutaneous involvement; not infected | Office debridement, total contact cast |
| 2 | Deep Ulcer | Extends to tendon, joint capsule, or bone; fat/ligaments exposed; not infected | Surgical debridement, off-loading, culture-specific antibiotics |
| 3 | Deep Ulcer + Osteomyelitis | Deep infection with abscess, osteomyelitis, or septic arthritis | Surgical debridement or partial amputation, IV antibiotics |
| 4 | Partial Gangrene | Forefoot or heel gangrene; limited necrosis of toes/foot | Vascular reconstruction + partial foot amputation |
| 5 | Extensive Gangrene | Whole-foot gangrene; systemic effects | Major extremity amputation |
- Grades 0-3 progress by depth of tissue involvement
- Grades 4-5 progress by extent of gangrene (partial vs. whole foot)
- Grade 3 is the critical cutoff - osteomyelitis changes management dramatically (IV antibiotics, bone resection)
- Grades 4 and 5 mandate amputation; extent is determined by vascular status
Target glycemic coontrol in image
target glycemic control HbA1c fasting postprandial goals ADA 2024 guidelines table
A clean professional medical education single-slide infographic titled "Target Glycemic Control in Diabetes" with a dark teal header bar and white bold title text. The slide is divided into clear sections: TOP SECTION - "ADA Glycemic Targets" with 3 large colored metric boxes in a row: - Box 1 (blue): HbA1c icon, large text "< 7%", subtext "Most non-pregnant adults" - Box 2 (green): fasting glucose icon, large text "80–130 mg/dL", subtext "Preprandial / Fasting" - Box 3 (orange): postprandial icon, large text "< 180 mg/dL", subtext "2h Postprandial (Peak)" MIDDLE SECTION - "Individualized HbA1c Targets" table with 4 rows: - Row header: Patient Type | HbA1c Goal - Row 1 (green): "Newly diagnosed, young, no comorbidities, long life expectancy" | "< 6.5%" - Row 2 (blue): "Most non-pregnant adults (standard goal)" | "< 7%" - Row 3 (yellow): "Elderly, frail, limited life expectancy, multiple comorbidities" | "7–8%" - Row 4 (red): "Severe hypoglycemia unawareness, advanced complications" | "< 8% (less stringent)" BOTTOM SECTION - Two panels side by side: Left panel "CGM Time-in-Range Goals" with a horizontal color bar showing: Time Below Range (<70 mg/dL) < 4% in red | Time in Range (70–180 mg/dL) > 70% in green | Time Above Range (>180 mg/dL) < 25% in yellow. Below: "GMI correlates with HbA1c" Right panel "Special Populations" with 3 mini boxes: - Pregnancy: "< 6% ideal; fasting < 95, 1h PP < 140, 2h PP < 120 mg/dL" - Pediatrics: "< 7% (ADA); < 6.5% if safe" - CKD/Dialysis: "Individualized; avoid hypoglycemia" Footer note: "ADA 2024 | Harrison's 22E | Katzung 16E" in small text. Clean white background, modern flat design, high contrast colors, professional medical style.
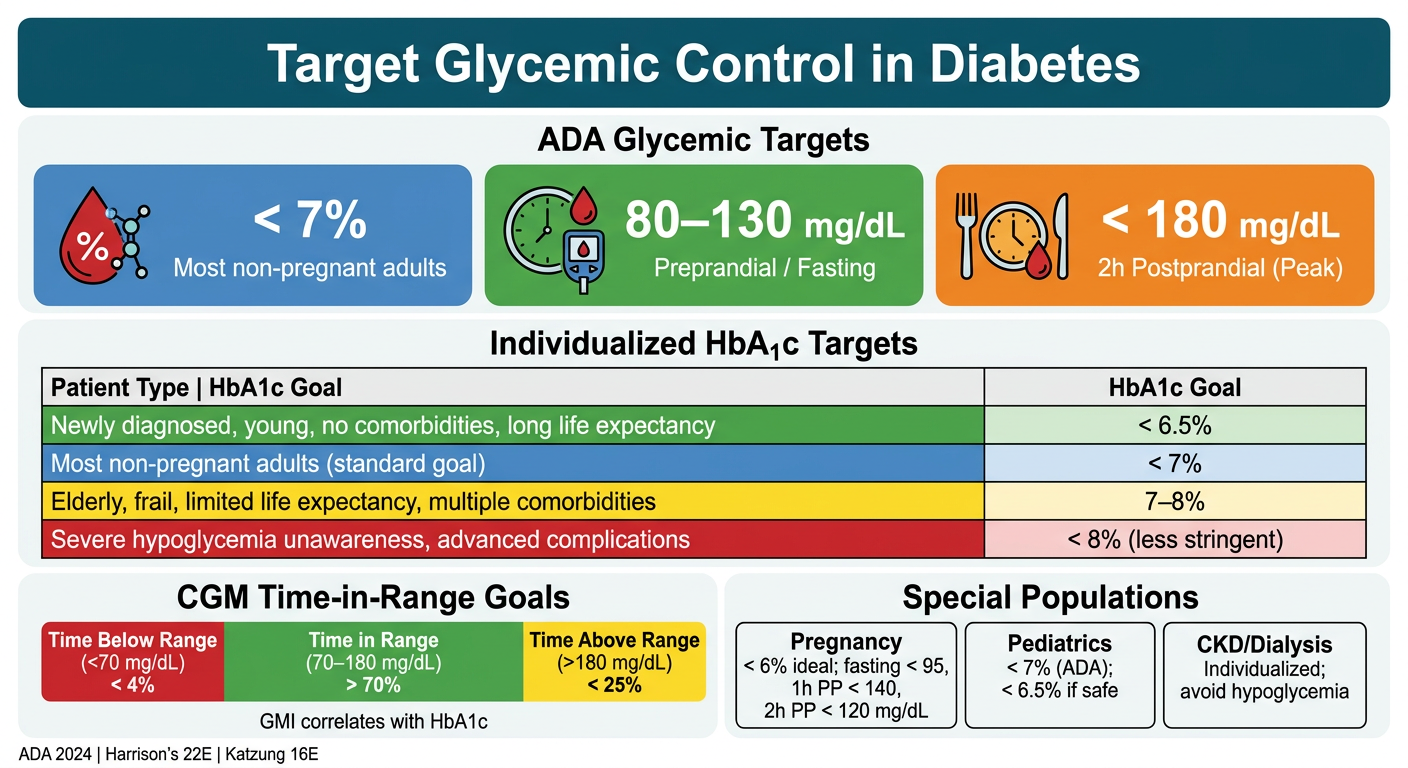
Target Glycemic Control - Key Values
| Parameter | Target |
|---|---|
| HbA1c | < 7% (53 mmol/mol) |
| Fasting / Pre-meal glucose | 80-130 mg/dL (4.4-7.2 mmol/L) |
| Peak post-meal glucose (2h) | < 180 mg/dL (10 mmol/L) |
| Patient Type | HbA1c Target |
|---|---|
| Young, newly diagnosed, long life expectancy | < 6.5% |
| Standard - most adults | < 7% |
| Elderly, frail, multiple comorbidities | 7-8% |
| Severe hypoglycemia unawareness / advanced disease | < 8% (less stringent) |
- Time in range (70-180 mg/dL): > 70%
- Time below range (< 70 mg/dL): < 4% (< 1% below 54 mg/dL)
- Time above range (> 180 mg/dL): < 25%
- Pregnancy: Fasting < 95, 1h PP < 140, 2h PP < 120 mg/dL; HbA1c < 6%
- Children/Adolescents: HbA1c < 7% (< 6.5% if achievable without hypoglycemia risk)
- CKD/Dialysis: Individualized; HbA1c may be unreliable - use fructosamine or CGM
What is time in range ?
Time in Range (TIR)
How It's Measured
- TIR - % time glucose is within target
- Time Above Range (TAR) - % time glucose is too high
- Time Below Range (TBR) - % time glucose is too low
- GMI (Glucose Management Indicator) - correlates with HbA1c
- Glucose variability
Target Ranges and Goals
| Zone | Glucose Range | Target |
|---|---|---|
| Time in Range (TIR) | 70-180 mg/dL (3.9-10 mmol/L) | > 70% |
| Time Below Range (TBR) | < 70 mg/dL | < 4% |
| Time Very Low | < 54 mg/dL | < 1% |
| Time Above Range (TAR) | > 180 mg/dL | < 25% |
70% TIR = approximately 16.8 hours/day in range
Why TIR Matters - vs HbA1c
| Feature | HbA1c | TIR |
|---|---|---|
| Reflects | Average glucose over 2-3 months | Daily glucose fluctuation in real time |
| Captures hypoglycemia | No | Yes |
| Captures glucose variability | No | Yes |
| Affected by anemia/hemoglobinopathy | Yes | No |
| Actionable same day | No | Yes |
Special Population TIR Targets
| Population | TIR Target | Range |
|---|---|---|
| Most adults with T1/T2 DM | > 70% | 70-180 mg/dL |
| Pregnancy | > 70% | 63-140 mg/dL (tighter range) |
| Elderly / High hypoglycemia risk | > 50% | 70-180 mg/dL |
Practical Tip
wound care - to put in slide
A professional medical education single-slide infographic titled "Wound Care" with a dark green header bar and white bold title text. The slide is divided into 5 clean color-coded sections arranged in a grid layout: SECTION 1 - Top left (blue box) titled "1. Debridement": Icon of a scalpel. Bullet points: • Remove all non-viable tissue and hypertrophic callus • Sharp debridement with scalpel (parallel to callus edge) • Convert chronic wound → acute healing wound • Excise all infected soft tissue AND bone • Necrotic tissue = medium for bacterial growth - must be removed • Pumice stone for thin callus; scalpel for thick callus SECTION 2 - Top center (teal box) titled "2. Wound Cleansing": Icon of a syringe/saline. Bullet points: • Irrigate with normal saline using syringe + needle (high pressure) • Reduces bacterial load and debris • AVOID hydrogen peroxide and betadine - damages viable tissue • Probe ulcer with sterile swab - if bone felt → osteomyelitis presumed • Wound culture only after thorough debridement SECTION 3 - Top right (orange box) titled "3. Dressings": Icon of a bandage/dressing. Bullet points: • Apply dressing DAILY to maintain moist environment • Moist environment → minimizes desiccation → facilitates healing • High exudate wound → absorptive dressing (foam, alginate) • Low exudate wound → moisture-adding dressing (hydrogel) • Moist-to-dry gauze → mechanical debridement on removal • Silver-containing dressings for antimicrobial action SECTION 4 - Bottom left (purple box) titled "4. Off-loading": Icon of a foot/cast. Bullet points: • MOST IMPORTANT for Grade I ulcers (more than dressing type) • Total Contact Cast (TCC) - gold standard • Redistributes plantar forces to the leg • TCC > prefabricated shoes for midfoot/hindfoot ulcers • Alternatives: walking brace, custom footwear, wheelchair SECTION 5 - Bottom right (red box) titled "5. Infection Management": Icon of bacteria/antibiotic pill. Bullet points: • Signs: erythema, induration, increased exudate, pain • Superficial colonization ≠ infection → NO antibiotics needed • Deep tissue invasion → systemic antibiotics + debridement • Culture from viable tissue (not necrotic areas) • Ulcer communicating with bone → surgical debridement required • Negative pressure wound therapy (VAC) for complex wounds Bottom footer bar in dark green: "Campbell's Operative Orthopaedics 15E | Sabiston Textbook of Surgery | Bailey & Love 28E" Clean white background, modern flat design icons, professional medical style, high contrast colors.
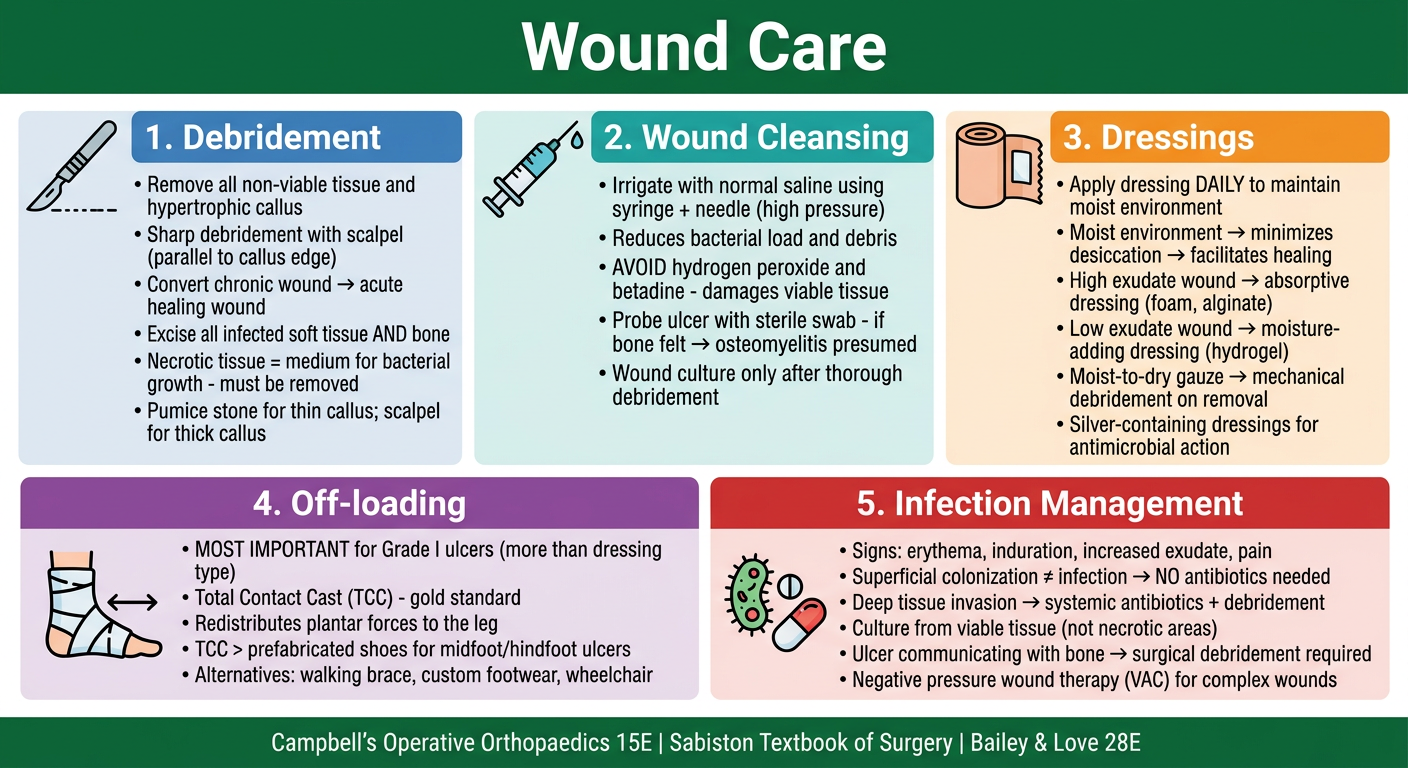
Wound Care - Key Principles
1. Debridement
- Remove all non-viable tissue and hypertrophic callus - this converts a chronic non-healing wound into an acute wound capable of healing
- Sharp debridement with scalpel (blade parallel to callus edge, remove in thin layers)
- All infected tissue - soft tissue AND bone - must be excised (reduces bacterial load and harmful matrix metalloproteinases)
- Pumice stone for thin callus; scalpel for thick
2. Wound Cleansing
- Irrigate with normal saline using syringe + needle under pressure
- AVOID hydrogen peroxide and betadine - they damage viable tissue and delay healing
- Probe ulcer with sterile swab - if bone is felt, osteomyelitis may be presumed
- Wound cultures should be taken from viable tissue after debridement, not from necrotic areas
3. Dressings
- Maintain a moist wound environment - daily dressing changes
- High exudate wounds → absorptive dressings (alginate, foam)
- Low exudate wounds → moisture-adding dressings (hydrogel, saline-soaked gauze)
- Moist-to-dry gauze provides mechanical debridement on removal
- Silver-containing dressings for antimicrobial effect
- VAC (negative pressure wound therapy) promotes granulation in complex wounds
4. Off-loading (most important step for plantar ulcers)
- Total Contact Cast (TCC) - gold standard; redistributes forces from plantar surface to the leg
- TCC is superior to prefabricated shoes especially for midfoot/hindfoot ulcers
- Alternatives: removable walking brace, custom footwear, wheelchair
5. Infection Management
- Signs: erythema, induration, increased exudate, pain
- Most ulcers are colonized (not infected) → no antibiotics needed
- Deep tissue invasion → systemic antibiotics (culture-guided) + debridement
- Ulcer with direct communication to bone → surgical debridement required
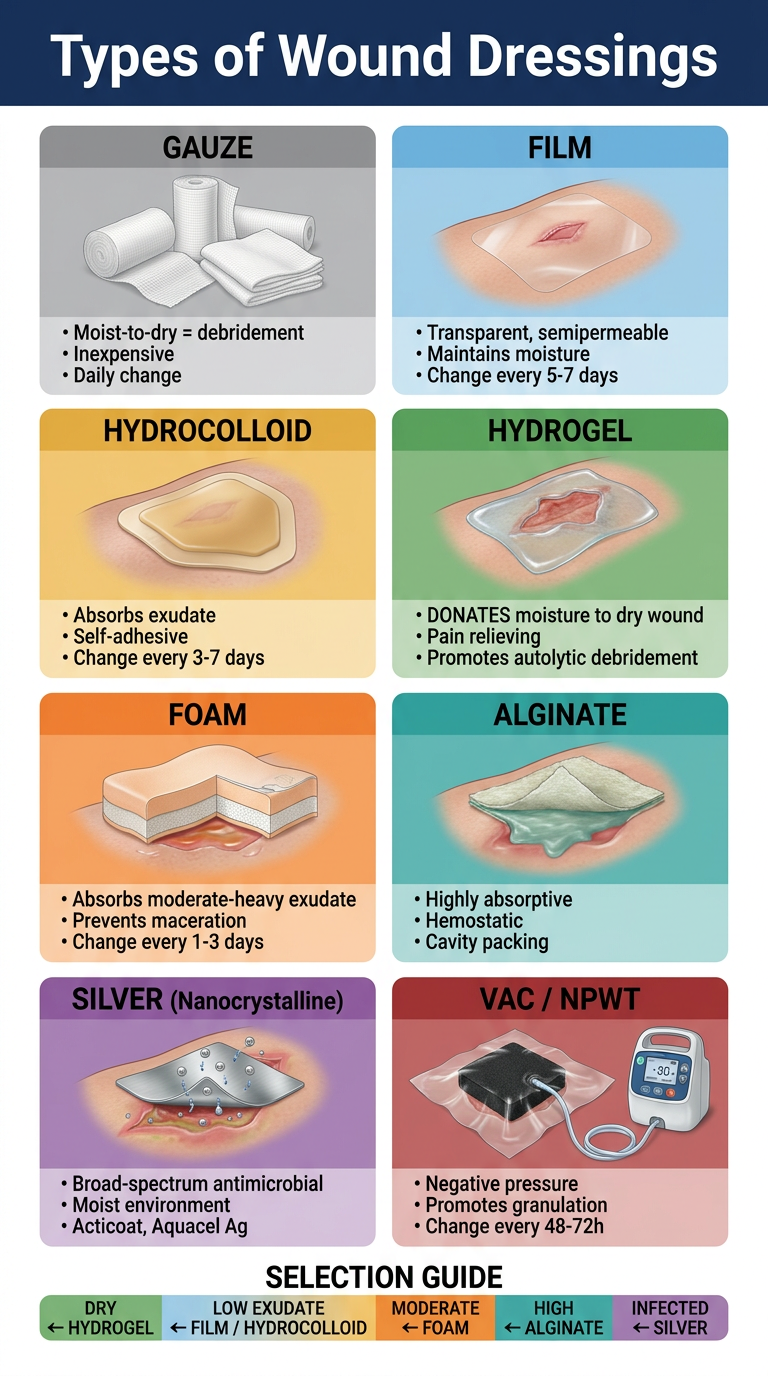
Dressing
A professional medical education single-slide infographic titled "Wound Dressings" with a deep navy blue header bar and white bold title text. The slide contains a clean grid of 8 dressing type cards arranged in 2 rows of 4, each card color-coded and containing: dressing name in bold at top, a small icon/illustration, key properties, indications, and change frequency. Layout: ROW 1: Card 1 - GAUZE (light gray background): Icon: layered gauze rolls • Inexpensive, widely available • Cotton + cellulose acetate • Moist-to-dry = mechanical debridement • Impregnated types: petrolatum, paraffin • Change: Daily Indication: General wounds, packing cavities Card 2 - FILM (light blue background): Icon: transparent adhesive sheet • Transparent, semipermeable • Non-absorbent • Maintains moisture • Allows gas exchange • Change: Every 5-7 days (self-falls off) Indication: Superficial, low-exudate wounds Card 3 - HYDROCOLLOID (yellow background): Icon: cushioned pad • Absorbs exudate • Provides protective cushioning • Self-adhesive, waterproof • Opaque - cannot see wound • NO antimicrobial properties • Change: Every 3-7 days Indication: Mild-moderate exudate, pressure ulcers Card 4 - HYDROGEL (light green background): Icon: gel-filled dressing • PROVIDES moisture (rehydrates wound) • Cooling, pain-reducing • Non-adherent, gentle • Promotes autolytic debridement • Change: Daily to every 3 days Indication: Dry/sloughy wounds, painful wounds ROW 2: Card 5 - FOAM (orange background): Icon: foam pad with layers • Semi-occlusive, polyurethane-based • Absorbs moderate-heavy exudate • Prevents maceration • Hydrophilic inner + hydrophobic outer • Change: Every 1-3 days Indication: Moderate-high exudate wounds Card 6 - ALGINATE (teal background): Icon: seaweed-fiber mat • Derived from seaweed • Highly absorptive - forms gel on contact • Contains hemostatic agents • For cavity packing • Change: When saturated (1-3 days) Indication: Heavy exudate, bleeding wounds, cavities Card 7 - SILVER (purple/antimicrobial background): Icon: silver-colored dressing • Nanocrystalline silver • Broad-spectrum antimicrobial • Creates moist environment • Less frequent changes • Examples: Acticoat, Aquacel Ag • Change: Every 3-7 days Indication: Infected / contaminated wounds Card 8 - NEGATIVE PRESSURE / VAC (red/dark background): Icon: suction pump with tubing • Vacuum-assisted closure • Promotes granulation tissue • Removes excess exudate • Reduces bacterial load • Caution: Do NOT use over exposed bowel • Change: Every 48-72 hours Indication: Complex/deep wounds, post-surgical BOTTOM BAR: A horizontal color-coded selection guide strip labeled "Choose by Exudate Level": DRY → Hydrogel | LOW → Film, Hydrocolloid | MODERATE → Foam | HIGH → Alginate, Silver | INFECTED → Silver, Iodine Footer: "Dermatology 5E (Elsevier) | Rosen's Emergency Medicine | Sabiston Surgery" in small text. Clean white background, modern flat design, professional medical style.
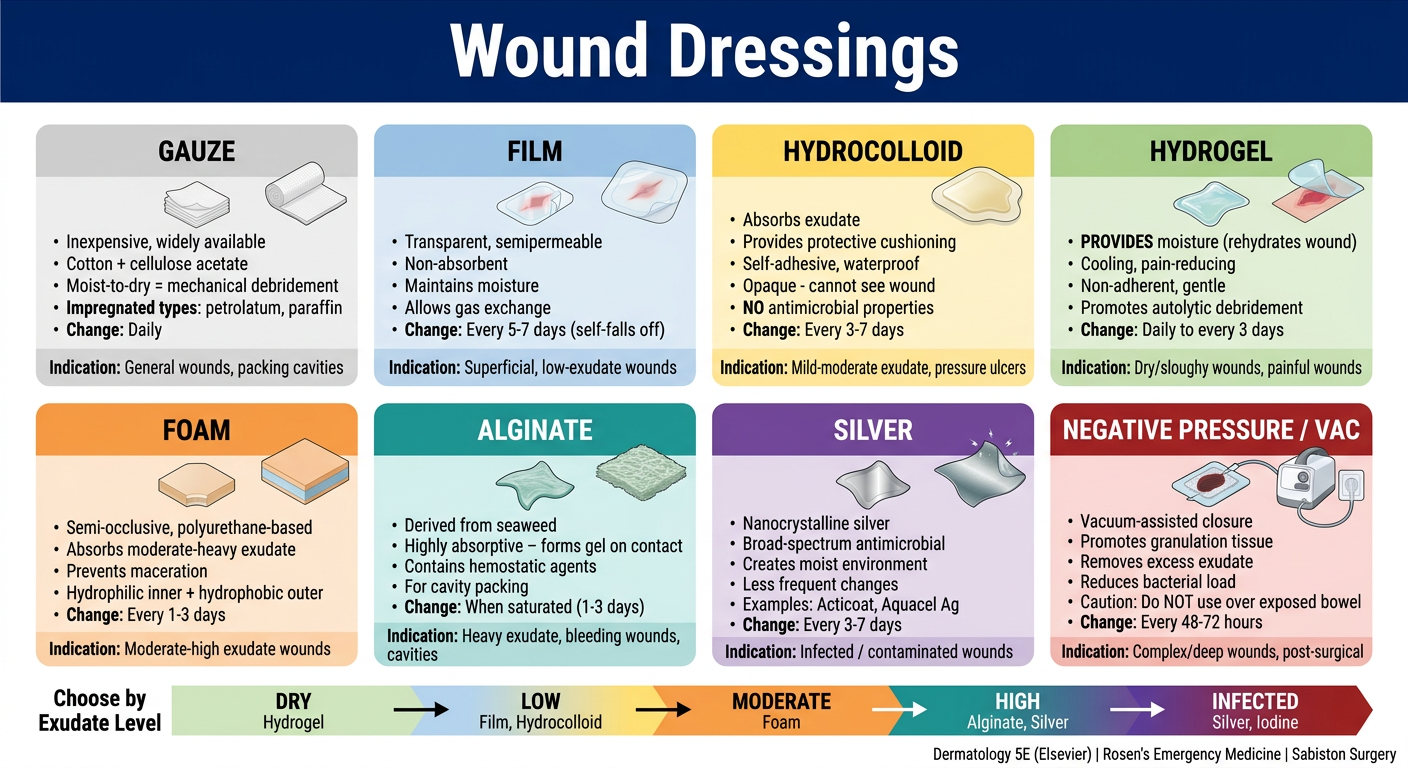
Wound Dressings - Quick Reference
| Dressing | Mechanism | Exudate Level | Change Frequency | Best For |
|---|---|---|---|---|
| Gauze | Absorbs / mechanical debridement (moist-to-dry) | Any | Daily | General wounds, cavity packing |
| Film | Semipermeable - maintains moisture, gas exchange | Dry / minimal | Every 5-7 days | Superficial, low-exudate wounds |
| Hydrocolloid | Absorbs exudate, forms protective gel | Low-moderate | Every 3-7 days | Pressure ulcers, shallow wounds |
| Hydrogel | Donates moisture, rehydrates dry wound | Dry / minimal | Daily - every 3 days | Dry, necrotic, painful wounds |
| Foam | Semi-occlusive polyurethane; absorbs + retains fluid | Moderate-heavy | Every 1-3 days | Exudative wounds, preventing maceration |
| Alginate | Seaweed-derived; forms gel; hemostatic | Heavy / bleeding | When saturated (1-3 days) | Heavy exudate, bleeding, cavity wounds |
| Silver | Nanocrystalline silver; broad-spectrum antimicrobial | Infected/contaminated | Every 3-7 days | Infected wounds (Acticoat, Aquacel Ag) |
| VAC / NPWT | Negative pressure removes exudate, promotes granulation | Complex/deep | Every 48-72 hours | Deep wounds, post-surgical defects |
Selection Rule (by exudate):
Key Principles:
- Primary dressing = contacts the wound directly
- Secondary dressing = covers/secures the primary dressing
- Avoid hydrogen peroxide and betadine - they destroy viable cells
- Moist environment is always the goal - prevents desiccation, accelerates re-epithelialization
Image
A professional medical education poster titled "Types of Wound Dressings" with a dark navy header. The poster shows 8 dressing types arranged in a 2x4 grid, each with a realistic clinical-style illustration of the dressing and a color-coded label. Each box has a distinct background color and contains a realistic drawing/visual of the dressing product appearance, its name in bold, and 2-3 key bullet points in small text. Box 1 (gray): Shows layered white gauze rolls and pads. Title: "GAUZE". Bullets: Moist-to-dry = debridement • Inexpensive • Daily change Box 2 (light blue): Shows a clear transparent adhesive film sheet applied over skin. Title: "FILM". Bullets: Transparent, semipermeable • Maintains moisture • Change every 5-7 days Box 3 (amber/yellow): Shows a thick cushioned tan-colored wafer pad. Title: "HYDROCOLLOID". Bullets: Absorbs exudate • Self-adhesive • Change every 3-7 days Box 4 (green): Shows a clear gel-filled sheet dressing on a wound. Title: "HYDROGEL". Bullets: DONATES moisture to dry wound • Pain relieving • Promotes autolytic debridement Box 5 (orange): Shows a thick soft foam pad with absorbent layers cross-section diagram. Title: "FOAM". Bullets: Absorbs moderate-heavy exudate • Prevents maceration • Change every 1-3 days Box 6 (teal): Shows fibrous seaweed-derived mat that gels on contact. Title: "ALGINATE". Bullets: Highly absorptive • Hemostatic • Cavity packing Box 7 (purple): Shows a silver-grey antimicrobial dressing pad. Title: "SILVER (Nanocrystalline)". Bullets: Broad-spectrum antimicrobial • Moist environment • Acticoat, Aquacel Ag Box 8 (dark red): Shows a VAC/NPWT foam sponge connected to suction tubing and a pump unit. Title: "VAC / NPWT". Bullets: Negative pressure • Promotes granulation • Change every 48-72h At the bottom, a horizontal color bar "SELECTION GUIDE" with arrows: DRY ← HYDROGEL | LOW EXUDATE ← FILM / HYDROCOLLOID | MODERATE ← FOAM | HIGH ← ALGINATE | INFECTED ← SILVER Clean white background, realistic medical illustration style, clear labels, professional and educational.
What is OVIVA Trial
OVIVA trial oral versus intravenous antibiotics bone joint infection
OVIVA trial oral vs IV antibiotics bone joint infection results 2019 NEJM
PMID: 30699315
The OVIVA Trial
Background / Question
Study Design
| Feature | Detail |
|---|---|
| Type | Multicenter, open-label, non-inferiority RCT |
| Sites | 26 UK centers |
| Funded by | NIHR (National Institute for Health Research) |
| Patients | 1,054 adults with bone/joint infection |
| Conditions included | Osteomyelitis, septic arthritis, prosthetic joint infection, vertebral osteomyelitis/discitis |
Intervention
- Within 7 days of surgery (or 7 days after starting antibiotics if no surgery), patients randomized to:
- Oral antibiotics for 6 weeks, OR
- IV antibiotics for 6 weeks
- Follow-on oral antibiotics permitted in both groups after the 6-week period
Primary Endpoint
Non-inferiority margin: 7.5 percentage points
Key Results
| Outcome | IV Group | Oral Group | Result |
|---|---|---|---|
| Treatment failure at 1 year | 14.6% (74/506) | 13.2% (67/509) | Oral NON-INFERIOR (diff -1.4%, 95% CI -5.6 to 2.9) |
| Serious adverse events | 27.7% | 26.2% | No difference (p=0.58) |
| Catheter complications | 9.4% | 1.0% | Significantly more in IV group |
| Early treatment discontinuation | 18.9% | 12.8% | More in IV group (p=0.006) |
| Median hospital stay | 14 days | 11 days | Shorter with oral (p<0.001) |
| C. difficile infection | 1.7% | 1.0% | No significant difference |
| All-cause mortality | 7.7% (17 pts) | 2.7% (6 pts) | Small numbers, not powered for this |
Conclusion
"Oral antibiotic therapy was noninferior to intravenous antibiotic therapy when used during the first 6 weeks for complex orthopedic infection."
Why It Matters
- Challenged dogma - decades of IV-only practice for osteomyelitis overturned
- Fewer complications - IV catheters carry real risks (thrombosis, line sepsis, CLABSI)
- Shorter hospital stay - 3 fewer days on average with oral
- Better QoL - patients can go home and take tablets
- Cost savings - IV antibiotics at home (outpatient parenteral antibiotic therapy / OPAT) is expensive and resource-intensive
- If the gut works, use it - the OVIVA mantra in infectious disease circles
Limitations
- Not blinded (impractical due to multi-week duration)
- Open-label design could introduce bias
- UK-only centers (antibiotic choices may differ from other countries)
- Significant crossover between groups
- Not all bone/joint infections are equal - prosthetic joint infections may behave differently