

Solve this
- Q.1: Cardiac cycle (definition, phases, pressure/volume changes with diagram)
- Q.2(a): Facilitated diffusion including factors affecting it
- Q.2(b): Genesis of Resting membrane potential
- Q.1: Composition & functions of gastric juice, mechanism of HCl secretion, regulation of gastric secretion
- Q.2(a): Oxygen dissociation curve
- Q.2(b): Cheyne-Stokes breathing
- Q.2(c): Tubulogiomerular feedback mechanism
- Q.2(d): Cystometrogram
- Q.2(e): Ventilation perfusion ratioNow let me search the medical library for all topics in parallel:
HCl secretion mechanism parietal cell gastric
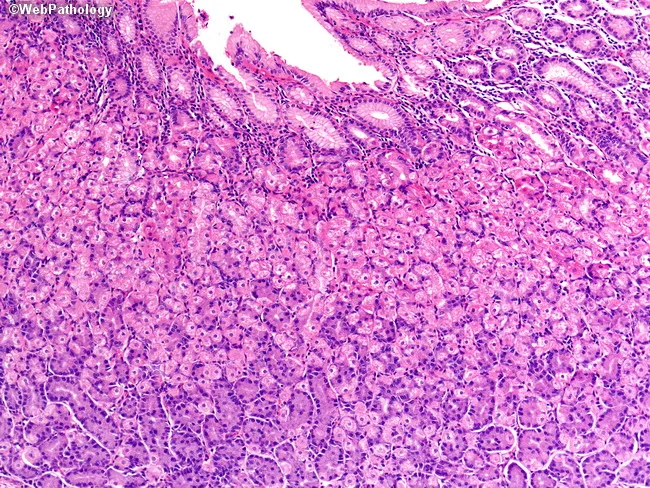
This is a bright-field light microscopy image of fixed gastric mucosa section stained with Hematoxylin and Eosin (H&E). The tissue shows gastric pits with an isthmus and neck populated by conspicuous parietal (oxyntic) cells with abundant eosinophilic cytoplasm and central nuclei. Parietal cells secrete hydrochloric acid and intrinsic factor, essential for digestion and B12 absorption. Deeper in the gland, chief (peptic) cells possess basophilic cytoplasm and secrete pepsinogen. Interspersed neuroendocrine cells release hormones; a stem cell zone resides at the neck, supporting constant epithelial renewal. The overall architecture corresponds to fundic-type oxyntic mucosa with tubular glands arranged in distinct isthmus/neck and base compartments. No overt inflammatory infiltrate or architectural distortion is evident, consistent with normal histology. This image is valuable for teaching gastric histology, differentiating mucous neck cells, parietal cells, chief cells, enteroendocrine cells, and stem cell niches, and for contextualizing pathologies affecting acid secretion, intrinsic factor production, or gastric carcinogenesis in educational and research settings.
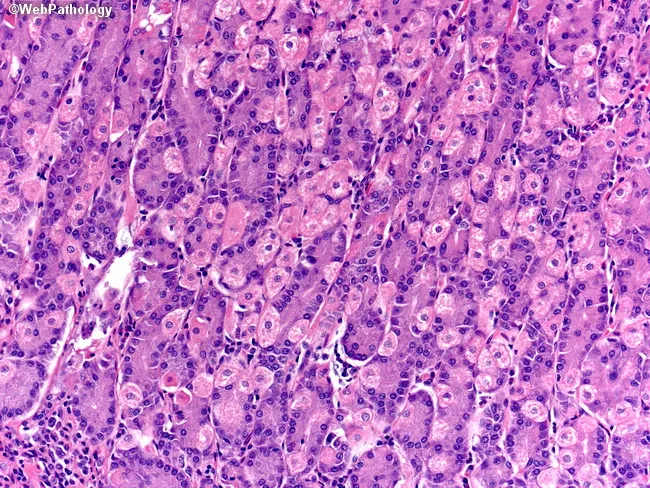
Gastric mucosal histology viewed by bright-field light microscopy on a Hematoxylin and Eosin (H&E) stained section of mucosa from the stomach, typically the oxyntic/fundic region. The glands are tubular and packed with two principal cell types: parietal (oxyntic) cells and chief (peptic) cells. Parietal cells display abundant eosinophilic (pink) cytoplasm and a central or slightly eccentric nucleus, giving a characteristic fried-egg appearance; they contribute acid secretion via gastric H+/K+-ATPase. Chief cells have basophilic (purple) cytoplasm with basal nuclei and apical zymogen granules, reflecting pepsinogen production. Neuroendocrine cells are present in minute numbers and are usually inconspicuous on routine H&E sections. Stem cells are scarce and not readily visible without special markers. The overall architecture shows intact gastric fundic glands with uniform cell density, minimal cytologic atypia, and preserved mucosal layering. The image emphasizes contrasts between cytoplasmic staining: eosinophilic parietal cells versus basophilic chief cells, as well as the densely staining nuclei. This morphology is essential for recognizing normal gastric mucosa, distinguishing parietal cell-rich areas, and identifying early metaplastic changes or inflammatory patterns in gastritis. Clinically, such images support reports of gastric biopsy evaluation, autoimmune gastritis assessment, and correlating acid-secreting cell distribution with disorders of digestion and nutrition and metabolic balance.
cystometrogram bladder pressure volume
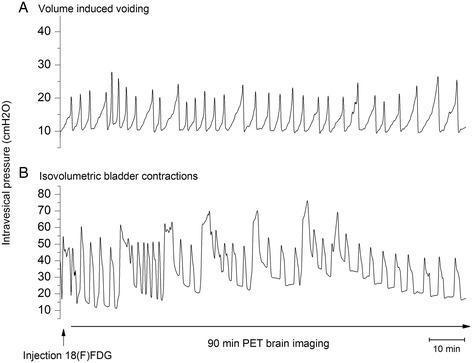
This diagnostic comparison chart displays two cystometrogram (CMG) plots recording intravesical pressure (cmH2O) over a 90-minute temporal duration, synchronized with (18F)FDG-PET brain imaging. Plot A illustrates volume-induced voiding, characterized by regular, rhythmic sawtooth pressure fluctuations ranging between 10 and 30 cmH2O. This pattern reflects a consistent cycle of bladder filling and reflexive emptying. Plot B displays isovolumetric bladder contractions, which exhibit significantly higher pressure amplitudes, reaching up to 70–80 cmH2O. The contractions in the isovolumetric state are more irregular and show a gradual decline in both amplitude and frequency toward the end of the 90-minute session, suggesting detrusor muscle fatigue or adaptive mechanisms. The visual data is essential for understanding the neurophysiological and mechanical differences between normal micturition cycles and states of obstructed or constrained bladder outflow. This content is relevant for urology and functional neuroimaging education, focusing on lower urinary tract (LUT) physiology.
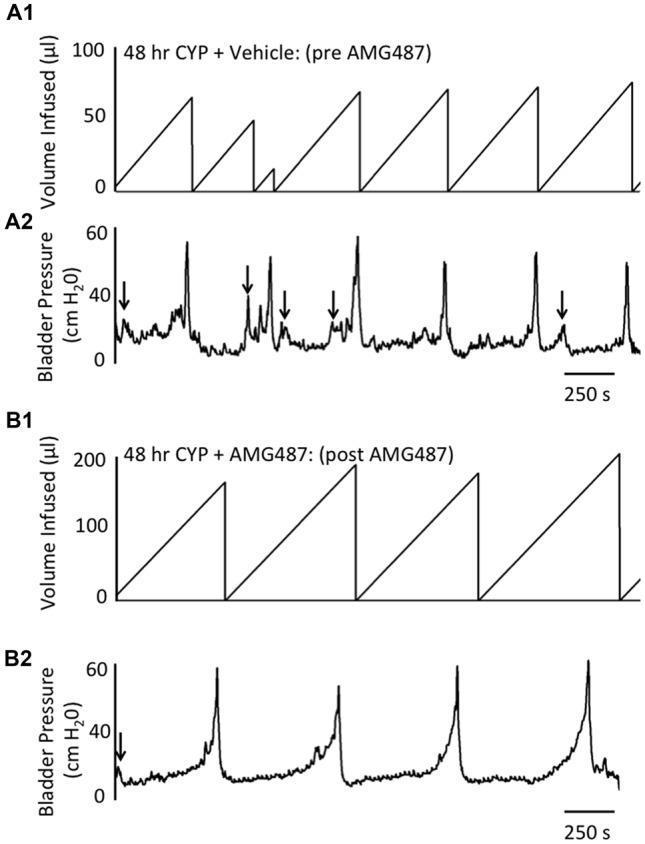
This diagnostic graphic presents cystometrogram recordings from a mouse model of cyclophosphamide (CYP)-induced cystitis, comparing bladder function before and after CXCR3 receptor blockade. The data is divided into two sections: Panel A (Pre-AMG487) and Panel B (Post-AMG487). Each section includes two synchronized tracings: Volume Infused (μl) in charts A1 and B1, and Bladder Pressure (cm H2O) in charts A2 and B2. In the pre-treatment phase (A1, A2), the bladder demonstrates frequent voiding cycles with low capacity (~50 μl) and numerous non-voiding contractions (indicated by arrows). Following intravesical infusion of the CXCR3 antagonist AMG487 (B1, B2), there is a significant increase in bladder capacity (~200 μl) and a marked reduction in voiding frequency and non-voiding contractions. The pressure tracings in B2 show more stable filling phases and distinct, higher-amplitude micturition peaks. These findings illustrate the role of the CXCR3 pathway in bladder hyperreflexia and the potential therapeutic efficacy of CXCR3 blockade in managing interstitial cystitis or overactive bladder symptoms.
SECTION A (40 Marks)
Q.1 - Cardiac Cycle (1+2+7 = 10 Marks)
Definition (1 Mark)
Phases of the Cardiac Cycle (2 Marks)
| Phase | Name |
|---|---|
| A | Atrial Systole |
| B | Isovolumetric Ventricular Contraction |
| C | Rapid Ventricular Ejection |
| D | Reduced Ventricular Ejection |
| E | Isovolumetric Ventricular Relaxation |
| F | Rapid Ventricular Filling |
| G | Reduced Ventricular Filling (Diastasis) |
Pressure and Volume Changes with Labelled Diagram (7 Marks)
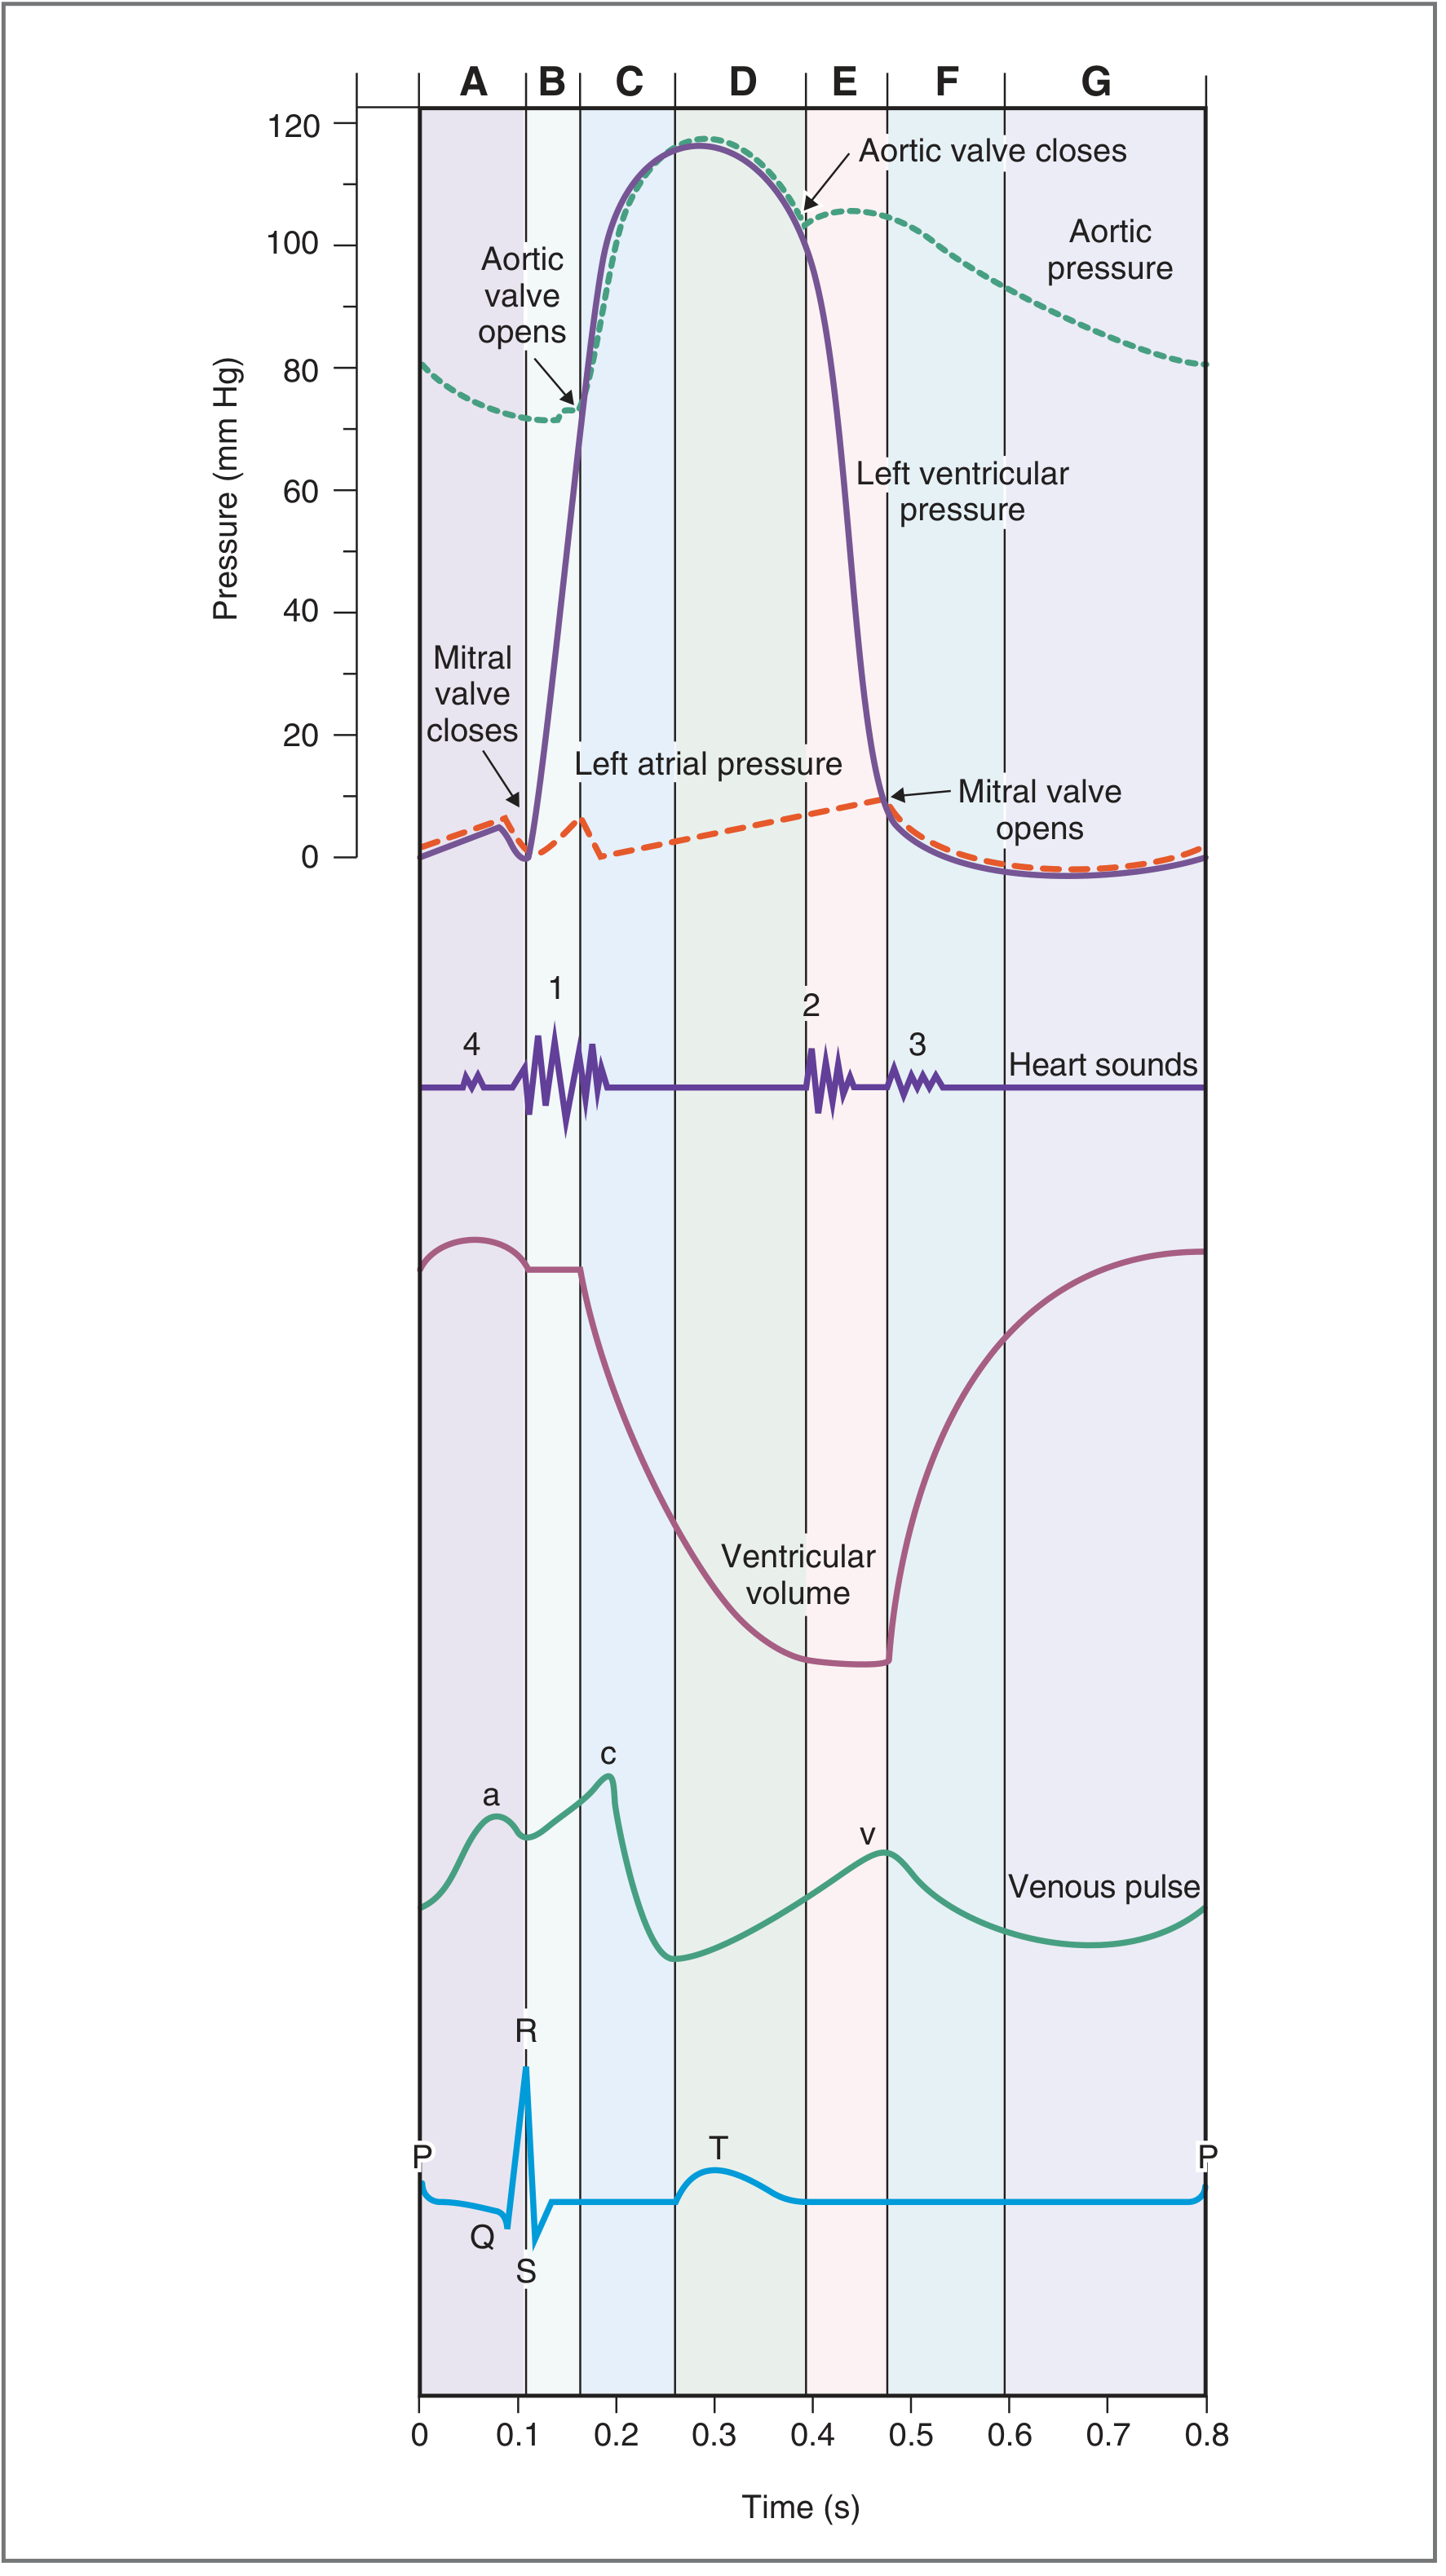
- P wave on ECG triggers atrial depolarization and contraction
- Left atrial pressure rises; atrial blood is ejected into the left ventricle through the open mitral valve
- Ventricular volume increases slightly (final ventricular filling)
- S4 heart sound (not audible normally)
- Venous "a" wave appears
- QRS complex triggers ventricular depolarization
- Ventricular pressure rises sharply
- Both mitral and aortic valves are closed - volume remains constant (end-diastolic volume ~130 mL)
- S1 heart sound (mitral valve closure)
- Ventricular pressure exceeds aortic pressure (~80 mmHg); aortic valve opens
- Blood rapidly ejected into aorta
- Aortic and ventricular pressures rise to peak (~120 mmHg)
- Ventricular volume falls steeply
- ST segment on ECG
- Ventricular ejection continues but at a slower rate
- Aortic pressure begins to fall as blood runs off to periphery
- T wave on ECG (ventricular repolarization)
- Ventricular volume reaches minimum (end-systolic volume ~50 mL)
- Stroke volume = 130 - 50 = ~80 mL
- Ventricles relax; ventricular pressure falls rapidly
- Aortic valve closes (producing the dicrotic notch on aortic pressure trace)
- S2 heart sound (aortic valve closure)
- Both valves closed - ventricular volume remains constant
- Ventricular pressure falls below atrial pressure; mitral valve opens
- Blood flows passively from atrium to ventricle
- Ventricular volume increases rapidly
- S3 heart sound (in disease states)
- Venous "v" wave
- Filling slows down; ventricle nears end-diastolic volume
- No valves open or close; no heart sounds
- Cycle ends and repeats
Q.2(a) - Facilitated Diffusion Including Factors Affecting It (6 Marks)
Definition
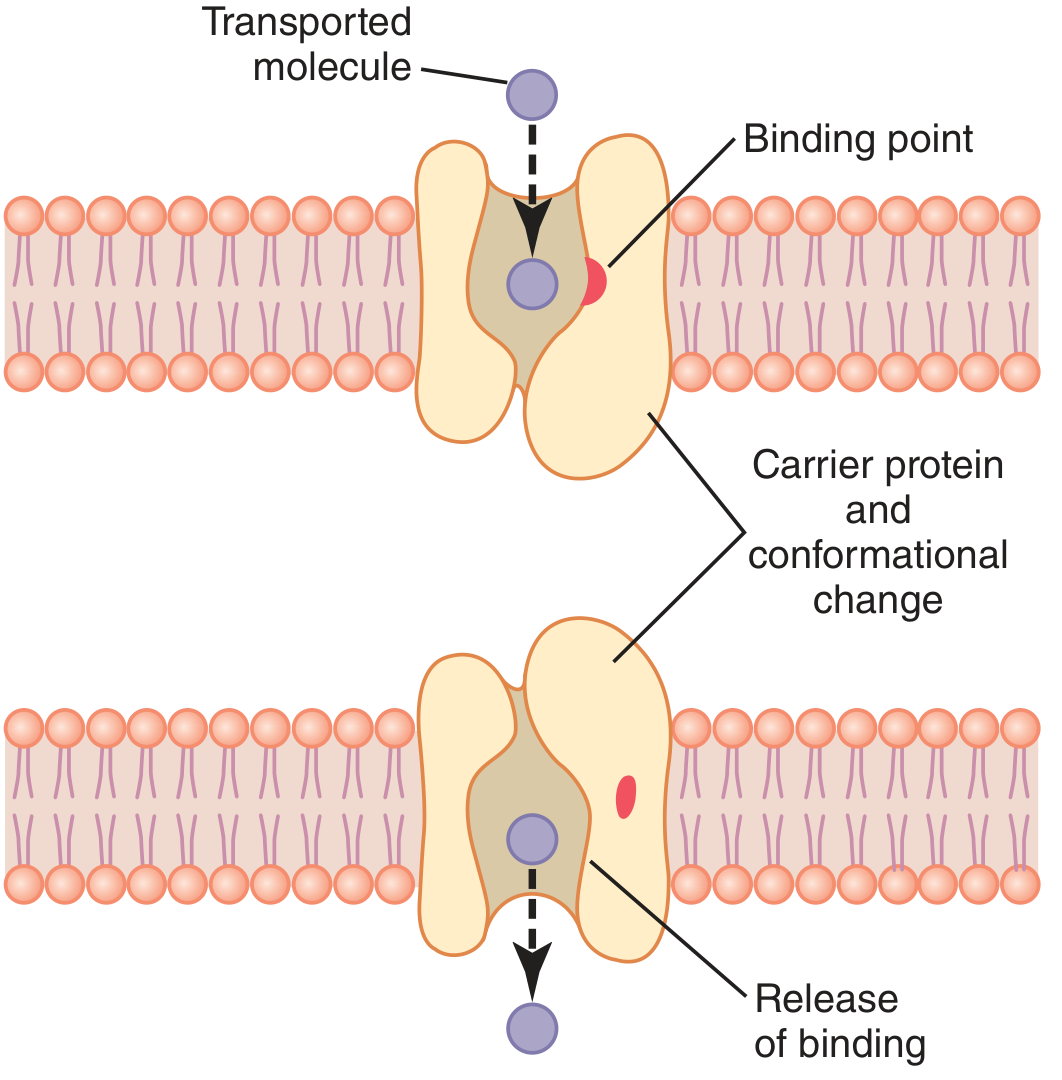
Mechanism
- The substance to be transported binds to a specific receptor site on the carrier protein at one side of the membrane
- The carrier protein undergoes a conformational change (changes shape)
- The pore opens to the opposite side of the membrane
- Due to weak binding, thermal motion of the substance causes it to be released on the other side
- The carrier returns to its original conformation
Factors Affecting Facilitated Diffusion
- Concentration gradient - Greater the difference in concentration across the membrane, the faster the rate (up to Vmax)
- Number of carrier proteins - More carriers available = higher Vmax. Insulin increases GLUT4 transporter density in muscle, adipose, and heart (10-20 fold increase)
- Temperature - Higher temperature increases molecular kinetic energy and rate of diffusion
- Molecular size - Smaller molecules diffuse faster (up to a limit defined by carrier specificity)
- Saturation of carriers - When all carriers are occupied, adding more substrate does not increase the rate (Vmax is reached)
- Competitive inhibition - Structurally similar molecules compete for the same carrier (e.g., galactose and fructose compete with glucose for GLUT transporters)
- Specificity of carrier - Each carrier is specific for one or a few structurally similar molecules
Q.2(b) - Genesis of Resting Membrane Potential (6 Marks)
Definition
Ionic Basis
| Ion | Intracellular | Extracellular | At-rest Permeability |
|---|---|---|---|
| K+ | High (~140 mEq/L) | Low (~4 mEq/L) | HIGH |
| Na+ | Low (~14 mEq/L) | High (~142 mEq/L) | LOW |
| Cl- | Low | High | Moderate |
| Ca2+ | Very low | Higher | Very low |
Mechanism - Step by Step
- K+ dominates the RMP: The cell membrane at rest is far more permeable to K+ and Cl- than to Na+ and Ca2+
- K+ tends to diffuse outward down its concentration gradient, carrying positive charge out - this makes the interior of the cell negative
- Na+ wants to diffuse inward but has low permeability, so it contributes little to RMP
- The RMP therefore lies close to the K+ equilibrium potential (approximately -94 mV, calculated by the Nernst equation)
- The actual RMP is slightly less negative than E_K+ because of the small inward Na+ leak
The Chord Conductance Equation
Role of Na+-K+-ATPase Pump
- Direct electrogenic effect: Pumps 3 Na+ out for every 2 K+ in - creates a small additional negativity
- Indirect (more important) effect: Maintains the K+ concentration gradient across the membrane, which sustains the K+ diffusion potential that drives the RMP toward E_K+
SECTION B (40 Marks)
Q.1 - Gastric Juice: Composition, Functions, HCl Secretion Mechanism, Regulation of Gastric Secretion (2+2+2+4 = 10 Marks)
Composition and Functions of Gastric Juice (2+2 Marks)
| Component | Secreted by | Function |
|---|---|---|
| Hydrochloric acid (HCl) | Parietal (oxyntic) cells | Activates pepsinogen to pepsin; kills microorganisms; provides acid medium for protein digestion; denatures proteins |
| Pepsinogen | Chief (zymogenic) cells | Converted to pepsin by HCl; begins protein digestion |
| Intrinsic factor | Parietal cells | Essential for absorption of vitamin B12 in terminal ileum |
| Gastric lipase | Chief cells | Digests fat (minor role) |
| Mucus | Mucous neck cells, surface mucous cells | Protects gastric mucosa from self-digestion (mucosal barrier) |
| Bicarbonate (HCO3-) | Surface epithelial cells | Buffers HCl at mucosal surface (contributes to mucosal protection) |
| Gastrin | G cells (antrum) | Hormone stimulating further acid secretion |
| Water, electrolytes | All glands | Dissolves and transports secreted materials |
Mechanism of HCl Secretion (2 Marks)
- Inside the parietal cell, CO2 + H2O → H2CO3 (catalyzed by carbonic anhydrase) → H+ + HCO3-
- H+ is actively pumped into the canaliculus (lumen) via H+/K+-ATPase (proton pump) in exchange for K+
- Cl- is secreted into the canaliculus passively alongside H+ (via Cl- channels), forming HCl
- HCO3- exits the basolateral side of the cell in exchange for Cl- (via Cl-/HCO3- exchanger) - this creates the "alkaline tide" in portal blood after eating
- Na+/K+-ATPase on the basolateral membrane maintains intracellular K+ and Na+ gradients
Regulation of Gastric Secretion (4 Marks)
- Triggered by sight, smell, taste, thought of food
- Mediated via the vagus nerve (CN X)
- Vagal stimulation releases acetylcholine (ACh) acting on M3 muscarinic receptors on parietal cells
- Also stimulates G cells to release gastrin
- Result: Acid and pepsinogen secretion begins before food enters stomach
- Triggered when food enters the stomach
- Two mechanisms:
- Distension of stomach wall stimulates stretch receptors → local (enteric) and vagal reflexes → ACh release → stimulates parietal cells
- Chemical stimulation by peptides and amino acids → stimulates G cells to release gastrin → gastrin acts on parietal cells (via CCK-B receptors) to stimulate acid secretion
- Gastrin is the dominant hormone of this phase
- Chyme entering the duodenum initially provides a small stimulatory effect (duodenal gastrin)
- As the duodenum becomes acidic and fills with fat/hypertonic chyme, inhibitory signals dominate:
- Secretin (released by S cells in response to acid in duodenum) - inhibits gastric acid and stimulates pancreatic HCO3-
- Cholecystokinin (CCK) - released by I cells in response to fat/protein - inhibits gastrin
- Gastric inhibitory peptide (GIP) - released by fat and glucose in duodenum
- These form the enterogastric reflex (neural) and hormonal inhibition to slow acid secretion as digestion progresses
- ACh (vagal/local)
- Gastrin
- Histamine (from ECL cells, acts on H2 receptors) - these three act via their own receptors on parietal cells and potentiate each other
Q.2(a) - Oxygen Dissociation Curve (6 Marks)
Definition
Key Features of the Curve
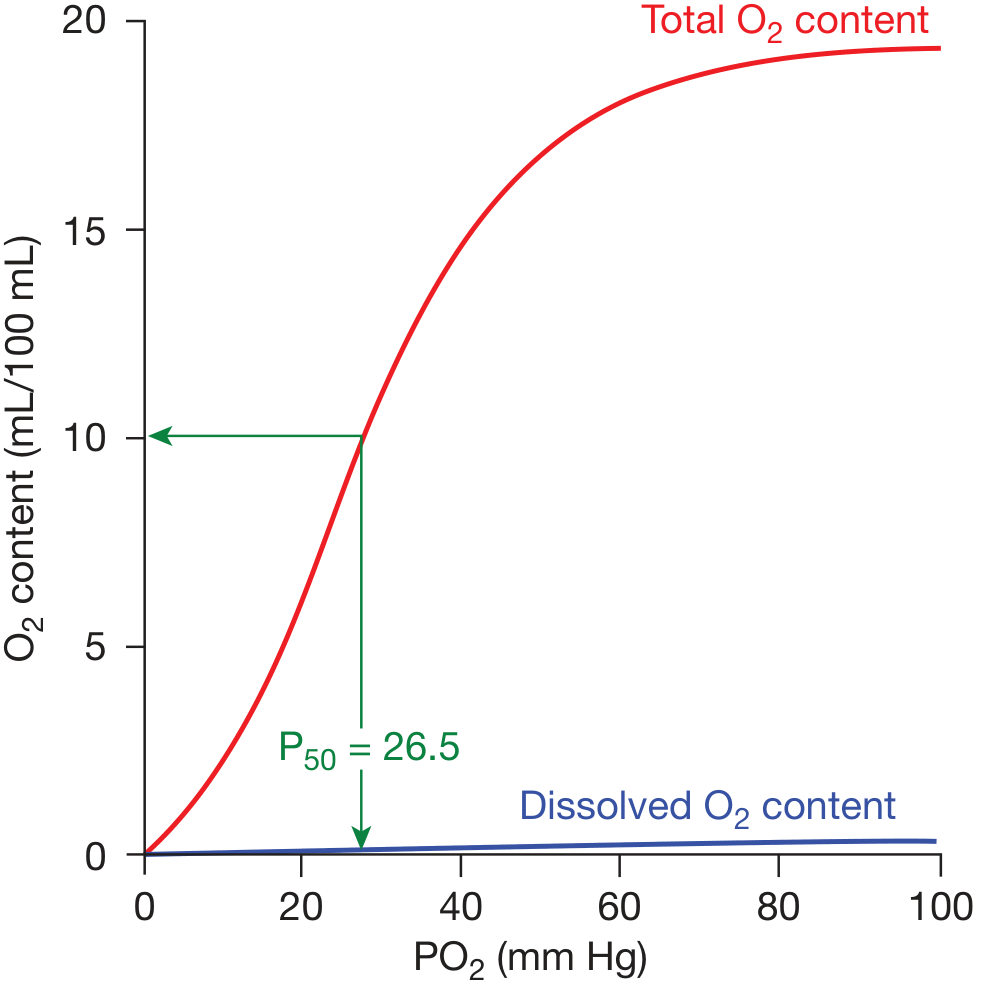
- The curve is sigmoid (S-shaped) - due to cooperative binding (binding of O2 to one heme group increases O2 affinity of remaining heme groups in the same Hb molecule)
- P50 = the PO2 at which 50% of Hb is saturated = 26.5 mmHg (normal)
- At PO2 = 100 mmHg (arterial blood): Hb ~97-98% saturated
- At PO2 = 40 mmHg (mixed venous blood): Hb ~75% saturated
- At rest, only ~25% of delivered O2 is extracted (large reserve)
Physiological Significance of the Sigmoid Shape
- The flat upper portion (PO2 > 60 mmHg): Hb remains nearly fully saturated even with significant drops in PO2 (protective at altitude or in mild lung disease)
- The steep middle portion (PO2 20-60 mmHg): Small drops in PO2 at tissue level cause large release of O2 - efficient delivery to metabolizing tissues
Shifts of the Curve
| Factor | Shift | Effect |
|---|---|---|
| ↑ Temperature | Right (↓ affinity) | More O2 released to active tissues |
| ↑ PCO2 (Bohr effect) | Right | More O2 unloaded at tissues |
| ↓ pH (acidosis) | Right | More O2 unloaded at tissues |
| ↑ 2,3-BPG (DPG) | Right | More O2 released; important in anemia |
| ↓ Temperature, ↓ PCO2, ↑ pH | Left (↑ affinity) | Less O2 released |
| Fetal Hb (HbF) | Left | Better O2 loading from maternal blood |
| CO (carboxyhemoglobin) | Left + ↓ capacity | Dangerous - less O2 delivery |
Q.2(b) - Cheyne-Stokes Breathing (6 Marks)
Definition
- Gradual crescendo increase in depth and rate of breathing
- Followed by gradual decrescendo decrease
- Followed by a period of apnea (cessation of breathing for 10-60 seconds)
- The cycle then repeats
Mechanism
- Disruption of neural pathways that normally inhibit respiration leads to overresponse to CO2
- Elevated CO2 causes hyperventilation → CO2 falls below normal
- The resultant hypocapnia inhibits the respiratory centers → apnea
- During apnea, CO2 rises again → respiratory center is again overstimulated
- This oscillation continues cyclically
- Seen in heart failure where cardiac output is low and circulation time is prolonged
- When hyperventilation lowers lung PCO2, it takes longer than normal for this low-CO2 blood to reach the brainstem
- During this delay, the lungs continue to lower CO2 further
- When the low-CO2 blood finally reaches the brain, it inhibits breathing → apnea
- During apnea, PCO2 in pulmonary blood rises; this high-CO2 blood then reaches the brain → drives hyperventilation again
- The negative feedback loop between lungs and brain is abnormally long, causing oscillation
Clinical Associations
- Congestive heart failure (most common)
- Uremia (renal failure)
- Brain damage/stroke (midbrain lesions)
- High altitude in some normal individuals
- During sleep in some normal elderly individuals
Significance
- Indicates serious underlying cardiorespiratory or neurological disease
- Causes irregular blood oxygenation and CO2 levels
- Can produce hypoxemia during apneic phases
Q.2(c) - Tubuloglomerular Feedback (TGF) Mechanism (6 Marks)
Definition
Anatomical Basis
Mechanism (Step by Step)
-
Detection: When GFR increases, more NaCl is delivered to the distal tubule. The macula densa cells detect elevated NaCl concentration via NKCC2 co-transporters (Na-K-2Cl) in their apical membrane
-
Signal transduction: NaCl uptake by NKCC2 leads to:
- Depolarization and ionic changes in macula densa cells
- ATP release from macula densa cells → stepwise hydrolysis by ecto-ATPases → adenosine
-
Effector response: Adenosine acts on A1 adenosine receptors (A1AR) on afferent arteriolar smooth muscle cells → causes afferent arteriolar vasoconstriction via:
- Inhibitory G-protein (Gi) → phospholipase C activation
- Release of Ca2+ from intracellular stores
- Entry of Ca2+ through L-type Ca2+ channels
- → Vasoconstriction of afferent arteriole
-
Outcome: Afferent arteriolar constriction → reduces glomerular capillary pressure → GFR falls back toward normal
Negative Feedback Summary
Importance
- Maintains GFR and distal NaCl delivery within narrow limits
- Prevents tubular overload
- Furosemide and bumetanide block NKCC2 and abolish TGF
Q.2(d) - Cystometrogram (6 Marks)
Definition
Three Components/Phases of the Normal Cystometrogram
- As fluid is first introduced, there is a slight initial rise in pressure (elastic property of bladder wall)
- As bladder volume increases from 0 to ~300-400 mL, pressure remains relatively LOW and constant (~10-15 cm H2O)
- This represents receptive relaxation of the detrusor muscle (stress relaxation)
- The bladder accommodates increasing volume with minimal pressure rise - this is high compliance
- First sensation of fullness is felt at ~150-200 mL; urgency at ~400 mL
- At a volume of ~300-400 mL, the voiding reflex is triggered
- A sharp, steep rise in pressure occurs as the detrusor contracts (can reach 40-60 cm H2O)
- If micturition occurs, this pressure spike leads to voiding
- If the external sphincter is voluntarily contracted, pressure may briefly rise further
Clinical Significance
- Overactive bladder/detrusor instability: Involuntary pressure rises (uninhibited contractions) during filling phase
- Hypotonic bladder (neurogenic): Very high compliance, no voiding contraction (seen in sacral nerve lesions, tabes dorsalis)
- Low compliance bladder: Pressure rises steeply with small volumes (seen in fibrosis, radiation cystitis)
- Normal first sensation at ~150 mL; normal voiding reflex at ~400-500 mL
Q.2(e) - Ventilation-Perfusion (V/Q) Ratio (6 Marks)
Definition
Normal Values
- Normal alveolar ventilation (V̇A) = ~4 L/min
- Normal pulmonary blood flow (Q̇) = ~5 L/min
- Normal overall V̇A/Q̇ ratio = 0.8 (4/5)
Extremes of V/Q Ratio
- Alveolus is perfused but not ventilated (e.g., collapsed alveolus, mucus plug)
- Alveolar gases equilibrate with venous blood (PO2 = 40 mmHg, PCO2 = 45 mmHg)
- Blood passes through without picking up O2 or losing CO2
- This is called a "true shunt" - causes hypoxemia not correctable by supplemental O2
- Alveolus is ventilated but not perfused (e.g., pulmonary embolism)
- Air reaches the alveolus but cannot exchange gas with blood
- This is "alveolar dead space" - wasted ventilation
- Alveolar gas has high PO2 (150 mmHg) and very low PCO2 (approaching inspired air values)
- Alveolar PO2 ≈ 100 mmHg, PCO2 ≈ 40 mmHg
- Efficient gas exchange
Regional V/Q Distribution in the Lung (Upright position)
- Apex: High V/Q (>1) - ventilation exceeds perfusion; approaches alveolar dead space
- Base: Low V/Q (<1) - perfusion exceeds ventilation; approaches shunt
- Both ventilation and perfusion increase from apex to base, but perfusion increases more steeply (due to gravity), so V/Q is lowest at the base
Clinical Significance
- V/Q mismatch is the most common cause of hypoxemia in lung disease (COPD, asthma, pneumonia, pulmonary embolism)
- Unlike diffusion impairment, moderate V/Q mismatch can be partly corrected with supplemental O2 (by increasing alveolar PO2 in low V/Q units)
- Measurement of V/Q ratio using radionuclide scanning (V/Q scan) is used to diagnose pulmonary embolism
Sources: Costanzo Physiology 7th Ed, Guyton & Hall Medical Physiology, Ganong's Review of Medical Physiology 26th Ed, Brenner & Rector's The Kidney, Fishman's Pulmonary Diseases and Disorders

Solve this
erythropoiesis stages red blood cell development bone marrow
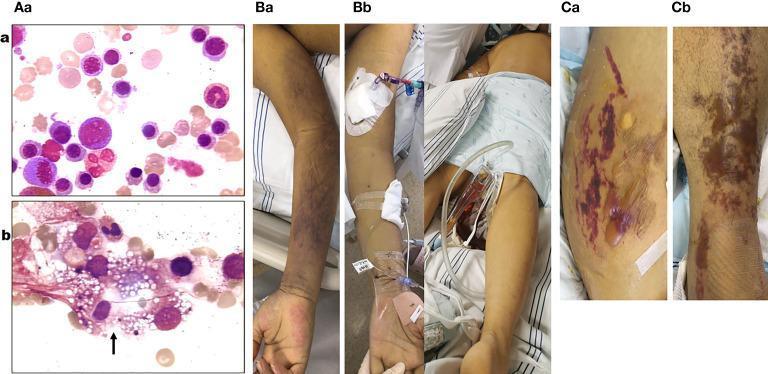
This composite medical image includes bone marrow smears and clinical photographs documenting the progression of a systemic illness, likely Parvovirus B19 infection. Diagnostic Images (Aa, Ab): Bone marrow smears (400x magnification) demonstrate a transition from hyperplastic marrow with active erythropoiesis (Aa) to a significant decrease in erythroblast density and maturation inhibition (Ab). Image Ab prominently displays a phagocytic cell containing numerous vacuoles and cellular debris (black arrow), indicative of hemophagocytic syndrome. Clinical Photographs (Ba-Cb): Serial photographs show evolving cutaneous manifestations. Initial findings (Ba, Bb) demonstrate blue-purple ecchymosis and diffuse mottling on the limbs and trunk. Later stages (Ca, Cb) reveal progressive purple-red ecchymotic lesions associated with the development of large, strained bullae filled with serous fluid on an erythematous base. The images illustrate the clinical and pathological manifestations of acute aplastic crisis and hemophagocytic lymphohistiocytosis (HLH) within the context of hematologic and infectious disease.
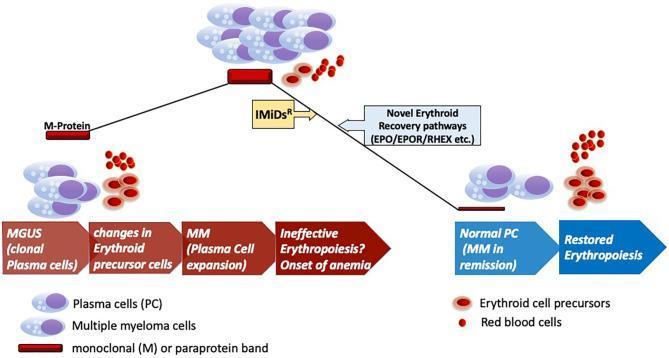
A pathophysiology diagram illustrating the disease progression of monoclonal gammopathy of undetermined significance (MGUS) to multiple myeloma (MM) and the subsequent impact on erythropoiesis. The visual follows a peak-like trajectory: the left side shows the progression from MGUS (clonal plasma cells) to MM (plasma cell expansion), characterized by a thickening M-protein band and increasingly ineffective erythropoiesis leading to anemia. At the peak, malignant multiple myeloma cells dominate the bone marrow environment alongside sparse red blood cells and erythroid precursors. The downward right slope depicts therapeutic intervention using immunomodulatory drugs (IMiDsR) and the engagement of novel erythroid recovery pathways involving EPO, EPOR, and RHEX. This phase represents MM in remission (Normal PC) and the clinical restoration of erythropoiesis, visualized by the return of mature red blood cells and normal erythroid precursor levels. Key components include plasma cells, monoclonal (M) paraprotein bands, and the sequential maturation stages of the erythroid lineage.
baroreceptor reflex blood pressure regulation carotid sinus
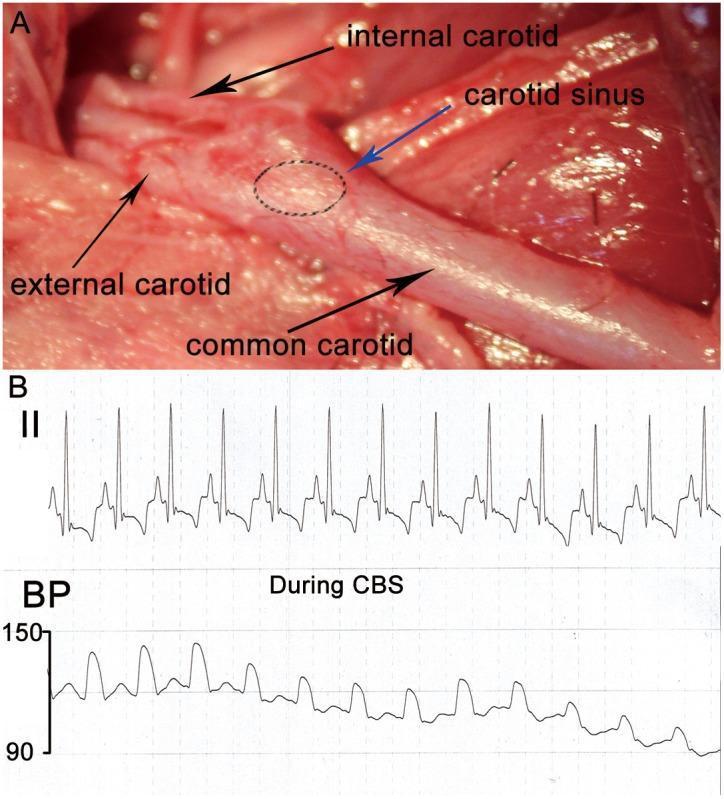
This composite educational image illustrates the anatomy and physiological effects of carotid baroreceptor stimulation (CBS). Panel A is a clinical photograph of a surgical dissection showing the carotid bifurcation. Black arrows identify the common carotid artery, external carotid artery, and internal carotid artery. A blue arrow and dashed oval highlight the carotid sinus, a baroreceptor-rich region located at the bulbous origin of the internal carotid artery. Panel B provides a physiological tracing during CBS. The top trace is a Lead II electrocardiogram (ECG) showing rhythmic cardiac cycles. The bottom trace represents continuous arterial blood pressure (BP) monitoring on a scale from 90 to 150 mmHg. The recording demonstrates a clear depressor response during CBS, characterized by a progressive decline in mean blood pressure and a reduction in heart rate. This image is designed for medical studies in cardiology and autonomic physiology, illustrating the baroreflex mechanism used to modulate cardiovascular parameters through therapeutic electrical stimulation.
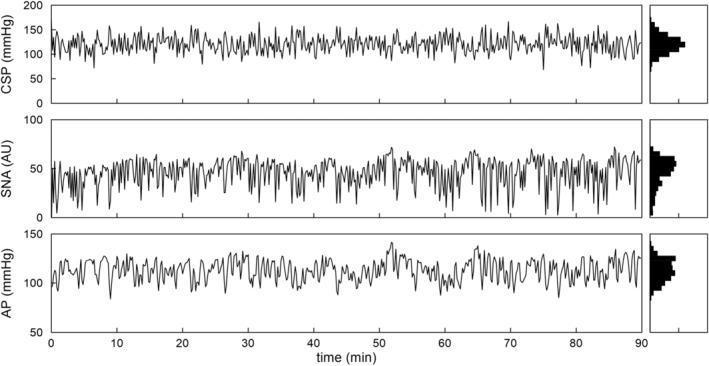
This image presents three aligned time-series plots and corresponding histograms illustrating the dynamics of the arterial baroreflex system. The vertical panels track Carotid Sinus Pressure (CSP) in mmHg, Sympathetic Nerve Activity (SNA) in Arbitrary Units (AU), and Arterial Pressure (AP) in mmHg over a 90-minute recording duration. The CSP serves as the input signal, perturbed using Gaussian White Noise (GWN) with a mean of 120 mmHg. Visually, SNA and AP demonstrate reciprocal fluctuations in response to CSP changes, characteristic of negative feedback baroreflex control. To the right of each time series, a frequency distribution histogram is provided. The CSP histogram exhibits a symmetric, Gaussian distribution centered at 120 mmHg. In contrast, the SNA and AP histograms show non-Gaussian, skewed distributions, indicating nonlinearities in the neural and total arcs of the baroreflex regulatory system. This data is critical for physiological modeling of autonomic cardiovascular control and understanding dynamic gain and phase relationships between baroreceptor stimulation and sympathetic effector response.
juxtaglomerular apparatus macula densa afferent arteriole renin diagram
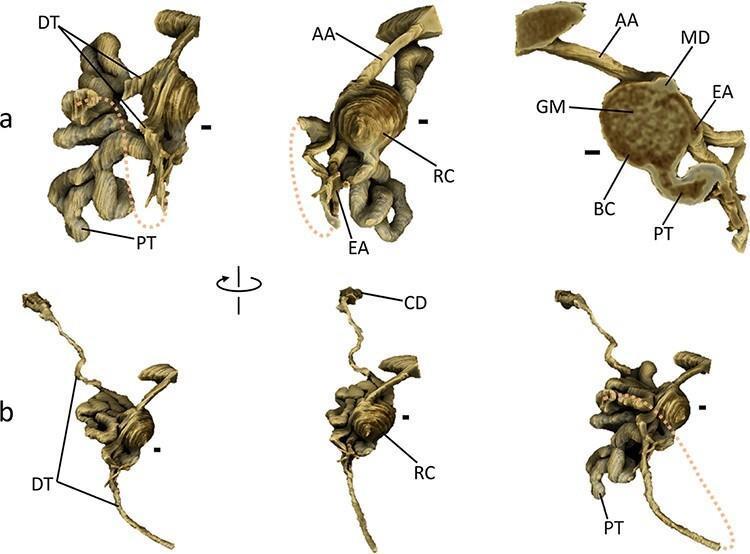
Anatomical diagram featuring high-resolution 3D renderings of a single mouse nephron, highlighting renal microstructure and spatial arrangement. Panel (a) provides detailed views of the renal corpuscle (RC), demonstrating the spherical Bowman's capsule (BC) and internal glomerulus (GM). It clearly illustrates the vascular pole with the afferent arteriole (AA), efferent arteriole (EA), and the macula densa (MD) of the distal tubule (DT) forming a v-shaped contact point. The tubular pole shows the exit of the highly convoluted proximal tubule (PT). Panel (b) illustrates the longitudinal progression from the renal corpuscle through the PT and DT to the collecting duct (CD). The rendering distinguishes between the intensely convoluted segments near the corpuscle and the straighter distal segments of the tubules. Key educational concepts include the juxtaglomerular apparatus anatomy, the morphology of glomerular filtration components, and the physical relationship between various segments of the nephron and their associated vasculature, essential for understanding renal physiology and pathology.
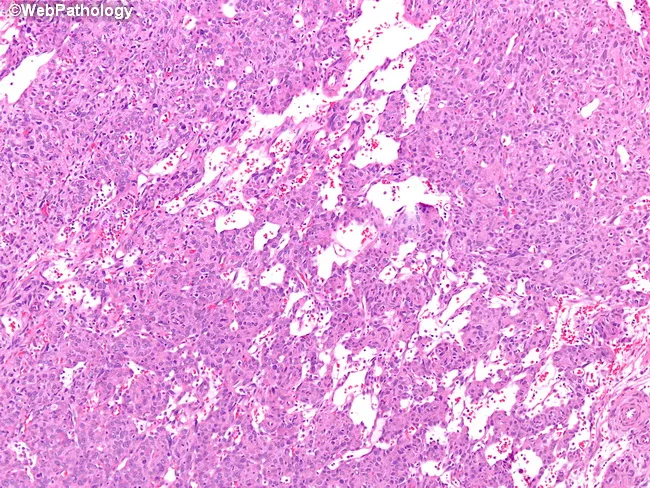
This is a high-vascular renal tumor histology image captured from a hematoxylin and eosin-stained section of Juxtaglomerular cell tumor (JGCT) of the kidney. The slice demonstrates densely packed, monomorphic tumor cells with uniform round to oval nuclei and eosinophilic cytoplasm arranged in sheets and cords. Interspersed small venules and muscular arterioles create a conspicuous vascular network; branching, stag-horn–type vessels resembling hemangiopericytoma are a salient feature. The tumor arises from juxtaglomerular cells of the afferent arteriole in the juxtaglomerular apparatus, a specialized smooth muscle lineage that normally regulates blood pressure via renin release. The neoplasm is typically well circumscribed and highly vascular, with scant cytoplasm and minimal pleomorphism, which helps distinguish it from renal cell carcinoma and other hypervascular renal lesions. Clinically, JGCT often presents with secondary hypertension due to renin secretion and is considered benign or indolent; surgical excision or nephron-sparing approaches are curative in many cases. Immunohistochemical or molecular testing may show renin expression in tumor cells, supporting diagnosis. For education and research, this image demonstrates characteristic vascular patterns, including stag-horn vasculature and perivascular monotony, enabling recognition of renin-producing renal neoplasms on histology slides. This image is educational for pathologists, clinicians, and trainees, and aids differential diagnosis and management.
respiratory center medulla brainstem nervous regulation breathing
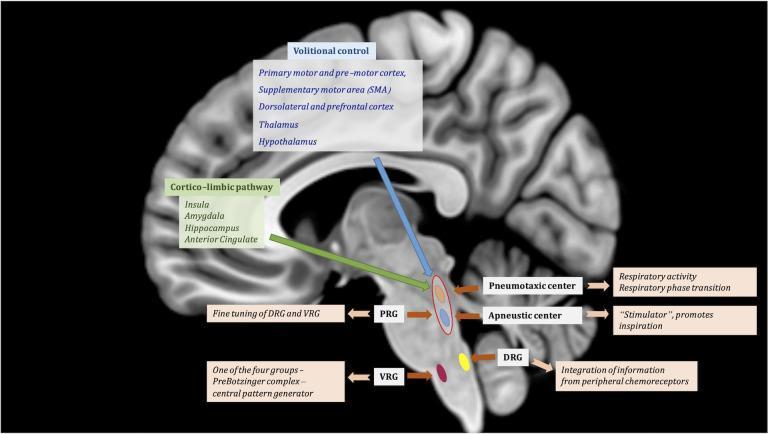
This medical illustration features a T1-weighted sagittal MRI of the human brain overlaid with a diagram of the central regulation of respiratory function. The graphic outlines two primary suprapontine pathways: the 'Volitional control' pathway (originating from the motor cortex, SMA, and thalamus/hypothalamus) and the 'Cortico-limbic pathway' (originating from the insula, amygdala, and hippocampus), both descending toward the brainstem. Within the pons, the Pontine Respiratory Group (PRG) is highlighted, comprising the Pneumotaxic center (responsible for respiratory phase transition) and the Apneustic center (a stimulator promoting inspiration). These centers exert fine-tuning over the medullary respiratory groups. In the medulla, the illustration identifies the Dorsal Respiratory Group (DRG), which integrates peripheral chemoreceptor information, and the Ventral Respiratory Group (VRG), specifically noting the PreBötzinger complex as the central pattern generator. The diagram effectively illustrates the hierarchical neuroanatomical structure of breathing regulation, from cortical modulation to autonomic brainstem control.
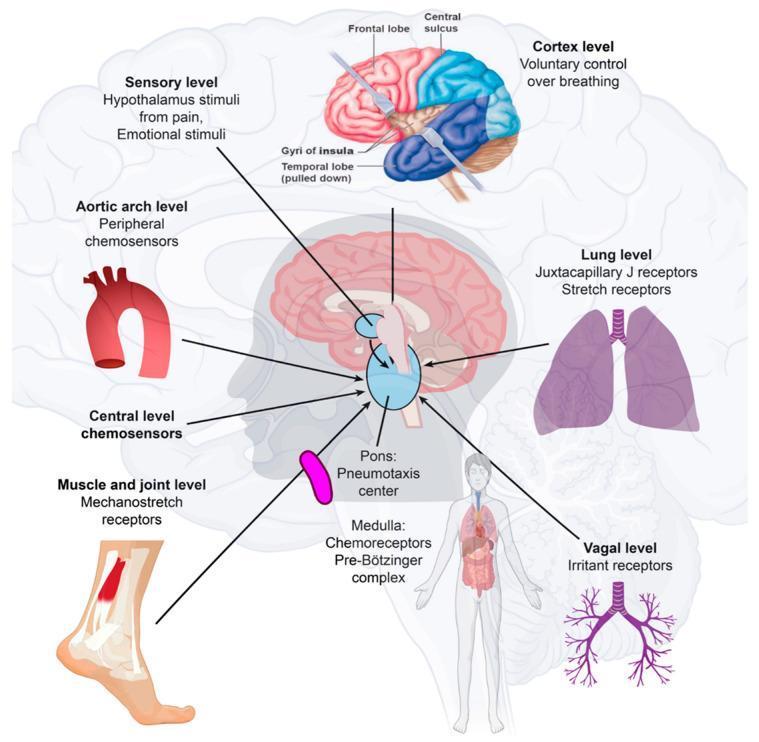
This medical illustration details the neuroanatomical and physiological pathways regulating human respiration. The central focus is a sagittal view of the brainstem, highlighting the Pons (Pneumotaxic center) and Medulla Oblongata (Chemoreceptors and Pre-Bötzinger complex) as the primary integration hubs for breathing rhythm. The diagram maps multiple afferent inputs to these centers: the Cortex level (frontal lobe) for voluntary control; the Sensory level (hypothalamus) processing pain and emotional stimuli; and central chemosensors. Peripheral inputs are illustrated at several anatomical levels: the Aortic arch (peripheral chemosensors), Lung level (Juxtacapillary J receptors and stretch receptors), Muscle/joint level (mechanostretch receptors), and Vagal level (irritant receptors). An anatomical overlay shows the cerebral cortex with labels for the frontal lobe, central sulcus, and gyri of the insula. The illustration summarizes how multifaceted physiological parameters, including blood pH, CO2, O2, lung volume, and physical movement, are processed by the autonomic nervous system to control respiratory rate and depth.
erythropoiesis stages proerythroblast normoblast reticulocyte diagram
A pathophysiology diagram illustrating the disease progression of monoclonal gammopathy of undetermined significance (MGUS) to multiple myeloma (MM) and the subsequent impact on erythropoiesis. The visual follows a peak-like trajectory: the left side shows the progression from MGUS (clonal plasma cells) to MM (plasma cell expansion), characterized by a thickening M-protein band and increasingly ineffective erythropoiesis leading to anemia. At the peak, malignant multiple myeloma cells dominate the bone marrow environment alongside sparse red blood cells and erythroid precursors. The downward right slope depicts therapeutic intervention using immunomodulatory drugs (IMiDsR) and the engagement of novel erythroid recovery pathways involving EPO, EPOR, and RHEX. This phase represents MM in remission (Normal PC) and the clinical restoration of erythropoiesis, visualized by the return of mature red blood cells and normal erythroid precursor levels. Key components include plasma cells, monoclonal (M) paraprotein bands, and the sequential maturation stages of the erythroid lineage.
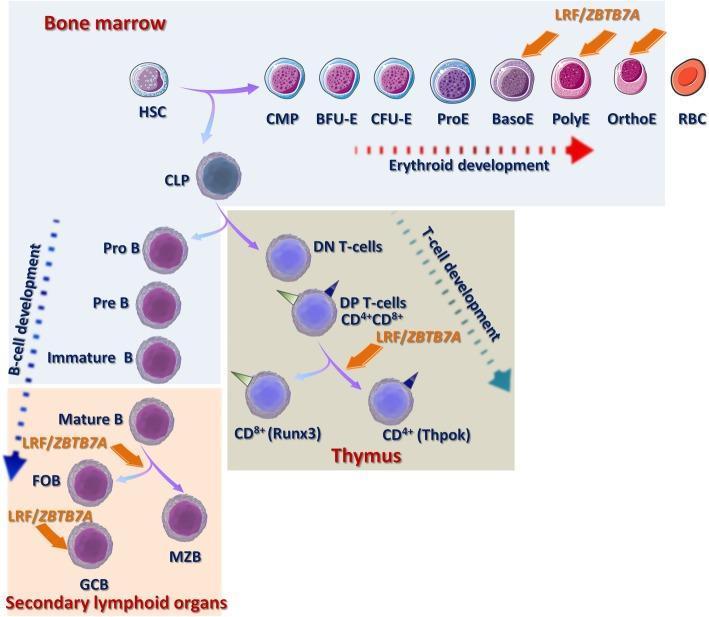
A pathophysiology diagram illustrating the role of the transcription factor LRF/ZBTB7A in human hematopoiesis, specifically in erythroid and lymphoid development. The diagram shows the differentiation of Hematopoietic Stem Cells (HSCs) into three main lineages. 1) Erythroid Development: Occurring in the bone marrow, the pathway progresses from CMP to BFU-E, CFU-E, and through erythroid precursors (ProE, BasoE, PolyE, OrthoE) to mature RBCs. LRF/ZBTB7A is shown regulating the terminal stages of erythropoiesis. 2) B-cell Development: Traces maturation from CLP through Pro-B, Pre-B, and Immature B cells in the bone marrow, continuing to Mature B cells in secondary lymphoid organs, where LRF/ZBTB7A facilitates differentiation into Follicular B cells (FOB) and Germinal Center B cells (GCB). 3) T-cell Development: Located in the thymus, it shows transitions from DN T-cells to DP T-cells (CD4+/CD8+). LRF/ZBTB7A is associated with the lineage choice between CD8+ (Runx3) and CD4+ (Thpok) T-cells. The visual emphasizes nuclear condensation and cytoplasm changes during erythroid maturation.
SENDUP EXAMINATION - AUG 2025
Physiology Paper I
SECTION - A
Q.1 - Erythropoiesis (1 + 2 + 4 + 3 = 10 Marks)
Definition (1 Mark)
Sites of Erythropoiesis (2 Marks)
| Period | Site |
|---|---|
| First 2 weeks - 2 months | Yolk sac (primitive erythropoiesis) |
| 2-7 months | Liver (primary site), also spleen and lymph nodes |
| 5 months onwards | Bone marrow begins to take over |
| After birth | Bone marrow is the exclusive site |
- Infants/Children: All bones have active red marrow (sternum, ribs, vertebrae, long bones)
- Adults: Active red marrow limited to flat bones - sternum, ribs, vertebrae, skull, pelvis, and proximal ends of femur and humerus
- In pathological conditions (severe hemolytic anemia, myelofibrosis): liver and spleen can resume erythropoiesis - called extramedullary hematopoiesis
Stages of Erythropoiesis with Characteristic Features (4 Marks)
Pluripotent Stem Cell (Hemocytoblast)
          ↓
    Committed Progenitor (BFU-E → CFU-E)
          ↓
    Proerythroblast (Rubriblast)
          ↓
    Early Normoblast (Basophilic erythroblast)
          ↓
    Intermediate Normoblast (Polychromatic erythroblast)
          ↓
    Late Normoblast (Orthochromatic erythroblast)
          ↓
    Reticulocyte
          ↓
    Mature Erythrocyte (RBC)
| Stage | Size | Nucleus | Cytoplasm | Features |
|---|---|---|---|---|
| Proerythroblast | Large (20 µm) | Large, round, prominent nucleoli (1-2) | Deeply basophilic (abundant ribosomes) | Largest nucleated stage; begins Hb synthesis |
| Early Normoblast (Basophilic) | ~16 µm | Large, chromatin begins to condense; no nucleoli | Intensely basophilic | Active ribosome production; Hb synthesis increasing |
| Intermediate Normoblast (Polychromatic) | ~12 µm | Condensing chromatin, "clock-face" pattern | Mixed blue-pink (polychromatic) - ribosomes + Hb | Key stage: Hb accumulating rapidly |
| Late Normoblast (Orthochromatic) | ~10 µm | Very condensed, small, pyknotic | Pink (Hb dominant) | Nucleus is extruded at this stage |
| Reticulocyte | ~9 µm | No nucleus | Slightly bluish-pink; reticular RNA network (seen with brilliant cresyl blue) | Spends ~1-2 days in marrow + 1 day in blood maturing |
| Mature RBC | 7-8 µm | No nucleus | Pink, biconcave disc | Life span 120 days |
- Cell size decreases
- Nucleus becomes smaller and denser → finally extruded
- Cytoplasm changes from basophilic → polychromatic → acidophilic (pink)
- Hemoglobin content increases progressively
- RNA decreases progressively
Factors Regulating Erythropoiesis (3 Marks)
- Glycoprotein hormone produced mainly by peritubular interstitial cells of the renal cortex (90%) and liver (10%)
- Stimulated by hypoxia (e.g., high altitude, anemia, chronic lung disease)
- Acts on CFU-E progenitors → promotes proliferation, differentiation, and survival
- Increases Hb synthesis and accelerates reticulocyte release
- Iron - essential for heme synthesis; deficiency causes iron deficiency anemia
- Vitamin B12 (Cobalamin) - required for DNA synthesis; deficiency → megaloblastic anemia
- Folic acid - required for thymidine synthesis for DNA; deficiency → megaloblastic anemia
- Vitamin C - helps iron absorption and protects against oxidative damage
- Protein - globin chain synthesis requires amino acids
- Copper - needed for iron incorporation into heme
- Androgens (testosterone) - stimulate EPO production → explains higher Hb in males
- Thyroid hormones - increase basal metabolic rate and O2 demand → stimulate erythropoiesis
- Growth hormone / IGF-1 - promote early erythroid progenitor development
- Cortisol - mild stimulatory effect
- Transforming Growth Factor-β (TGF-β) - inhibits erythroid progenitor proliferation
- Estrogens - mild inhibitory effect (lower Hb in females)
- Hepcidin - antimicrobial peptide; blocks iron release from stores → inhibits erythropoiesis
- Stromal cells, growth factors, and the extracellular matrix provide the erythroid niche essential for normal erythropoiesis
Q.2 Short Notes (6 Marks Each)
Q.2(a) - Baroceptors in Blood Pressure Regulation
- Carotid sinus baroreceptors: Located in the wall of the internal carotid artery just above the carotid bifurcation; afferent signals travel via the Hering's nerve (branch of glossopharyngeal nerve - CN IX)
- Aortic arch baroreceptors: Located in the wall of the aortic arch; afferent signals travel via the aortic depressor nerve (branch of vagus nerve - CN X)
- Arterial wall stretches → baroreceptors are activated → increased firing rate
- Afferent impulses travel to the nucleus tractus solitarius (NTS) in the medulla
- NTS activates the Cardio-inhibitory center (CIC) and inhibits the vasomotor center
- Increased parasympathetic outflow (vagus) → decreased HR (bradycardia)
- Decreased sympathetic outflow → vasodilation (decreased peripheral resistance)
- Result: BP returns to normal (negative feedback)
- Reduced stretch → decreased baroreceptor firing
- Vasomotor center is activated; CIC is inhibited
- Increased sympathetic outflow → tachycardia + vasoconstriction
- Result: BP rises back to normal
- Respond to both mean pressure and pulse pressure
- Most sensitive in the range of 60-180 mmHg
- Show adaptation with sustained pressure - less effective in chronic hypertension (reset to a higher level)
- Respond more to rapidly changing pressures than sustained ones
- Baroreceptors are the most important short-term regulators of blood pressure
- They buffer acute changes (e.g., on standing up - orthostatic hypotension)
- They do NOT provide long-term BP regulation (kidneys do that via RAAS and pressure natriuresis)
Q.2(b) - Cardiac Output Measurement - Fick's Principle
O2 consumed by body = Cardiac output × (O2 content of arterial blood - O2 content of venous blood)
- V̇O2 = O2 consumption of the whole body (mL O2/min) - measured by spirometry
- [O2]arterial = O2 content of pulmonary venous / systemic arterial blood (mL O2/mL blood) - sampled from peripheral artery
- [O2]venous = O2 content of mixed venous / pulmonary arterial blood - sampled by right heart catheterization
- O2 consumption = 250 mL O2/min
- Arterial O2 content = 0.20 mL O2/mL blood
- Mixed venous O2 content = 0.15 mL O2/mL blood
- Steady state condition (O2 consumption is constant)
- No intracardiac shunts (pulmonary and systemic cardiac outputs are equal)
- Gold standard for CO measurement
- Can be applied to measure blood flow to individual organs (e.g., renal blood flow using renal O2 or PAH extraction)
- Requires cardiac catheterization (invasive)
- Errors in sampling mixed venous blood if not truly mixed
- Not ideal in rapidly changing hemodynamic states
Q.2(c) - Facilitated Diffusion and Factors Affecting It
- Substance binds to specific receptor on carrier protein
- Carrier undergoes conformational change (shape change)
- Pore opens to opposite side of membrane
- Substance released due to weak binding
- Carrier returns to original state
- Concentration gradient - Greater gradient → faster rate (up to Vmax)
- Number/density of carrier proteins - More carriers → higher Vmax (e.g., insulin upregulates GLUT4 density 10-20x in muscle/adipose)
- Carrier specificity - Each carrier accepts only structurally similar molecules
- Competitive inhibition - Structurally similar molecules compete for the same carrier binding site
- Saturation of carriers - Once all carriers occupied, further increase in substrate concentration does NOT increase rate
- Temperature - Higher temperature → increased molecular kinetic energy → faster diffusion
- Membrane fluidity - Affects carrier protein mobility within the membrane
Q.2(d) - Homeostasis
- Temperature (~37°C)
- Blood pH (7.35-7.45)
- Blood glucose (70-100 mg/dL fasting)
- PO2, PCO2
- Osmolality (~285-295 mOsm/kg)
- Blood pressure (~120/80 mmHg)
- Electrolyte concentrations (Na+, K+, Ca2+)
- The response opposes (reverses) the initial disturbance
- Maintains stability around a set point
- Example: When body temperature rises → sweating + vasodilation → heat loss → temperature returns to 37°C
- Example: When blood glucose rises → insulin secreted → glucose uptake → glucose normalizes
- Components: Receptor (sensor) → Afferent pathway → Control center (integrator) → Efferent pathway → Effector
- The response amplifies the initial disturbance
- Used when a process must be driven to completion
- Examples: LH surge causing ovulation; blood clotting cascade; parturition (oxytocin release); nerve action potential (Na+ influx)
- Anticipatory mechanism; responds to a stimulus before the disturbance actually occurs
- Example: Increased salivation and gastric secretion in the cephalic phase before food reaches the stomach
- Disruption = disease state
- All organ systems work together to maintain homeostasis
- Claude Bernard (1857) - first described the concept of milieu interieur (internal environment)
Q.2(e) - Wallerian Degeneration
- Immediately (0-24 hrs): Disruption of axoplasmic transport; calcium and sodium influx through disrupted axonal membrane
- Day 1-3: Axon begins to swell and fragment; Schmidt-Lanterman clefts in myelin separate
- Day 3 onwards: Schwann cells retract from nodes of Ranvier; Schwann cells and macrophages are recruited and begin to phagocytose myelin and axon debris
- ~1 week: The entire distal axonal process degenerates completely
- 2-3 weeks: The endoneurial tube (Schwann cell tubes) remains - forms Bands of Büngner - a scaffold for future regeneration
- Limited retrograde axon breakdown up to the first node of Ranvier
- Cell body undergoes chromatolysis:
- Dissolution and dispersal of Nissl substance (rough ER)
- Eccentric displacement of nucleus toward cell membrane
- Cell body swells
- Increased protein synthesis (switch from axon maintenance → regeneration mode)
- Axon sprouts grow from the proximal stump at ~1-3 mm/day
- Schwann cells in Bands of Büngner guide the growing axon to its target
- Eventually remyelination occurs (new myelin is thinner with more, shorter internodes)
- Collateral sprouting from intact neighboring axons can also reinnervate denervated muscle
- Explains why peripheral nerve injuries can recover (unlike CNS injuries)
- EMG shows fibrillation potentials after Wallerian degeneration of motor nerves
- Rate of recovery = ~1 inch (2.5 cm) per month
- Furosemide and bumetanide (and other factors) may modulate recovery
SECTION - B
Q.1 - Clinical Case: 40-year-old man with epigastric pain
a) Most Likely Diagnosis (1 Mark)
- Epigastric pain that worsens on empty stomach and improves after eating is classic for duodenal ulcer (food buffers acid)
- NSAID use (for chronic back pain) damages the gastric mucosal barrier → a major risk factor for both gastric and duodenal ulcers
- Bloating and nausea are common dyspeptic symptoms
b) Mechanism of HCl Secretion (3 Marks)
-
Inside the parietal cell:
- CO2 + H2O → H2CO3 (catalyzed by carbonic anhydrase)
- H2CO3 → H+ + HCO3-
-
Apical (luminal) side:
- H+/K+-ATPase (proton pump) actively pumps H+ into the canalicular lumen in exchange for K+
- Cl- is simultaneously secreted into the lumen through Cl- channels
- H+ + Cl- → HCl in the lumen
-
Basolateral side:
- HCO3- (generated from Step 1) exits the cell in exchange for Cl- via the Cl-/HCO3- antiporter
- This enriches the blood with HCO3- → causes the "alkaline tide" in portal blood postprandially
- Na+/K+-ATPase maintains intracellular ion gradients
-
Stimulants of the proton pump activate parietal cells via:
- Acetylcholine (ACh) via M3 receptors → IP3/Ca2+ pathway
- Gastrin via CCK-B receptors → IP3/Ca2+ pathway
- Histamine (from ECL cells) via H2 receptors → cAMP/PKA pathway
- All three act synergistically - blocking any one (e.g., H2 blocker, PPI) reduces acid output
c) Protective Mechanisms of Gastric Mucosa (2 Marks)
- Surface mucous cells secrete a 2-3 mm thick gel of mucus (mucin glycoproteins)
- Subepithelial cells secrete HCO3- which is trapped in the mucus layer
- Creates a pH gradient - pH 7 at the cell surface vs pH 1-2 in the lumen
- PGE2 and PGI2 (prostaglandins) stimulate both mucus and HCO3- secretion - this is why NSAIDs (which inhibit COX → reduce prostaglandins) damage the mucosa
- The gastric epithelium has a very rapid turnover (~3-5 days)
- Rapid regeneration replaces damaged cells before ulceration can occur
- EGF (epidermal growth factor) stimulates this renewal
- Epithelial cells are connected by tight junctions that prevent back-diffusion of H+ from lumen into mucosa
- Rich submucosal blood flow delivers O2, nutrients, and HCO3- to maintain epithelial integrity
- Helps clear any acid that penetrates the mucosa
- "Cytoprotective" molecules that:
- Stimulate mucus and bicarbonate secretion
- Maintain mucosal blood flow
- Enhance epithelial proliferation
- Inhibit acid secretion
d) Physiological Basis of Treatment of Peptic Ulcer Disease (4 Marks)
- Basis: Irreversibly inhibit the H+/K+-ATPase (proton pump) of parietal cells
- Most potent acid suppressants; reduce gastric pH to >4 for >18 hrs/day
- Promote ulcer healing by eliminating the acid environment
- First-line treatment
- Basis: Competitively block H2 receptors on parietal cells → reduce histamine-stimulated acid secretion
- Less potent than PPIs; effective for healing duodenal ulcers and prophylaxis
- Basis: H. pylori colonizes the gastric antrum, produces urease → NH3 + HCO3- → damages mucosa, disrupts mucosal defense
- H. pylori stimulates gastrin secretion and increases acid production
- Triple therapy: PPI + Amoxicillin + Clarithromycin for 14 days
- Eradication cures ~90% of duodenal ulcers and prevents recurrence
- Basis: Chemically neutralize HCl in the stomach (Al(OH)3 + HCl → AlCl3 + H2O)
- Provide immediate symptom relief; do not promote healing on their own
- Also stimulate mucosal prostaglandin synthesis
- Basis: Synthetic prostaglandin that:
- Inhibits acid secretion (via Gi-coupled inhibition of adenylyl cyclase)
- Stimulates mucus and HCO3- secretion
- Maintains mucosal blood flow
- Used specifically for NSAID-induced ulcers (restores prostaglandins inhibited by NSAIDs)
- Basis: Polymerizes in acidic environment → forms a protective coating over the ulcer base, binding to exposed proteins
- Stimulates prostaglandin and mucus production
- Physical barrier against acid and pepsin
- NSAIDs inhibit COX-1/COX-2 → reduce prostaglandins → impair mucosal defense
- Stopping NSAIDs (or switching to selective COX-2 inhibitors + PPI) is mandatory for NSAID-induced ulcers
Q.2 Short Notes (6 Marks Each)
Q.2(a) - Oxygen-Hemoglobin Dissociation Curve
- P50 = 26.5 mmHg (PO2 at 50% Hb saturation)
- Arterial blood (PO2 = 100 mmHg): ~97% saturation
- Mixed venous blood (PO2 = 40 mmHg): ~75% saturation
- At rest, only ~25% of delivered O2 is extracted
- Flat upper portion (>60 mmHg): Hb stays nearly saturated despite significant PO2 fall - protects in lung disease/altitude
- Steep middle portion (20-60 mmHg): Large O2 release with small PO2 drop at tissues - efficient delivery
| Right Shift (↓ O2 affinity - more O2 to tissues) | Left Shift (↑ O2 affinity - less O2 release) |
|---|---|
| ↑ Temperature | ↓ Temperature |
| ↑ PCO2 (Bohr effect) | ↓ PCO2 |
| ↓ pH (acidosis) | ↑ pH (alkalosis) |
| ↑ 2,3-BPG | ↓ 2,3-BPG |
| ↑ CO2 in exercising muscles | Fetal Hb (HbF) - physiological |
| Sickle cell Hb (HbS) | Carbon monoxide (COHb) - pathological |
Q.2(b) - Nervous Regulation of Respiration
- Primarily active during inspiration
- Receives afferents from peripheral chemoreceptors (via CN IX and X) and stretch receptors
- Drives basic inspiratory rhythm
- Sends impulses to phrenic nerve (diaphragm) and external intercostal muscles
- Contains both inspiratory and expiratory neurons
- Mainly active during forced/increased breathing
- Contains the pre-Bötzinger complex - considered the primary rhythm generator
- Drives accessory inspiratory and expiratory muscles
- The Bötzinger complex contains expiratory neurons that inhibit inspiration
- Sends inhibitory signals to the DRG → terminates inspiration
- Controls the duration and depth of inspiration
- Damage → prolonged inspiratory gasps (apneusis)
- Stimulates the DRG to sustain inspiration
- Normally inhibited by the pneumotaxic center
- If pneumotaxic center is destroyed → apneustic breathing (prolonged gasping inspiration with short expiratory pauses)
- Cerebral cortex: Voluntary control of breathing (speaking, breath-holding, voluntary hyperventilation)
- Hypothalamus: Modulates breathing with temperature and emotional states
- Limbic system: Breathing changes with fear, anxiety
| Receptor | Location | Stimulus | Effect |
|---|---|---|---|
| Central chemoreceptors | Ventral medulla | ↑ PCO2/↓ pH in CSF | Stimulate ventilation (most important) |
| Peripheral chemoreceptors | Carotid and aortic bodies | ↑ PCO2, ↓ PO2, ↓ pH | Stimulate ventilation |
| Hering-Breuer stretch receptors | Bronchial smooth muscle | Lung inflation | Inhibit inspiration (limit over-inflation) via vagus |
| Irritant receptors | Airway epithelium | Dust, chemicals | Bronchoconstriction, cough |
| J receptors (juxtacapillary) | Lung interstitium | Congestion, edema | Rapid shallow breathing, dyspnea |
| Muscle/joint receptors | Exercising muscles | Movement | Stimulate ventilation during exercise |
Q.2(c) - Factors Affecting Glomerular Filtration Rate (GFR)
- Pcap = glomerular capillary hydrostatic pressure (~60 mmHg)
- Pbs = Bowman's space hydrostatic pressure (~18 mmHg)
- πcap = glomerular capillary oncotic pressure (~32 mmHg)
- πbs = Bowman's space oncotic pressure (~0 mmHg)
- Net filtration pressure = 60 - 18 - 32 = ~10 mmHg
- Normal GFR = ~120 mL/min/1.73 m²
-
↑ Glomerular capillary pressure (Pcap):
- ↑ Afferent arteriolar dilation (prostaglandins, bradykinin, ANP)
- ↑ Efferent arteriolar constriction (angiotensin II - maintains GFR when renal perfusion falls)
- ↑ Systemic blood pressure (within autoregulatory range)
-
↓ Plasma oncotic pressure (πcap):
- Hypoproteinemia (e.g., liver disease, nephrotic syndrome before adaptive changes)
- Leads to ↑ filtration fraction
-
↓ Bowman's capsule pressure:
- Ureteral patency (obstruction raises Pbs and decreases GFR)
-
↑ Kf (filtration coefficient):
- Increased glomerular surface area or permeability
- Mesangial cell relaxation (ANP increases Kf)
-
↓ Renal perfusion pressure:
- Hypotension, shock, heart failure, dehydration
- Below the autoregulatory range (<80 mmHg)
-
↑ Afferent arteriolar resistance:
- Sympathetic stimulation, catecholamines, angiotensin II → afferent constriction
- NSAIDs (inhibit prostaglandins that dilate afferent arteriole)
-
↑ Bowman's capsule pressure:
- Ureteral obstruction, bladder outlet obstruction (back-pressure)
-
↑ Plasma oncotic pressure:
- Hyperproteinemia, severe dehydration
-
↓ Kf:
- Glomerulonephritis (reduced filtering surface), mesangial cell contraction (angiotensin II)
-
Hormones/mediators causing vasoconstriction:
- Angiotensin II (reduces GFR in afferent constriction; but maintains it via efferent)
- Endothelin, vasopressin (high doses)
Q.2(d) - Juxtaglomerular Apparatus (JGA)
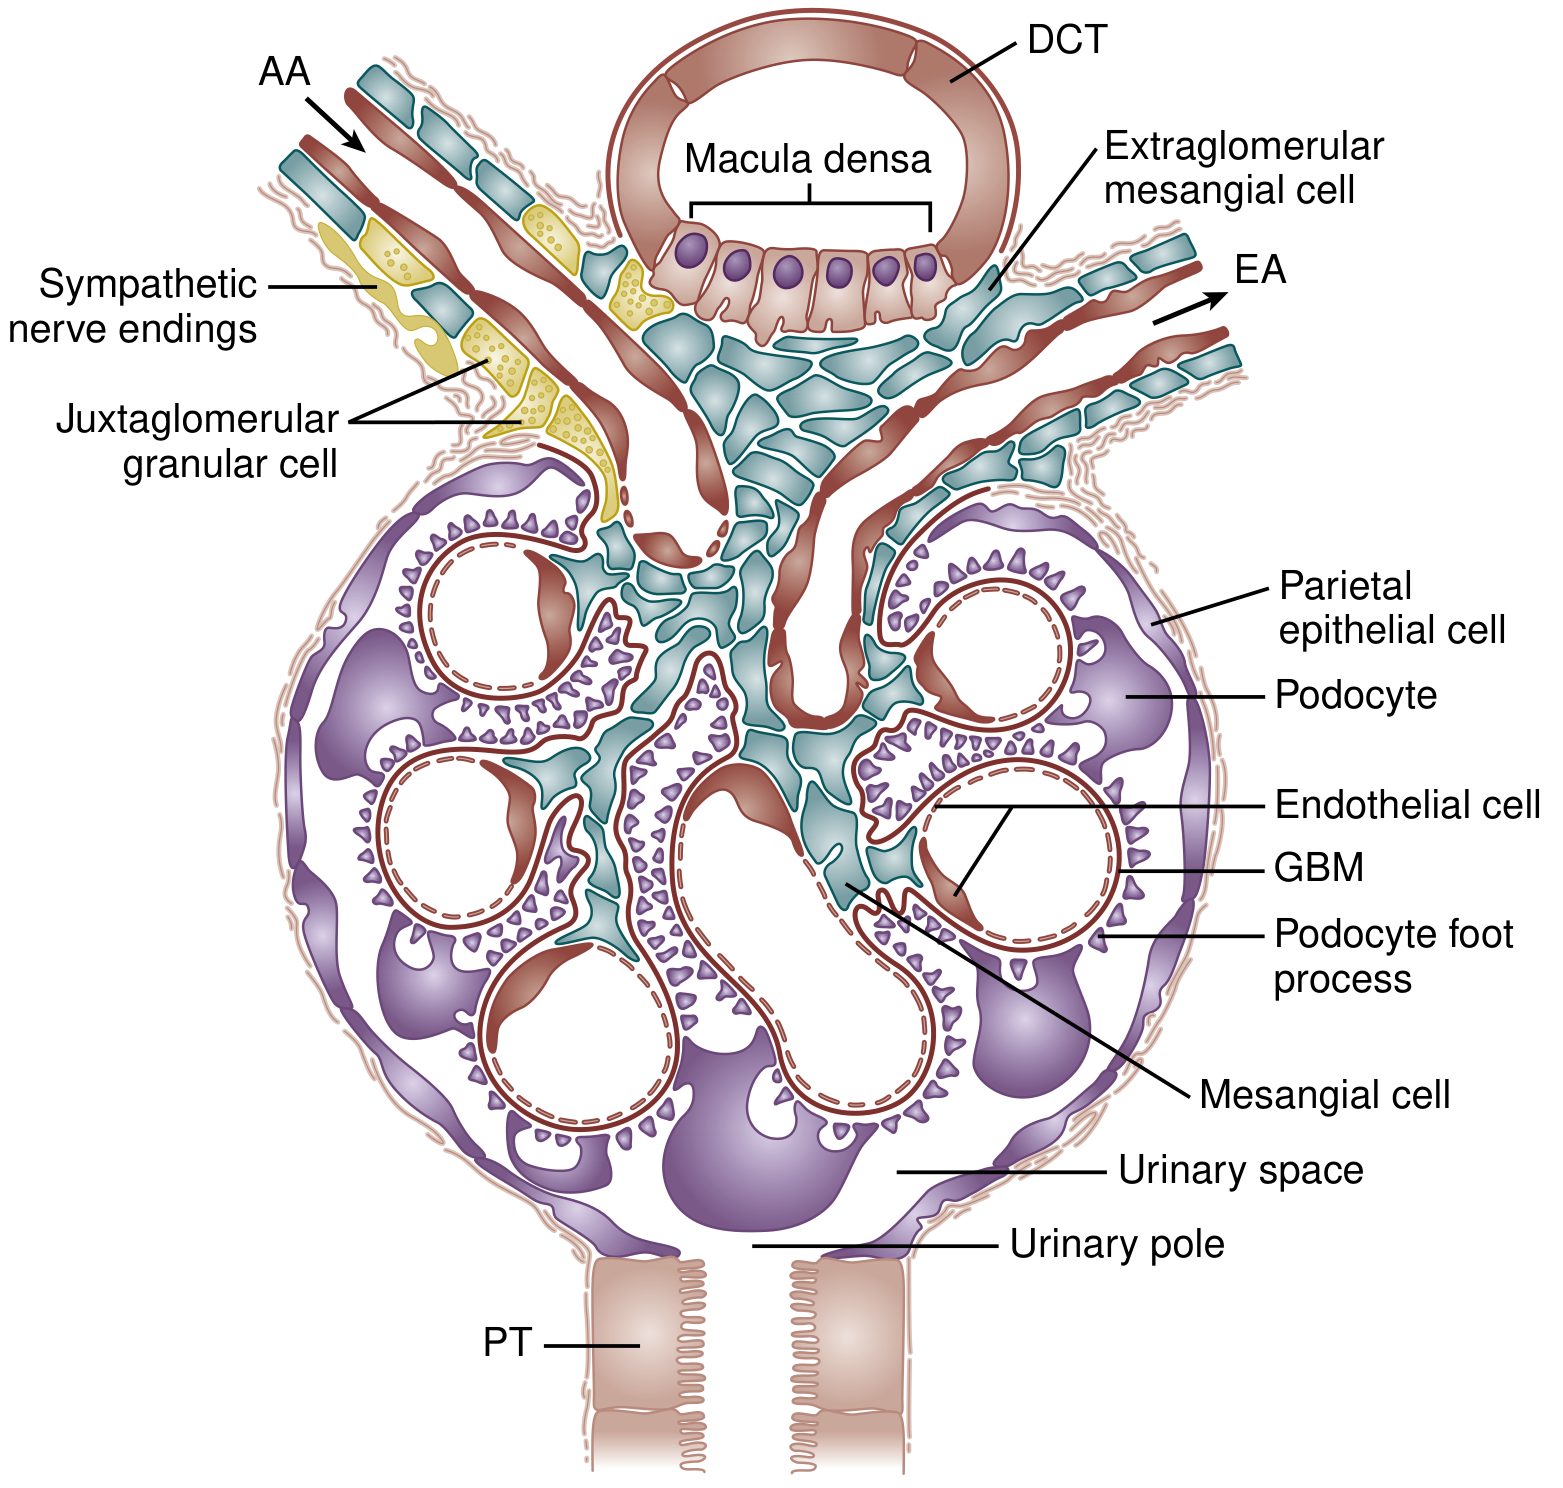
- A plaque of specialized tall, closely packed epithelial cells in the wall of the thick ascending limb of Henle where it contacts the glomerulus
- Named for their densely packed nuclei ("macula densa" = dense spot)
- Function: Sense NaCl concentration in tubular fluid
- High NaCl → signals to JG cells → adjusts GFR (tubuloglomerular feedback) and renin release
- Contain neuronal NOS and COX-2 (important for signaling)
- Have prominent lateral intercellular spaces that change width with functional state
- Modified smooth muscle cells in the wall of the afferent arteriole (and to lesser extent efferent arteriole)
- Contain cytoplasmic granules storing renin
- Function: Synthesize and secrete renin in response to:
- ↓ Renal perfusion pressure (stretch receptor mechanism)
- ↓ NaCl at macula densa (via adenosine/PGE2 signaling)
- ↑ Sympathetic stimulation (via β1 adrenergic receptors → cAMP → renin release)
- Low plasma sodium
- Located between the macula densa, afferent, and efferent arterioles
- Heavily branched cells interconnected by gap junctions
- Function: Relay signals between macula densa and JG cells; may modulate GFR by altering glomerular capillary surface area
| Function | Mechanism |
|---|---|
| Renin-Angiotensin-Aldosterone System (RAAS) | JG cells release renin → cleaves angiotensinogen → Ang I → Ang II (via ACE) → vasoconstriction + aldosterone + ADH → ↑ BP and Na+ retention |
| Tubuloglomerular Feedback (TGF) | Macula densa senses ↑ NaCl → adenosine release → afferent vasoconstriction → ↓ GFR (prevents tubular overload) |
| Autoregulation of GFR | TGF is one of two mechanisms (with myogenic reflex) that maintain GFR relatively constant despite changes in blood pressure (80-180 mmHg) |
Q.2(e) - Professional Qualities and Roles of a Physician
- Thorough, up-to-date knowledge of biomedical sciences and clinical medicine
- Commitment to lifelong learning and continuing medical education (CME)
- Evidence-based practice
- Proficiency in history taking, physical examination, and diagnostic reasoning
- Skill in procedures appropriate to one's specialty
- Sound clinical judgment and decision-making
- Clear, empathetic communication with patients and families
- Ability to break bad news sensitively
- Effective communication with colleagues (oral, written, electronic)
- Active listening
- Respect for patient autonomy and dignity
- Maintaining confidentiality (doctor-patient privilege)
- Honesty and integrity in all professional dealings
- Accountability to patients, society, and the profession
- Punctuality and reliability
- Understanding the patient's suffering, fears, and psychosocial context
- Treating the whole person - not just the disease
- Adherence to the four principles of medical ethics:
- Beneficence (do good)
- Non-maleficence (do no harm)
- Autonomy (respect patient's right to decide)
- Justice (fair distribution of resources)
- Informed consent for all procedures
- Avoiding conflicts of interest
| Role | Description |
|---|---|
| Medical Expert | Core role: diagnosing and treating disease using clinical knowledge and skills |
| Communicator | Building therapeutic relationships; effective information exchange |
| Collaborator | Working effectively in a healthcare team (nurses, specialists, allied health) |
| Leader/Manager | Managing clinical teams, participating in healthcare administration |
| Health Advocate | Promoting health of individual patients and the community; addressing determinants of health |
| Scholar | Lifelong learner; critical appraisal of evidence; contributing to medical education and research |
| Professional | Demonstrating high ethical standards, self-regulation, and commitment to patients above self-interest |
Sources: Costanzo Physiology 7th Ed, Guyton & Hall Medical Physiology, Ganong's Review of Medical Physiology 26th Ed, Brenner & Rector's The Kidney, National Kidney Foundation Primer on Kidney Diseases 8e, Bradley & Daroff's Neurology in Clinical Practice, Comprehensive Clinical Nephrology 7th Ed
Parkinsons disease
Parkinson disease substantia nigra Lewy body pathology midbrain
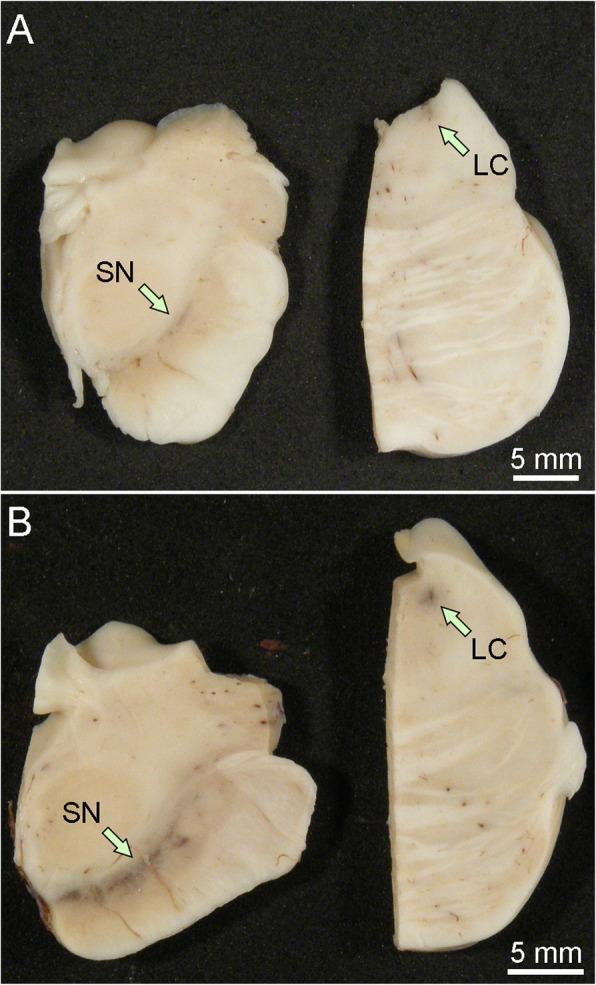
This clinical photograph shows a macroscopic comparison of post-mortem human brain tissue specimens from the midbrain and pons. The image is divided into two panels: (A) representing a brain with Lewy body disease and (B) representing a healthy control. Green arrows indicate two critical anatomical landmarks: the substantia nigra (SN) in the midbrain sections and the locus coeruleus (LC) in the pontine sections. In the control sample (B), both the SN and LC exhibit distinct, dark pigmentation due to the presence of neuromelanin. In the Lewy body disease sample (A), there is a significant and visible loss of this neuromelanin pigment, resulting in a pale appearance of these nuclei. This depigmentation is a hallmark pathological finding in synucleinopathies such as Parkinson's disease and Dementia with Lewy Bodies, reflecting the progressive loss of dopaminergic neurons in the substantia nigra and noradrenergic neurons in the locus coeruleus. A 5 mm scale bar is provided for anatomical reference.
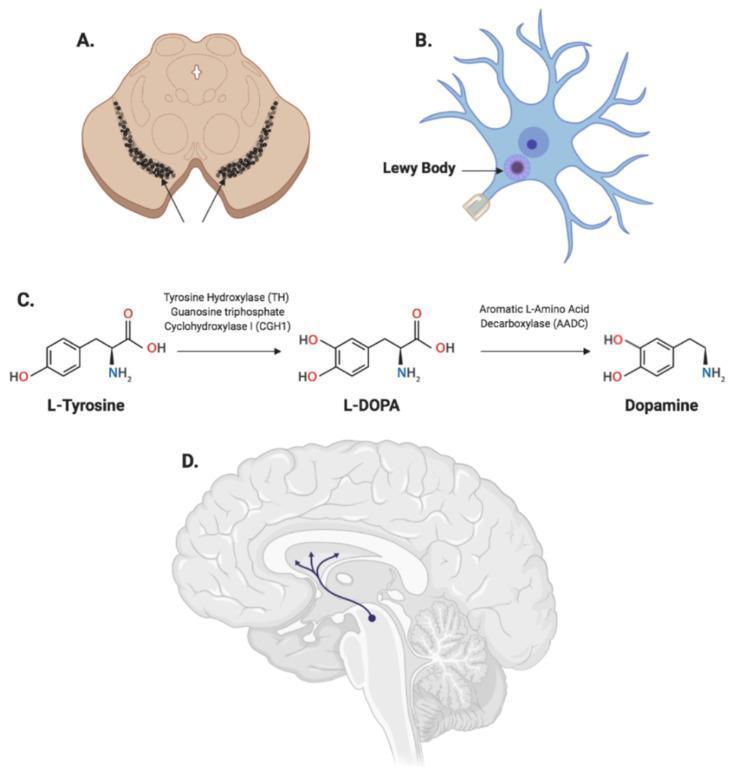
Educational infographic illustrating the neuro-pathophysiology of Parkinson's Disease (PD) through four distinct panels. Panel A displays a cross-sectional anatomical diagram of the midbrain, highlighting the bilateral, arc-shaped dark regions of the substantia nigra pars compacta. Panel B shows a schematic of a dopaminergic neuron containing a prominent intracellular Lewy Body, characterized as a dense, circular proteinaceous inclusion within the cell body. Panel C presents a biochemical flowchart of dopamine synthesis, detailing the enzymatic conversion of L-Tyrosine to L-DOPA via tyrosine hydroxylase (TH) and GCH1, followed by decarboxylation to Dopamine by aromatic L-amino acid decarboxylase (AADC). Panel D provides a sagittal view of the human brain, illustrating the nigrostriatal pathway where neurons from the substantia nigra project to the striatum within the basal ganglia. This combined visual explores the relationship between gross anatomical changes, cellular proteinopathy, neurotransmitter biochemistry, and neural circuit dysfunction in the progression of PD.
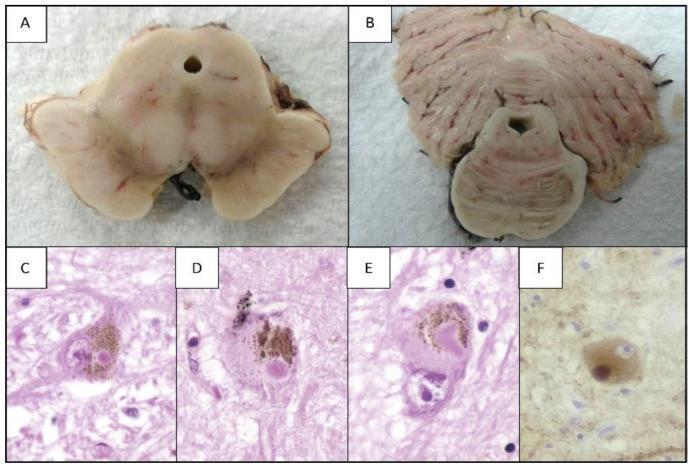
This composite image illustrates the macroscopic and microscopic histopathological hallmarks of Parkinson's Disease (PD) across different brain regions. Panels A and B present gross cross-sections of the midbrain and pons, respectively. Panel A demonstrates characteristic depigmentation of the substantia nigra and a dilated cerebral aqueduct. Panel B shows slight depigmentation of the locus ceruleus. Panels C, D, and E provide light microscopy views (Hematoxylin and Eosin, 1000x magnification) of dopaminergic neurons in the substantia nigra. These sections highlight neuromelanin pigment and the presence of classical Lewy bodies—circular, eosinophilic (pink) intracytoplasmic inclusions that displace the nucleus. Panel F shows a similar neuron processed with immunohistochemistry using anti-alpha-synuclein antibodies (1000x magnification), revealing a brown-stained Lewy body that confirms the protein's presence within the inclusion. This collection serves as an educational reference for understanding neurodegeneration and protein aggregation in synucleinopathies.
Parkinson disease clinical features tremor rigidity bradykinesia gait
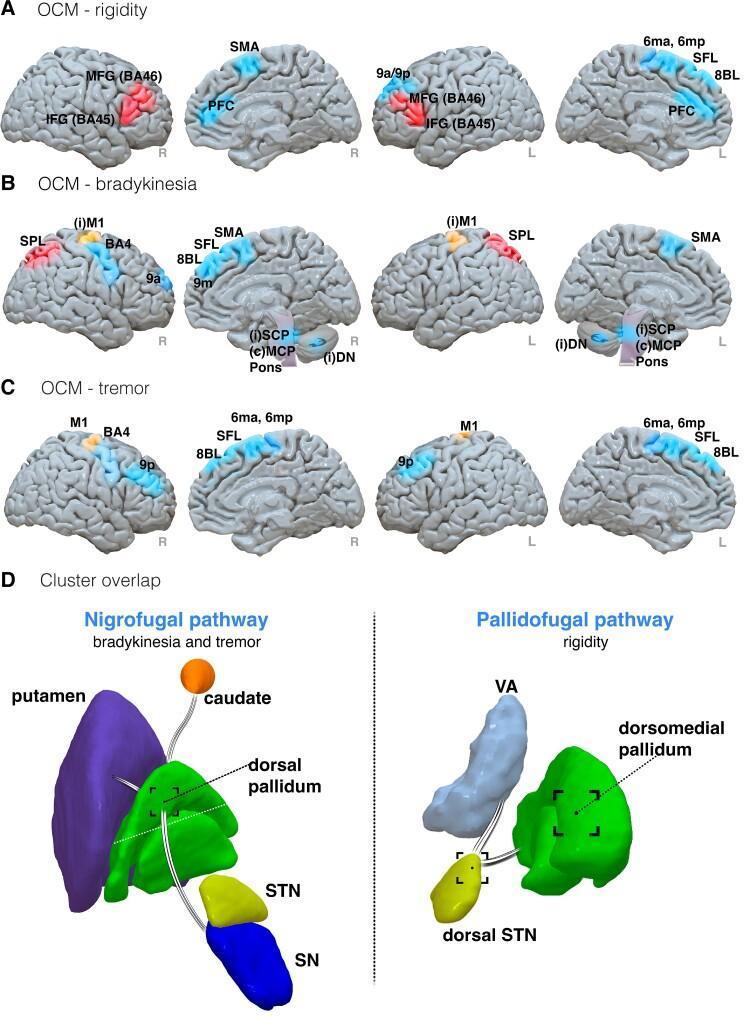
A four-panel medical illustration summarizing diffusion MRI results related to motor symptom improvement in Parkinson’s disease. Panels A, B, and C utilize Outcome Connectivity Mapping (OCM) to show cortical and subcortical regions associated with improvements in rigidity, bradykinesia, and tremor, respectively. Color-coding indicates clinical correlation: blue for improvement, red for worsening, and orange for mixed outcomes. Key identified regions include the supplementary motor area (SMA), prefrontal cortex (PFC), primary motor cortex (M1), and superior frontal language area (SFL). Panel D illustrates 'Cluster overlap' for two major white matter tracts: the Nigrofugal pathway (left), connecting the substantia nigra (SN) and subthalamic nucleus (STN) to the putamen and caudate, associated with bradykinesia and tremor; and the Pallidofugal pathway (right), connecting the dorsomedial pallidum and dorsal STN to the ventral anterior (VA) nucleus of the thalamus, associated with rigidity. Labels identify anatomical structures and Brodmann areas (BA), providing a structural basis for deep brain stimulation (DBS) efficacy.
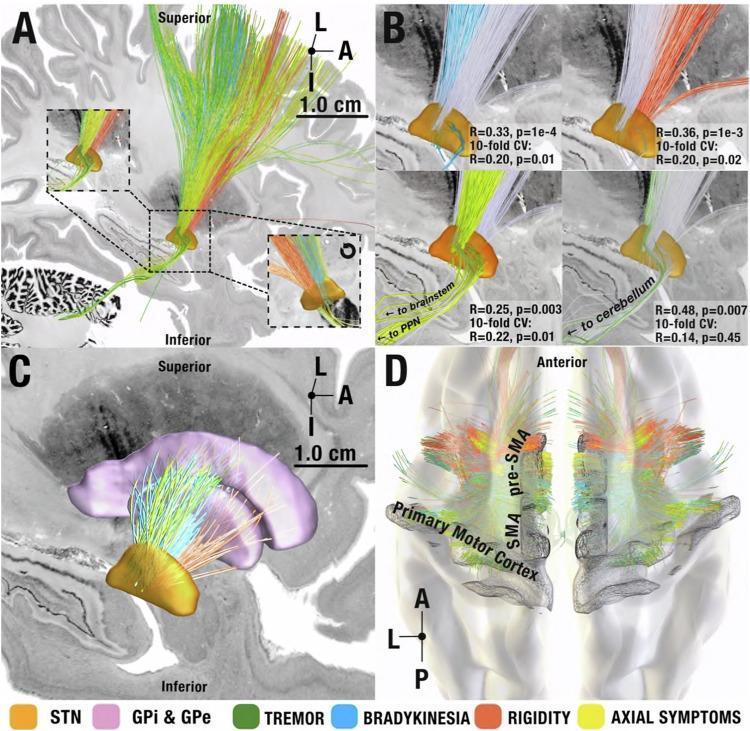
This medical visual consists of four panels (A-D) illustrating deep brain stimulation (DBS) symptom-response tracts in Parkinson’s disease using fiber tractography. The anatomical focus is the subthalamic nucleus (STN, orange) and its functional connectivity. Panels A-C provide medial sagittal views showing a distinct rostrocaudal gradient of symptom-specific fiber pathways passing through the STN: tremor-responsive tracts (green) are most posterior/occipital, followed by bradykinesia (blue), axial symptoms (yellow), and rigidity (red) in the anterior direction. Panel B highlights statistical correlations and cross-validation for each symptom tract, noting connections to the pedunculopontine nucleus (PPN), brainstem, and cerebellum. Panel C illustrates indirect pathway streamlines between the STN and the globus pallidus (GPi/GPe, purple). Panel D shows an axial/superior view of the cortical origins of hyperdirect projections; tremor-associated streamlines originate from the primary motor cortex, while hypokinetic symptoms (bradykinesia, rigidity, axial) correlate with streamlines originating from the supplementary motor area (SMA) and pre-SMA. The figure serves as a neuroanatomical guide for targeting specific Parkinsonian symptoms during neuromodulation.
Parkinson's Disease
1. Definition and Epidemiology
- Second most common neurodegenerative disease (after Alzheimer's)
- Affects ~1 in 1,000 in the general population; at least 1% of persons >65 years
- Men affected slightly more than women (3:2 ratio)
- Typically presents between 55 and 65 years of age
- Prevalence is rising with global population aging
2. Etiology and Pathogenesis
Causes (variable combination):
| Gene/Mutation | Inheritance | Notes |
|---|---|---|
| α-synuclein (SNCA) | Autosomal dominant | Mutations, duplications, or triplications → abnormal protein aggregation → Lewy bodies |
| LRRK2 | Autosomal dominant | Most common cause of inherited PD; classical late-onset phenotype |
| Parkin | Autosomal recessive | Early-onset parkinsonism |
| PINK1 | Autosomal recessive | Early-onset; mitochondrial dysfunction |
| DJ-1 | Autosomal recessive | Early-onset; oxidative stress |
| GBA (glucocerebrosidase) | Risk factor | Associated with faster progression and dementia |
- Pesticides (rotenone, paraquat) - inhibit mitochondrial complex I
- Heavy metals (manganese, mercury)
- MPTP (1-methyl-4-phenyl-1,2,3,6-tetrahydropyridine) - a neurotoxin in illicit drugs; causes acute parkinsonism by being oxidized to MPP+ which selectively destroys dopaminergic neurons in substantia nigra
- Traumatic brain injury
- Oxidative stress - reactive oxygen species damage mitochondria and neurons
- Mitochondrial dysfunction - complex I inhibition
- Protein misfolding and aggregation - α-synuclein aggregates form Lewy bodies
- Neuroinflammation - activated microglia release cytotoxic mediators
- Excitotoxicity
- Loss of trophic support
- Prion-like cell-to-cell transmission of toxic α-synuclein ("permissive templating") may explain disease spread
3. Pathology
Gross Pathology:
- Loss of pigmentation (neuromelanin) of the substantia nigra pars compacta and locus coeruleus on cross-section through the midbrain - hallmark macroscopic finding
Histopathology:
- Neuronal loss and gliosis in the substantia nigra pars compacta
- Lewy bodies - eosinophilic, spherical, intracytoplasmic inclusions within surviving neurons; composed mainly of α-synuclein and ubiquitin (confirmed with anti-α-synuclein immunohistochemistry)
- Lewy neurites - abnormal protein deposits within neuronal processes
- ~60% of dopaminergic neurons must be lost before classic motor symptoms appear
4. Neurochemical Basis (Dopamine-ACh Imbalance)
- Inhibitory dopaminergic neurons from the substantia nigra (nigrostriatal pathway)
- Excitatory cholinergic neurons within the neostriatum
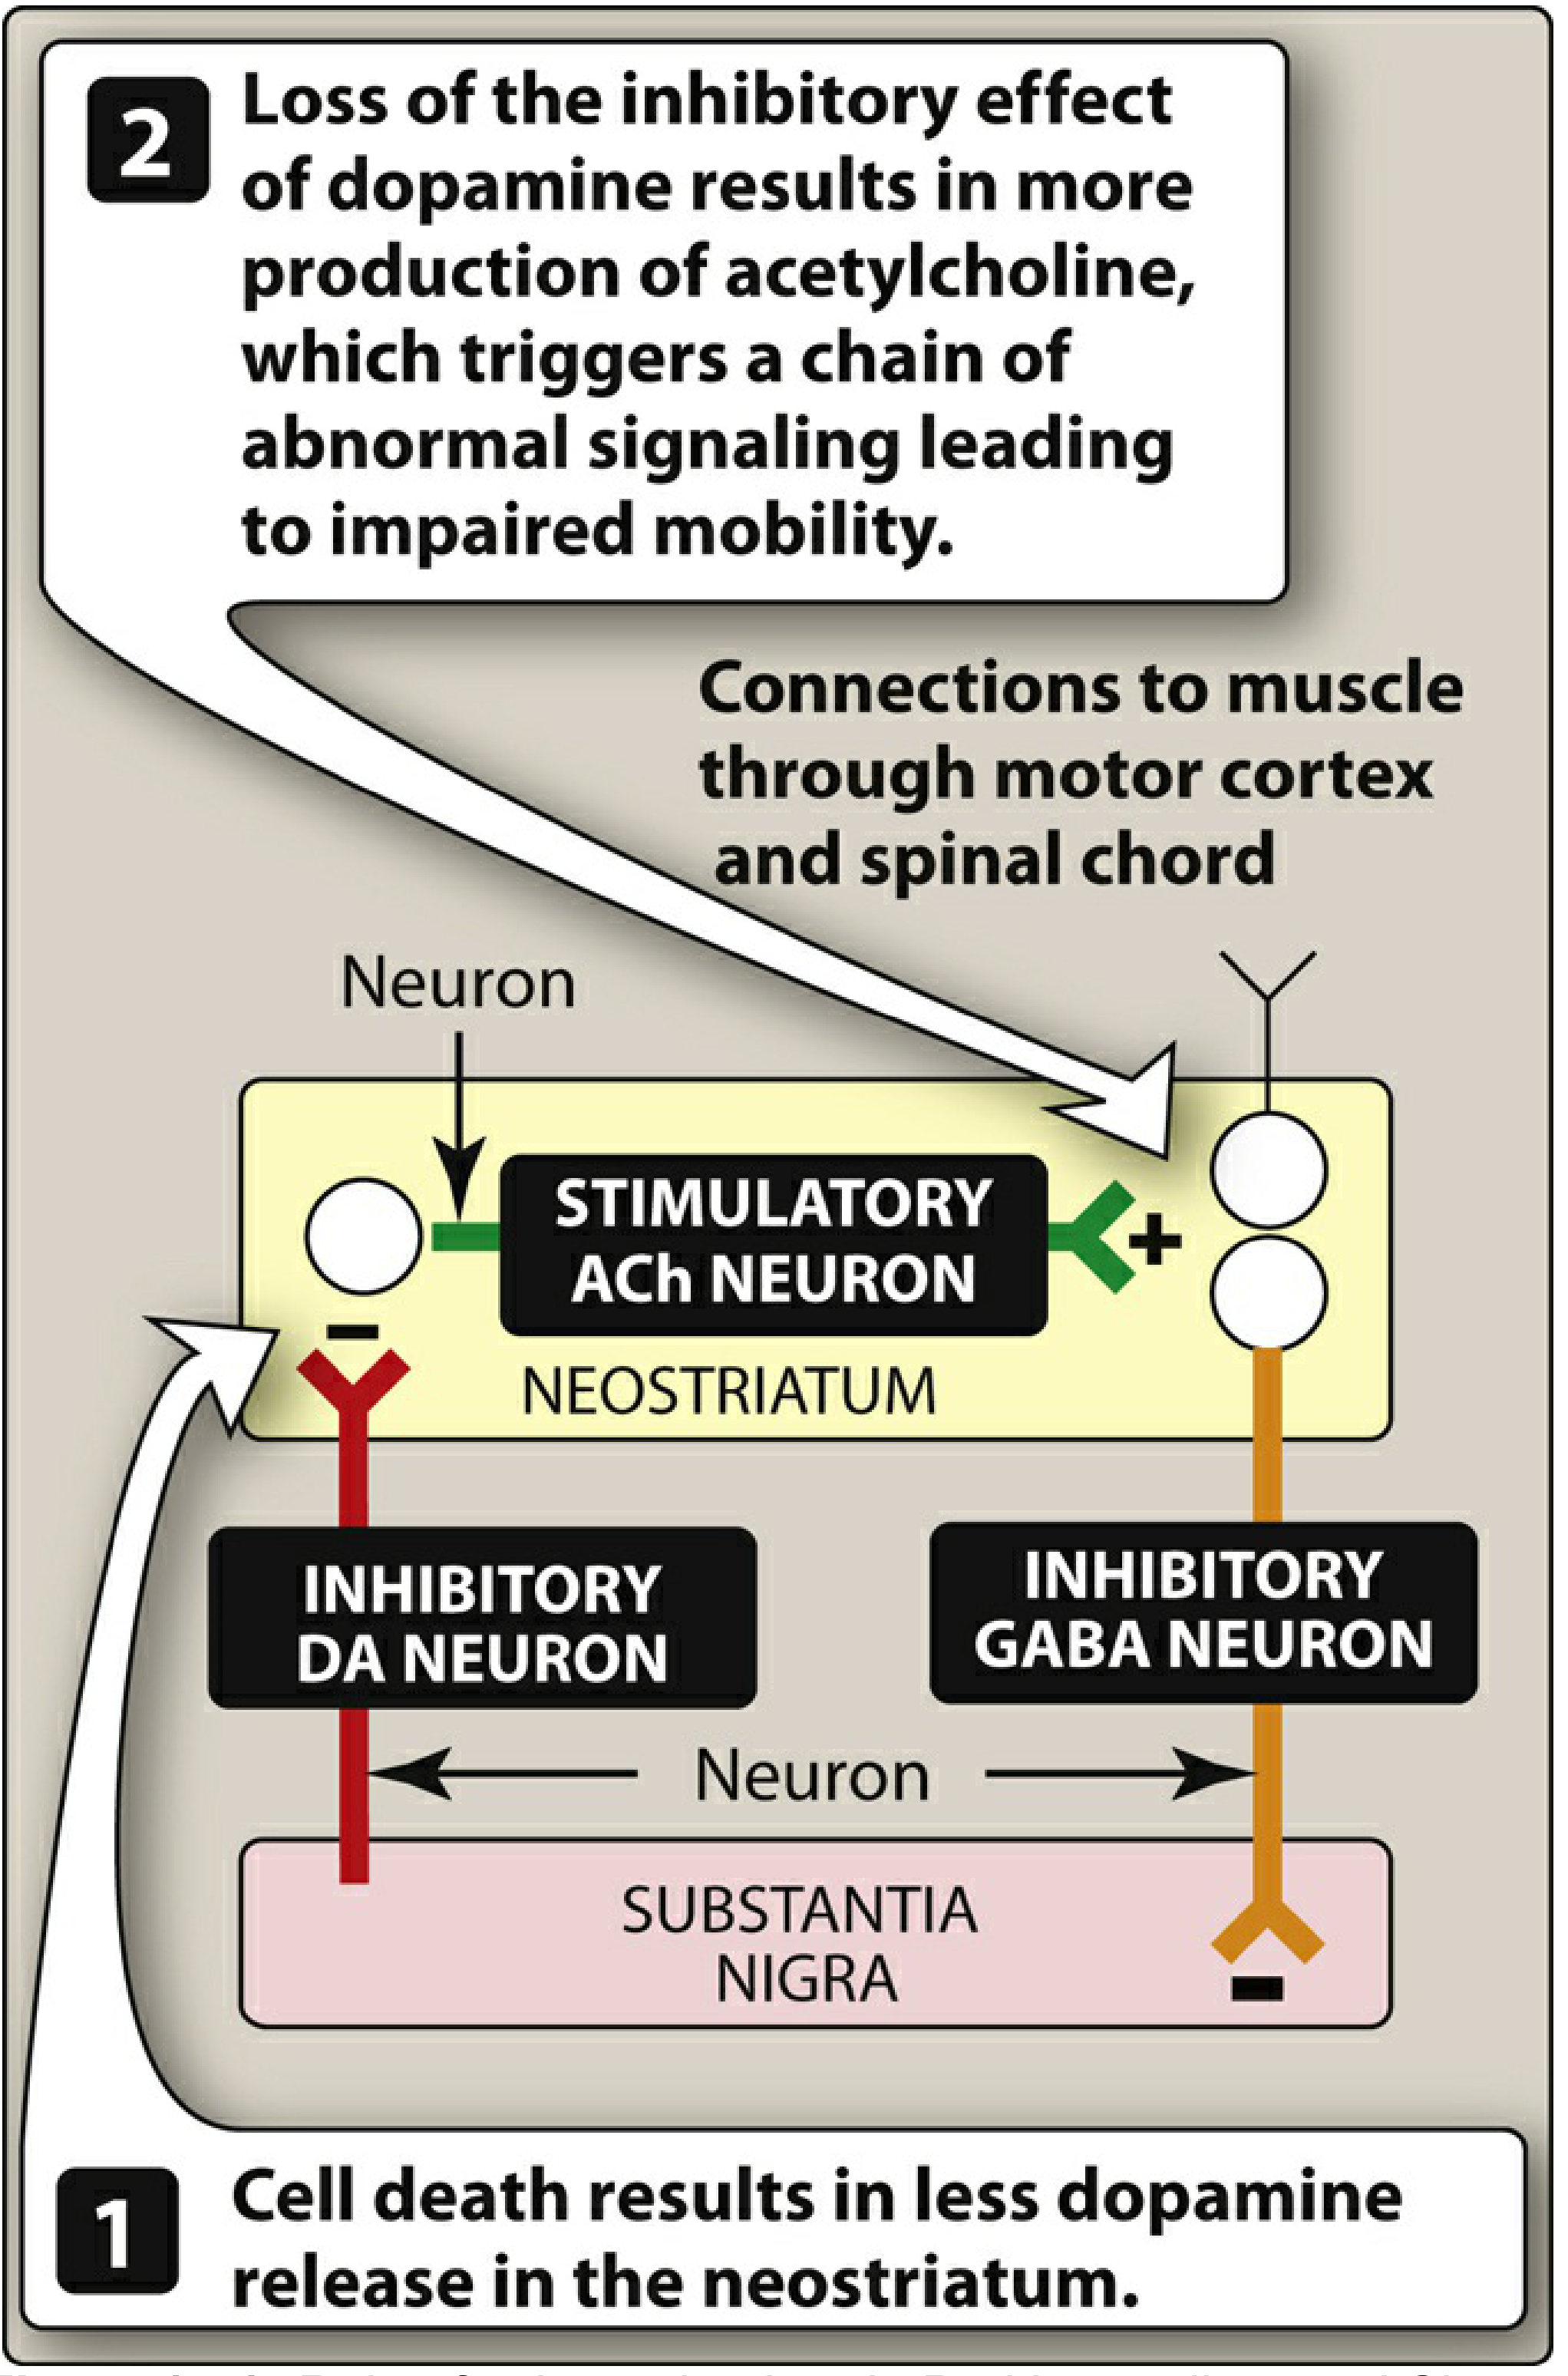
- Restoring dopamine in the basal ganglia (levodopa, dopamine agonists, MAO-B inhibitors, COMT inhibitors)
- Reducing cholinergic excess (anticholinergics like trihexyphenidyl, benztropine)
5. Clinical Features
Premotor/Prodromal Phase (years before motor symptoms):
- REM sleep behavioral disorder (RBD)
- Loss of olfaction (anosmia/hyposmia)
- Constipation
- Depression
- Autonomic dysfunction
Four Cardinal Motor Signs ("TRAP"):
- Resting tremor - hallmark; 4-6 Hz; "pill-rolling" character (thumb rubbing against index finger)
- Present when limb is at rest; diminishes with voluntary movement
- Accentuated by stress (e.g., mental calculations)
- Usually begins asymmetrically in one limb; asymmetry persists
- May re-emerge ("reemergent tremor") after brief pause in new position
- Higher frequency (7-10 Hz) postural/kinetic tremor also seen
- Increased muscle tone on passive flexion/extension
- "Cogwheel rigidity" - ratchet-like resistance when tremor is superimposed
- "Lead-pipe rigidity" - smooth, constant resistance without tremor
- Activated or worsened by contralateral limb movement (Froment's maneuver)
- Slowness, reduced amplitude, and fatigue of movement
- Manifestations include:
- Hypomimia ("masked facies," reptilian stare) - reduced facial expression and blinking
- Micrographia - progressively smaller handwriting
- Hypophonia - soft, monotonous speech
- Sialorrhea - drooling (impaired swallowing, not excess saliva production)
- Shuffling gait with reduced arm swing, shortened stride
- Freezing of gait - sudden inability to continue walking
- Difficulty rising from chair, turning in bed
- Stooped, flexed posture (anteropulsion)
- Loss of righting reflexes → falls
- Festination - tendency to walk progressively faster in short steps (propulsion forward)
- Assessed with the "pull test" - examiner pulls patient backward from behind
Non-Motor Features (increasingly prominent in advanced disease):
- Neuropsychiatric: Depression, anxiety, dementia (Parkinson's dementia - up to 80% at 20 years), psychosis, impulse control disorders
- Autonomic: Orthostatic hypotension, urinary urgency/frequency, erectile dysfunction, excessive sweating
- Sleep: REM sleep behavioral disorder, insomnia, daytime somnolence
- Sensory: Pain, paresthesias, anosmia
- Gastrointestinal: Constipation, dysphagia (oral, pharyngeal, esophageal), gastroparesis
6. Diagnosis
- PD is a clinical diagnosis based on the cardinal motor features
- UK Parkinson's Disease Society Brain Bank Criteria: bradykinesia + at least one of: resting tremor, rigidity, or postural instability; plus supporting criteria and exclusion of other causes
- Key supportive features: Unilateral onset, asymmetry, excellent response to levodopa, resting tremor, progressive course
- Genetic testing considered for early-onset (<50 years), positive family history
- Imaging:
- DaTscan (123I-ioflupane SPECT) - shows reduced dopamine transporter uptake in the striatum; helps distinguish PD from essential tremor (normal DaTscan) or drug-induced parkinsonism
- MRI - mainly to exclude other causes (vascular, structural); normal in PD
- Olfactory testing - loss of smell is an early marker
Differential Diagnosis of Parkinsonism:
- Essential tremor - postural/kinetic tremor, no rigidity, no bradykinesia, normal DaTscan
- Drug-induced parkinsonism - antipsychotics (D2 blockers), metoclopramide, prochlorperazine, reserpine
- Progressive supranuclear palsy (PSP) - vertical gaze palsy, early falls backward, symmetric onset
- Multiple system atrophy (MSA) - prominent autonomic failure + cerebellar/pyramidal signs
- Corticobasal degeneration - alien limb phenomenon, cortical sensory loss
- Dementia with Lewy bodies (DLB) - dementia precedes or coincides with motor symptoms
- Wilson's disease - young patient, liver disease, Kayser-Fleischer rings, low ceruloplasmin
- Vascular parkinsonism - lower body predominant, stepwise progression, vascular risk factors
7. Treatment
Pharmacological Treatment
- Levodopa: Dopamine precursor that crosses the blood-brain barrier (dopamine itself cannot); converted to dopamine in surviving neurons
- Carbidopa: Peripheral DOPA decarboxylase inhibitor - does NOT cross BBB; prevents peripheral conversion of levodopa to dopamine → reduces peripheral side effects, increases CNS availability, reduces required dose by 4-5x
- Efficacy: Most effective symptomatic treatment; excellent for bradykinesia and rigidity; reduces tremor
- Problems with long-term use:
- "Wearing off" - duration of response shortens as neurons are lost
- "On-off" fluctuations - unpredictable motor swings
- Dyskinesias (involuntary writhing movements) - occur during peak dose ("peak-dose dyskinesia")
- Contraindicated with MAO-A inhibitors (risk of hypertensive crisis)
- Directly stimulate dopamine receptors (D2/D3); do NOT require surviving neurons
- Non-ergot (preferred): Pramipexole, Ropinirole, Rotigotine (transdermal patch), Apomorphine (injectable - for severe "off" episodes)
- Ergot (less preferred): Bromocriptine (risk of fibrosis, vasospasm)
- Advantages: Longer duration of action, fewer motor fluctuations, delay need for levodopa
- Disadvantages: Nausea, somnolence, postural hypotension, impulse control disorders (gambling, hypersexuality, binge eating), hallucinations
- Selegiline, Rasagiline, Safinamide
- Inhibit monoamine oxidase type B → reduce dopamine degradation in the brain → prolong dopamine effect
- Used as monotherapy in early disease or as adjunct to levodopa (reduce "off" time)
- Mild neuroprotective potential (reduce oxidative stress)
- Entacapone, Opicapone (preferred - no hepatotoxicity), Tolcapone (risk of hepatic necrosis)
- Block peripheral COMT → reduce conversion of levodopa to 3-O-methyldopa → increase levodopa half-life and CNS delivery
- Always used in combination with levodopa/carbidopa (Stalevo = levodopa + carbidopa + entacapone)
- Reduce "wearing off"
- Trihexyphenidyl, Benztropine
- Block muscarinic receptors → reduce relative cholinergic excess
- Most useful for tremor-dominant PD in younger patients
- Poor for bradykinesia/rigidity
- Avoid in elderly (cognitive impairment, confusion, urinary retention, dry mouth, constipation)
- Weak dopamine releaser + NMDA glutamate receptor antagonist
- Mild anti-parkinsonian effect
- Particularly effective for levodopa-induced dyskinesias
- Also has antiviral properties
- Rivastigmine (AChE inhibitor) - for Parkinson's disease dementia
- Clonazepam - for REM sleep behavioral disorder
- Fludrocortisone, midodrine - for orthostatic hypotension
Summary of Drug Classes
| Drug | Mechanism | Best for |
|---|---|---|
| Levodopa/carbidopa | Dopamine precursor | All motor symptoms; gold standard |
| DA agonists (pramipexole, ropinirole) | D2/D3 agonist | Early disease; motor fluctuations |
| MAO-B inhibitors (selegiline, rasagiline) | Reduce DA breakdown | Early/adjunct therapy |
| COMT inhibitors (entacapone) | Reduce levodopa metabolism | "Wearing off" |
| Anticholinergics (trihexyphenidyl) | Block muscarinic receptors | Tremor (young patients) |
| Amantadine | NMDA antagonist + DA releaser | Dyskinesias, mild symptoms |
8. Non-Pharmacological and Surgical Treatment
- Physiotherapy - gait training, balance exercises, falls prevention
- Speech therapy - Lee Silverman Voice Treatment (LSVT LOUD) for hypophonia
- Occupational therapy - adaptive devices, home modifications
- Exercise - aerobic exercise shown to slow functional decline; neuroplasticity benefits
- High-frequency electrical stimulation of the subthalamic nucleus (STN) or globus pallidus interna (GPi)
- Reduces motor fluctuations, improves "on" time, reduces dyskinesias
- Does not improve dementia, autonomic dysfunction, speech
- Indicated when medication-refractory motor fluctuations/dyskinesias despite optimal pharmacotherapy
- Patient selection critical - good levodopa response, cognitive intact
- α-synuclein targeting (antibodies, antisense oligonucleotides)
- Gene therapy (AAV-based delivery of aromatic amino acid decarboxylase)
- Cell transplantation (induced pluripotent stem cells derived dopaminergic neurons)
- Focused ultrasound thalamotomy for tremor
9. Disease Progression and Prognosis
- PD is slowly progressive over decades
- Hoehn and Yahr scale - clinical staging from I (unilateral disease) to V (wheelchair/bed-bound)
- UPDRS (Unified Parkinson's Disease Rating Scale) - quantitative assessment tool
- Eventually levodopa response diminishes and non-dopaminergic symptoms dominate
- Major causes of death: aspiration pneumonia, falls, immobility
- Average life expectancy slightly reduced compared to age-matched controls
10. Quick Summary Card
| Feature | Detail |
|---|---|
| Core lesion | Loss of dopaminergic neurons in substantia nigra pars compacta |
| Hallmark pathology | Lewy bodies (α-synuclein + ubiquitin aggregates) |
| Biochemistry | DA deficiency → relative ACh excess in neostriatum |
| Cardinal signs | Tremor (resting, pill-rolling), Rigidity (cogwheel/lead-pipe), Akinesia/Bradykinesia, Postural instability |
| Key early feature | Asymmetric onset |
| Best treatment | Levodopa + Carbidopa |
| Main long-term complication | Motor fluctuations (wearing off, on-off), dyskinesias |
| Key diagnostic test | DaTscan (dopamine transporter imaging) |
| Neuroprotective drug | None proven yet (MAO-B inhibitors may have modest benefit) |