
What is Widal test
Widal test typhoid fever interpretation 2024
Widal test typhoid fever agglutination tube method
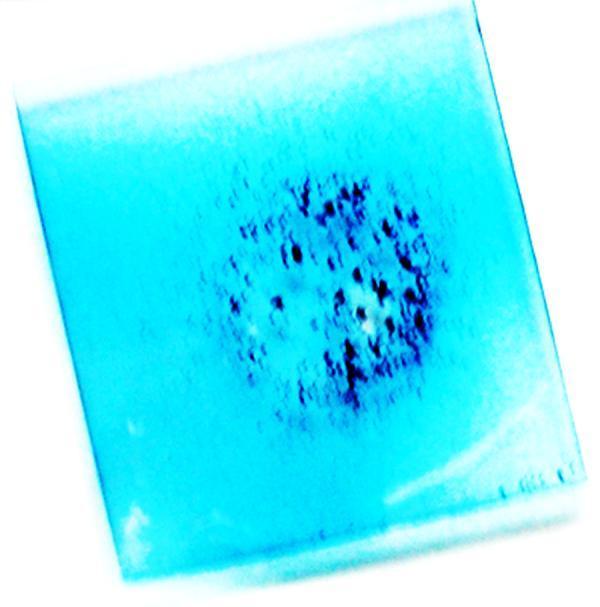
A clinical photograph showing a gross view of a glass slide used in a 'Superagglutination' test for serodiagnosis. The image captures the reaction with the unaided eye, demonstrating a positive result characterized by distinct macro-agglutination. A light blue background, created by the addition of Coomassie Blue dye to the test serum, surrounds a central cluster of dark, dense clumps. These clumps represent the cross-linked aggregates formed by the interaction between microbial antigens (originally stained with Rose Bengal dye) and serum antibodies, enhanced through biotin-streptavidin cross-linking. The non-uniform, granular distribution of these dark particles against the uniform blue liquid confirms the presence of specific antibodies. This diagnostic method is used to increase the sensitivity and visual clarity of standard agglutination assays, such as those for Brucella, by magnifying the clump size and providing color contrast for easier clinical interpretation.
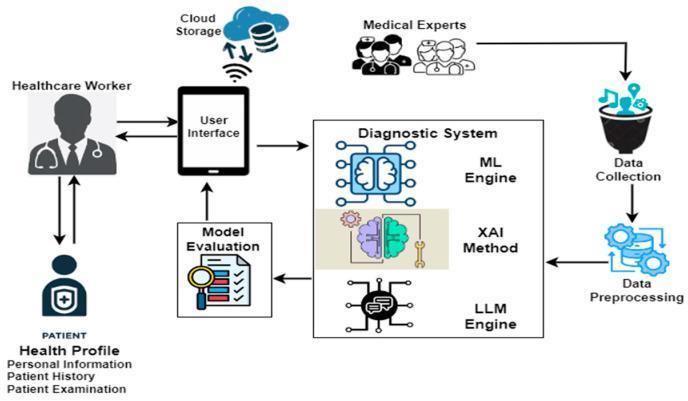
This medical flowchart illustrates a comprehensive digital framework for the diagnosis of malaria and typhoid fever, integrating clinician input with artificial intelligence. The workflow begins with a 'Healthcare Worker' interacting with a 'Patient' to establish a 'Health Profile' encompassing personal information, medical history, and physical examination data. This information is entered via a tablet-based 'User Interface,' which synchronized data with 'Cloud Storage' for retrieval and processing. Centrally, the 'Diagnostic System' processes the clinical data through three integrated computational layers: an Machine Learning (ML) Engine for predictive modeling, an eXplainable AI (XAI) Method to ensure diagnostic transparency, and a Large Language Model (LLM) Engine for natural language interpretation. The system is supported by a parallel pathway where 'Medical Experts' contribute to 'Data Collection' and 'Data Preprocessing' to refine the model's accuracy. A final 'Model Evaluation' phase feeds results back into the user interface, facilitating real-time clinical decision-making. The diagram emphasizes the transition from traditional bedside examination to AI-assisted tropical disease management.
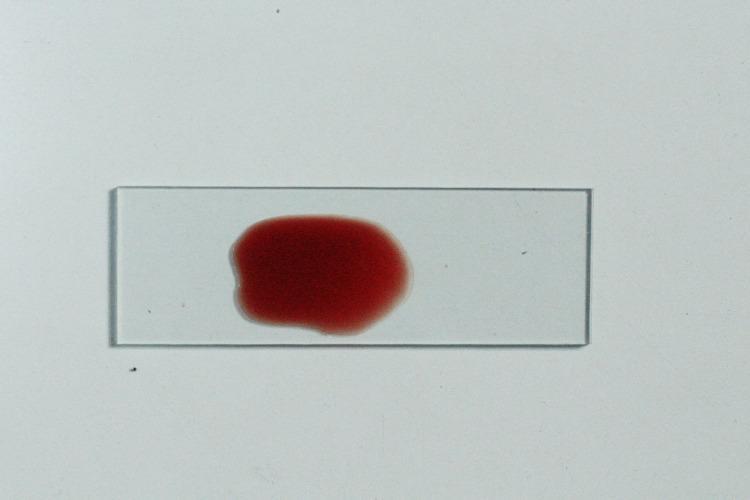
A clinical photograph of a glass microscope slide displaying a macroscopically negative agglutination reaction from a salivary secretor status test. A central, deep red liquid droplet is visible, representing a mixture of saliva, antisera, and indicator red blood cells. The sample shows a smooth, homogenous appearance with no visible clumping or granular precipitation, which indicates that the salivary blood group antigens have neutralized the antisera, preventing red cell agglutination. The droplet is roughly circular with diffuse margins where the liquid thins against the transparent glass surface. This visual finding is characteristic of a 'positive' secretor status result in the absorption-inhibition method, used in forensic medicine and clinical immunology to identify ABH antigens in body fluids. The absence of particulate structures confirms a uniform suspension of cells.
Widal Test
What It Is
| Antigen | Description | When Antibodies Appear |
|---|---|---|
| O antigen (somatic) | Heat-stable lipopolysaccharide from cell wall | Day 6-8 after onset |
| H antigen (flagellar) | Heat-labile flagellar protein | Day 10-12 after onset |
- Park's Textbook of Preventive and Social Medicine, p. 278
Principle
Interpretation
- A single titre of O antigen ≥ 1:160 is generally considered significant in most endemic settings, but cut-offs vary by country and local background seropositivity.
- A 4-fold rise in titre between an acute sample (first contact) and a convalescent sample (taken 2 weeks later) is stronger evidence of active infection.
- The test is usually positive in the second and third weeks of illness; the O antigen titre rises first, followed by H.
- Sleisenger and Fordtran's Gastrointestinal and Liver Disease, p. 2199
Limitations
- Up to 30% of culture-proven typhoid cases can be Widal-negative
- Blunting of antibody response due to prior antibiotic therapy
- Sample collected too early in the illness (before antibodies develop)
- Immunosuppressed patients
- S. typhi shares O and H antigens with other Salmonella serotypes and cross-reacts with other Enterobacteriaceae
- Previous typhoid vaccination raises baseline titres
- Other conditions: malaria, typhus, bacteraemia, liver cirrhosis
- Prior Salmonella infection in endemic populations makes background titres high, making interpretation unreliable
- Park's Textbook of Preventive and Social Medicine, p. 278
Gold Standard vs. Widal
| Test | Notes |
|---|---|
| Blood culture | Gold standard; positive in 60-80% early in illness (>90% for bone marrow) |
| Bone marrow culture | Highest yield (~90%+), even after antibiotics |
| Widal test | Only moderate accuracy; still widely used in resource-limited settings |
| Newer alternatives | Typhidot® (detects IgM/IgG to 50 kD antigen), IDL Tubex® (detects IgM), dipstick test |
Clinical Use Today
- Still useful in resource-limited endemic settings where blood cultures are unavailable
- Should always be interpreted alongside clinical findings (fever >7 days, relative bradycardia, rose spots, splenomegaly) and patient history (travel, vaccination status)
- Paired serum samples (acute + convalescent) are more informative than a single sample
- Newer point-of-care tests (Typhidot-M, Tubex) are increasingly replacing it in many settings