
Preganglionic parasympathetic nerves
preganglionic parasympathetic nerve pathway diagram autonomic nervous system
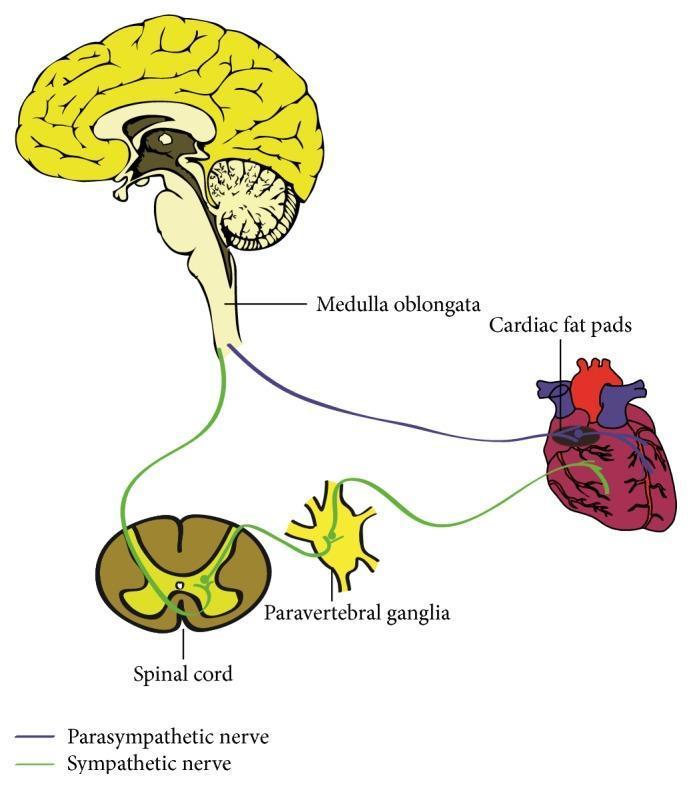
This medical anatomical diagram illustrates the autonomic innervation of the human heart, detailing both the parasympathetic and sympathetic pathways. The parasympathetic pathway is represented by a purple line originating from the medulla oblongata within the brainstem; these preganglionic fibers travel via the vagus nerve to synapse at the cardiac fat pads (ganglionated plexi) located on the epicardial surface. The sympathetic pathway is depicted in green, showing the circuit from the spinal cord to the paravertebral ganglia. From these ganglia, postganglionic sympathetic fibers project to the base of the heart and distribute into the myocardium. Key anatomical structures labeled include the medulla oblongata, cardiac fat pads, spinal cord, and paravertebral ganglia. The diagram serves as an educational tool for understanding the neural regulation of cardiac performance, specifically the origin and trajectory of autonomic fibers that modulate heart rate and contractility.
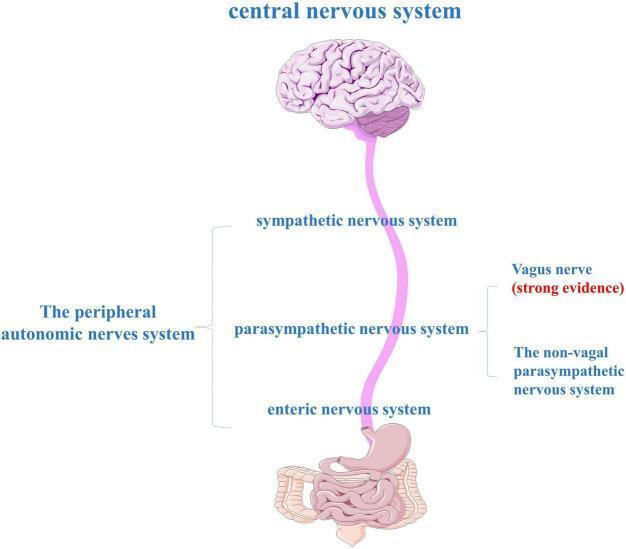
An anatomical diagram illustrating the components of the gut-brain axis and the peripheral autonomic nervous system (ANS). At the top, a human brain represents the central nervous system (CNS), which is connected via a long neural pathway to the gastrointestinal tract (stomach and intestines) at the bottom. The peripheral autonomic nervous system is categorized into three major divisions: the sympathetic nervous system, the parasympathetic nervous system, and the enteric nervous system (ENS). The diagram highlights the role of the vagus nerve within the parasympathetic division, noted with 'strong evidence' as a primary bidirectional communication route between the brainstem and the gut. It also distinguishes between vagal and non-vagal parasympathetic pathways. This illustration is used to explain the neuroanatomical basis of the gut-brain axis, particularly in the context of neurodegenerative research like Parkinson's disease, where alpha-synuclein may propagate from the ENS to the CNS via these autonomic pathways.
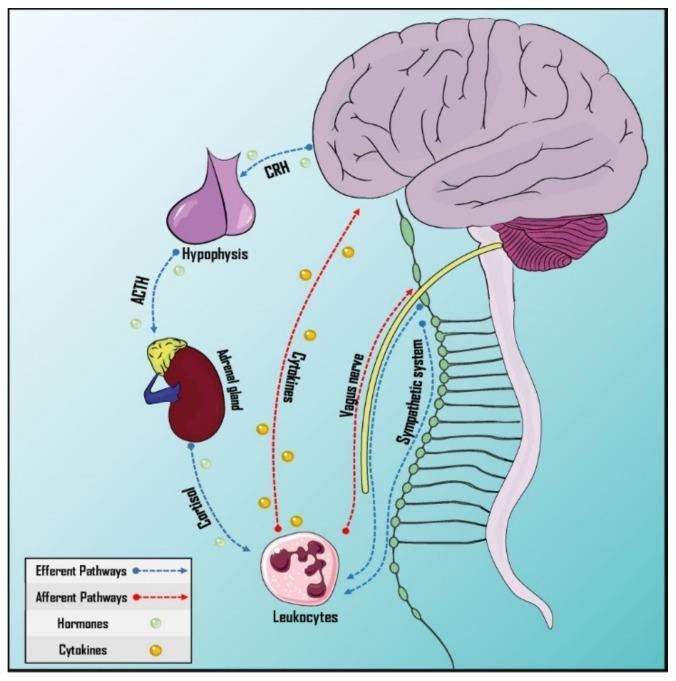
This pathophysiology diagram illustrates the bidirectional neuro-immune communication pathways of the psychoneuroimmunology (PNEI) system. It depicts the afferent (red dotted arrows) and efferent (blue dashed arrows) connections between the central nervous system and the immune system. The humoral efferent pathway highlights the Hypothalamus-Pituitary-Adrenal (HPA) axis, showing the sequence of CRH from the brain to the hypophysis, ACTH to the adrenal gland, and the subsequent release of cortisol. The neural pathways demonstrate the autonomic nervous system's involvement, specifically the vagus nerve (parasympathetic) and the sympathetic nervous system chain, which provide innervation to leukocytes and lymphoid structures. Afferent signaling is represented by cytokines (yellow spheres) crossing the blood-brain barrier and neural feedback via the vagus nerve. The diagram serves as an educational tool for understanding the molecular and anatomical basis of neuroimmunological integration, including the physiological mediators like hormones and cytokines that regulate the body's response to stress and internal stimuli.
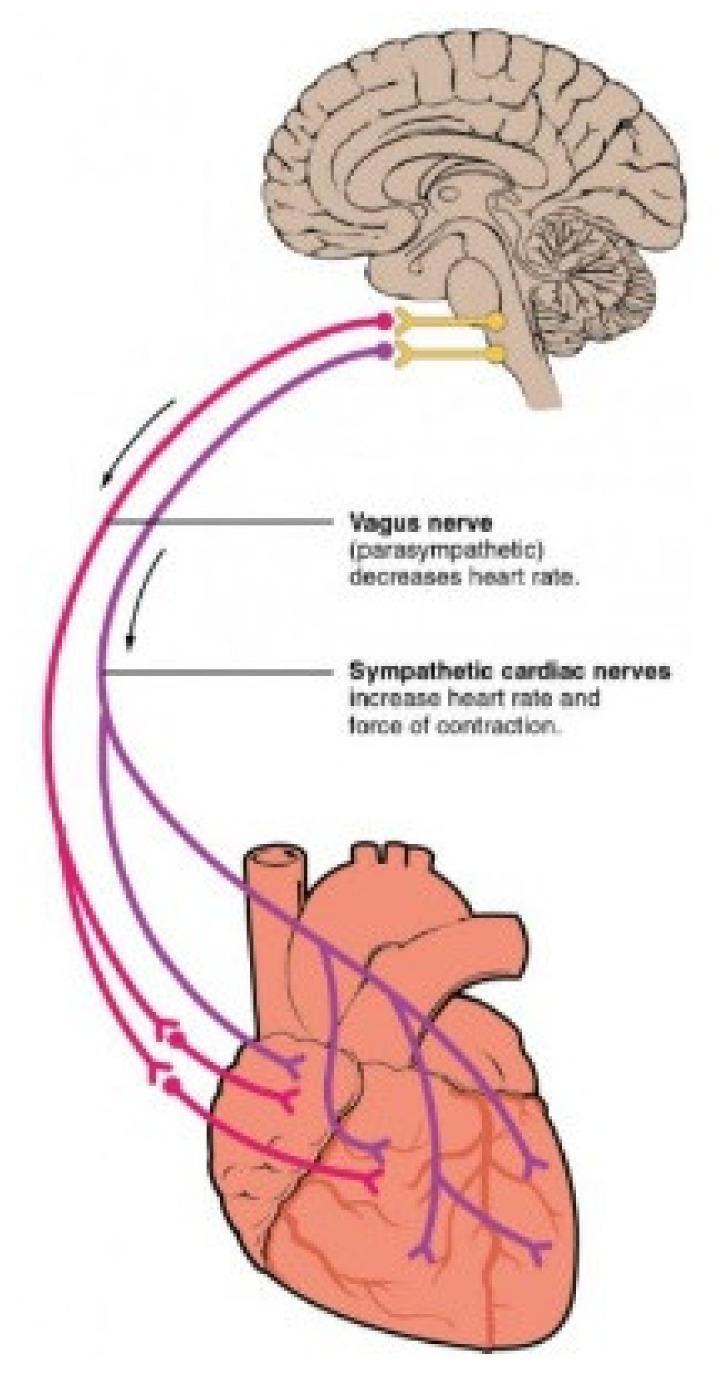
This medical illustration depicts the Autonomic Nervous System (ANS) pathways connecting the brainstem to the heart. A sagittal section of the human brain shows the medulla oblongata as the origin for both parasympathetic and sympathetic innervation. The Vagus nerve (parasympathetic), color-coded in purple, is shown descending from the brainstem to the heart, where it branches to innervate the atria and ventricles; text annotations indicate its role in decreasing heart rate. The sympathetic cardiac nerves, color-coded in red, originate from the same region and follow a parallel descending path, branching across the cardiac tissue; text labels specify their role in increasing both heart rate and the force of contraction. The diagram illustrates the functional antagonism between the two branches of the ANS in cardiac regulation, highlighting the primary innervation sites at the sinoatrial node, atrioventricular node, and the myocardium.
Preganglionic Parasympathetic Nerves
Overview
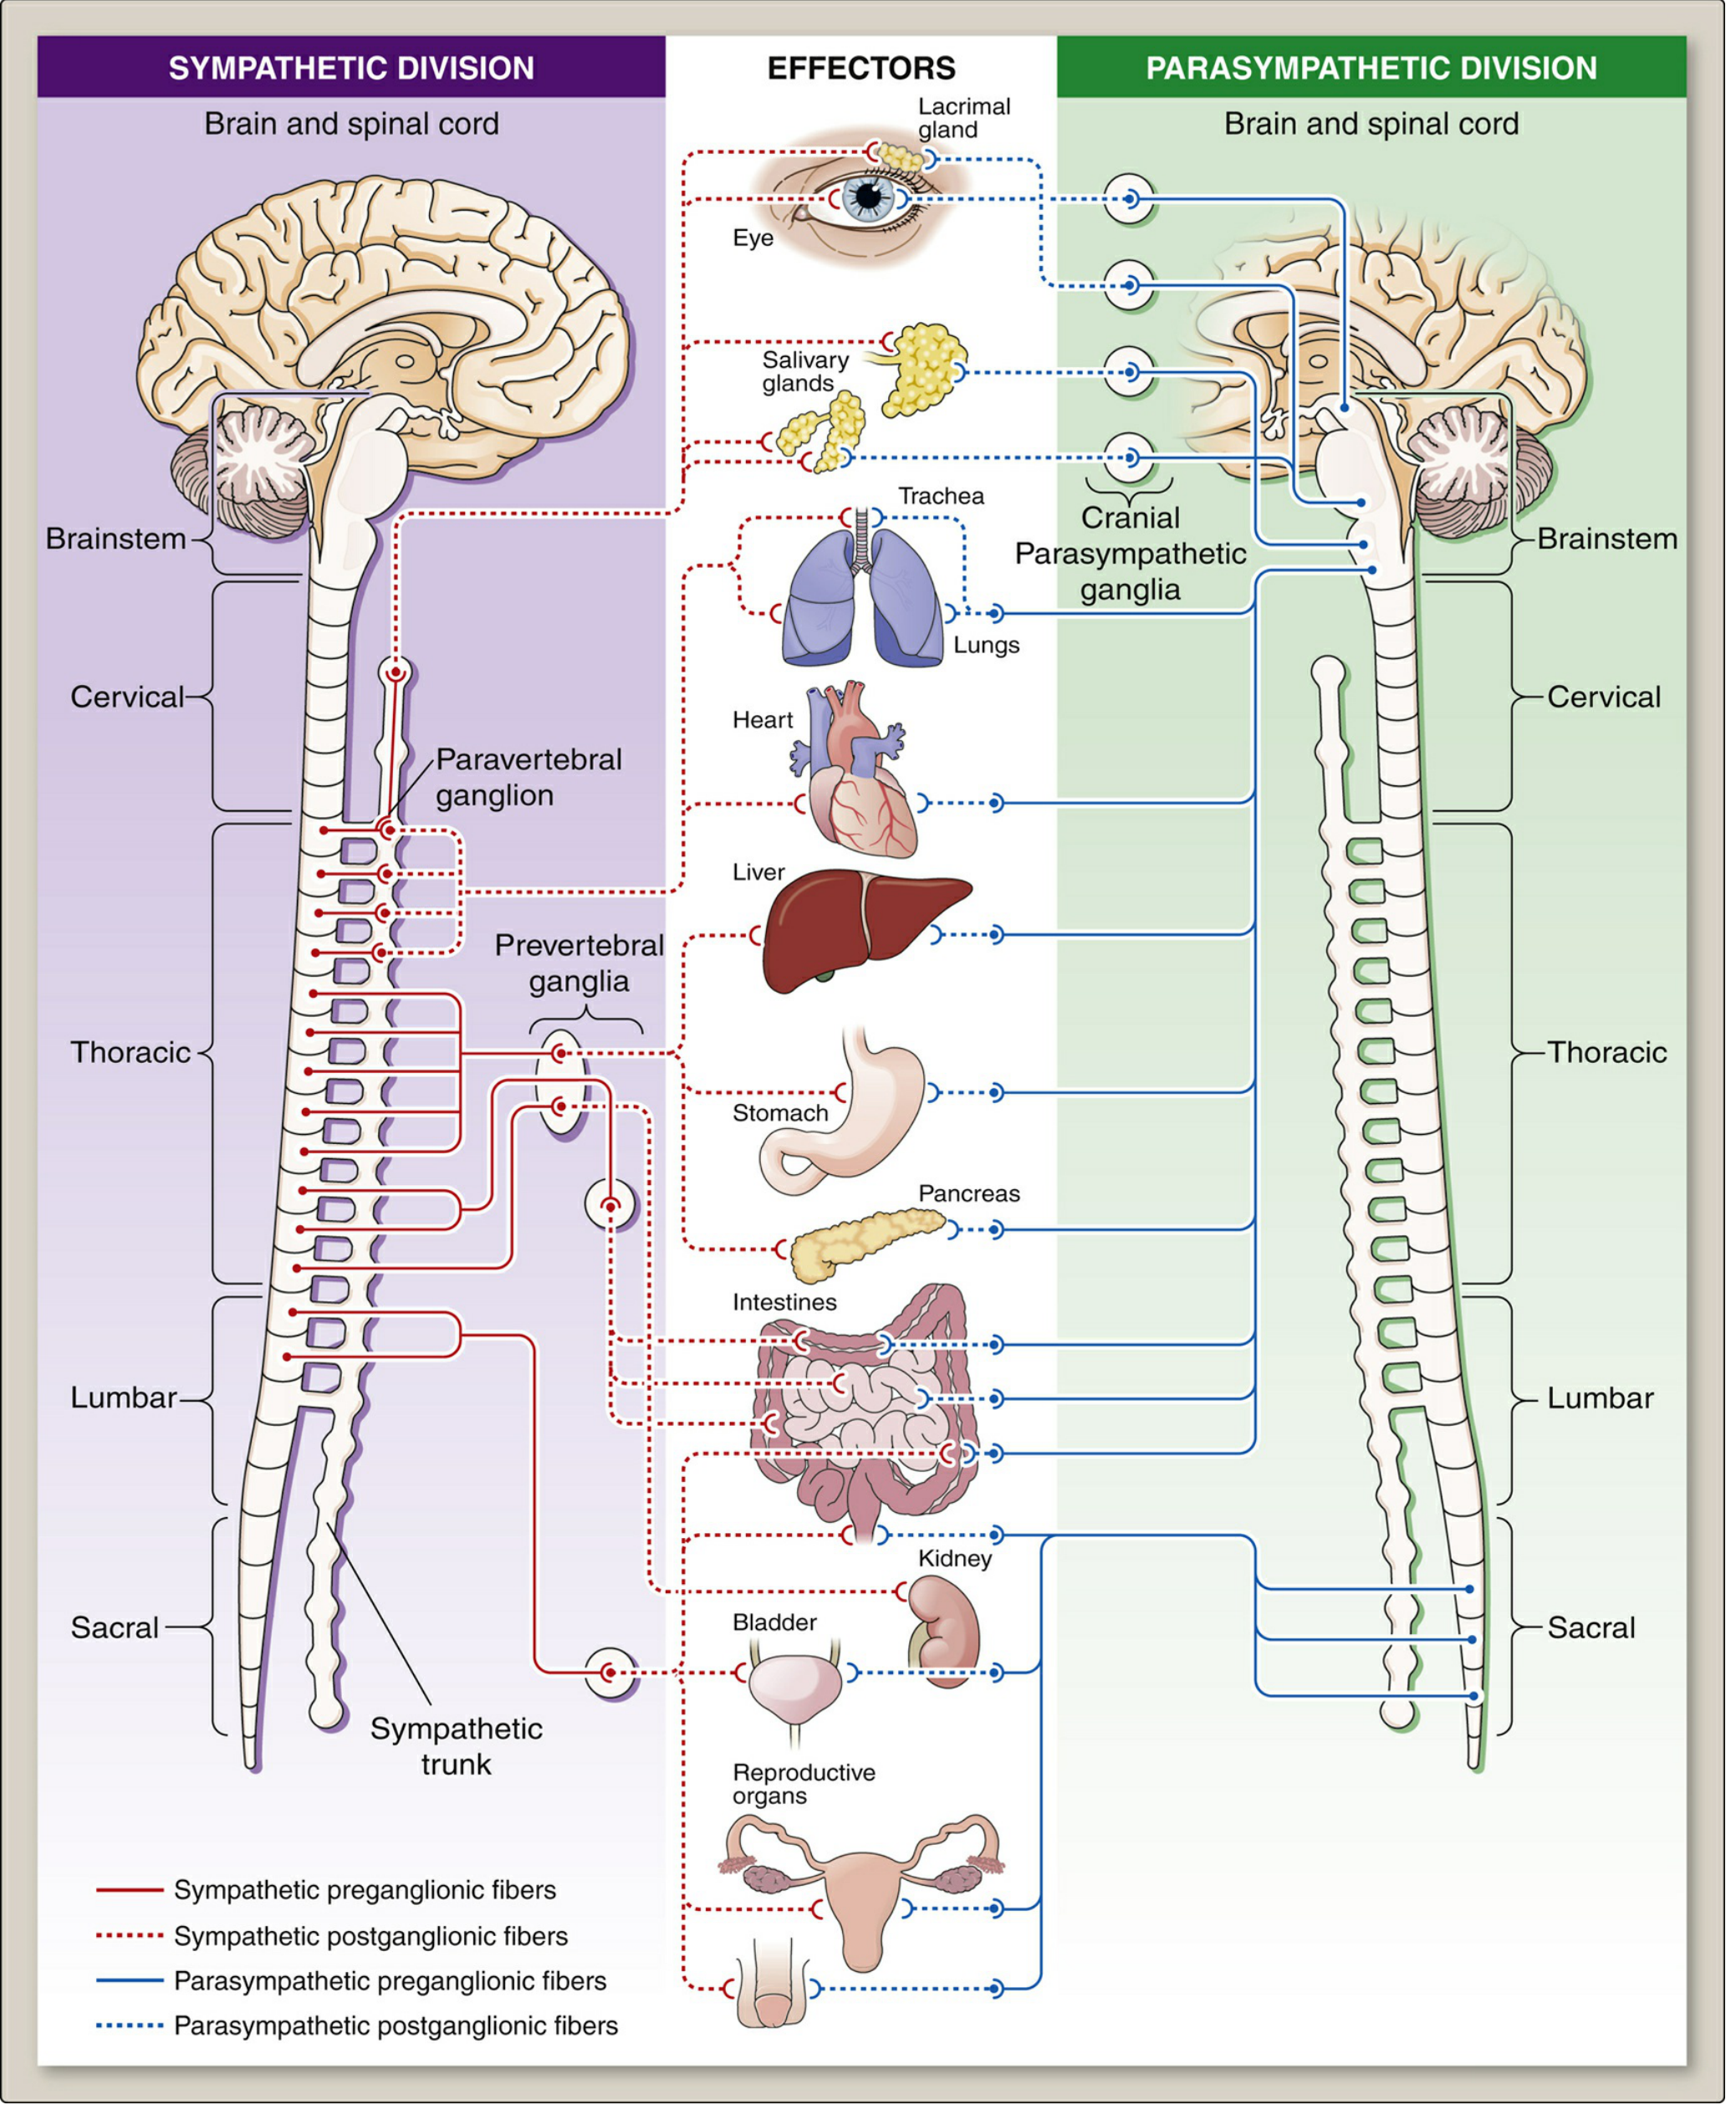
Origin of Cell Bodies
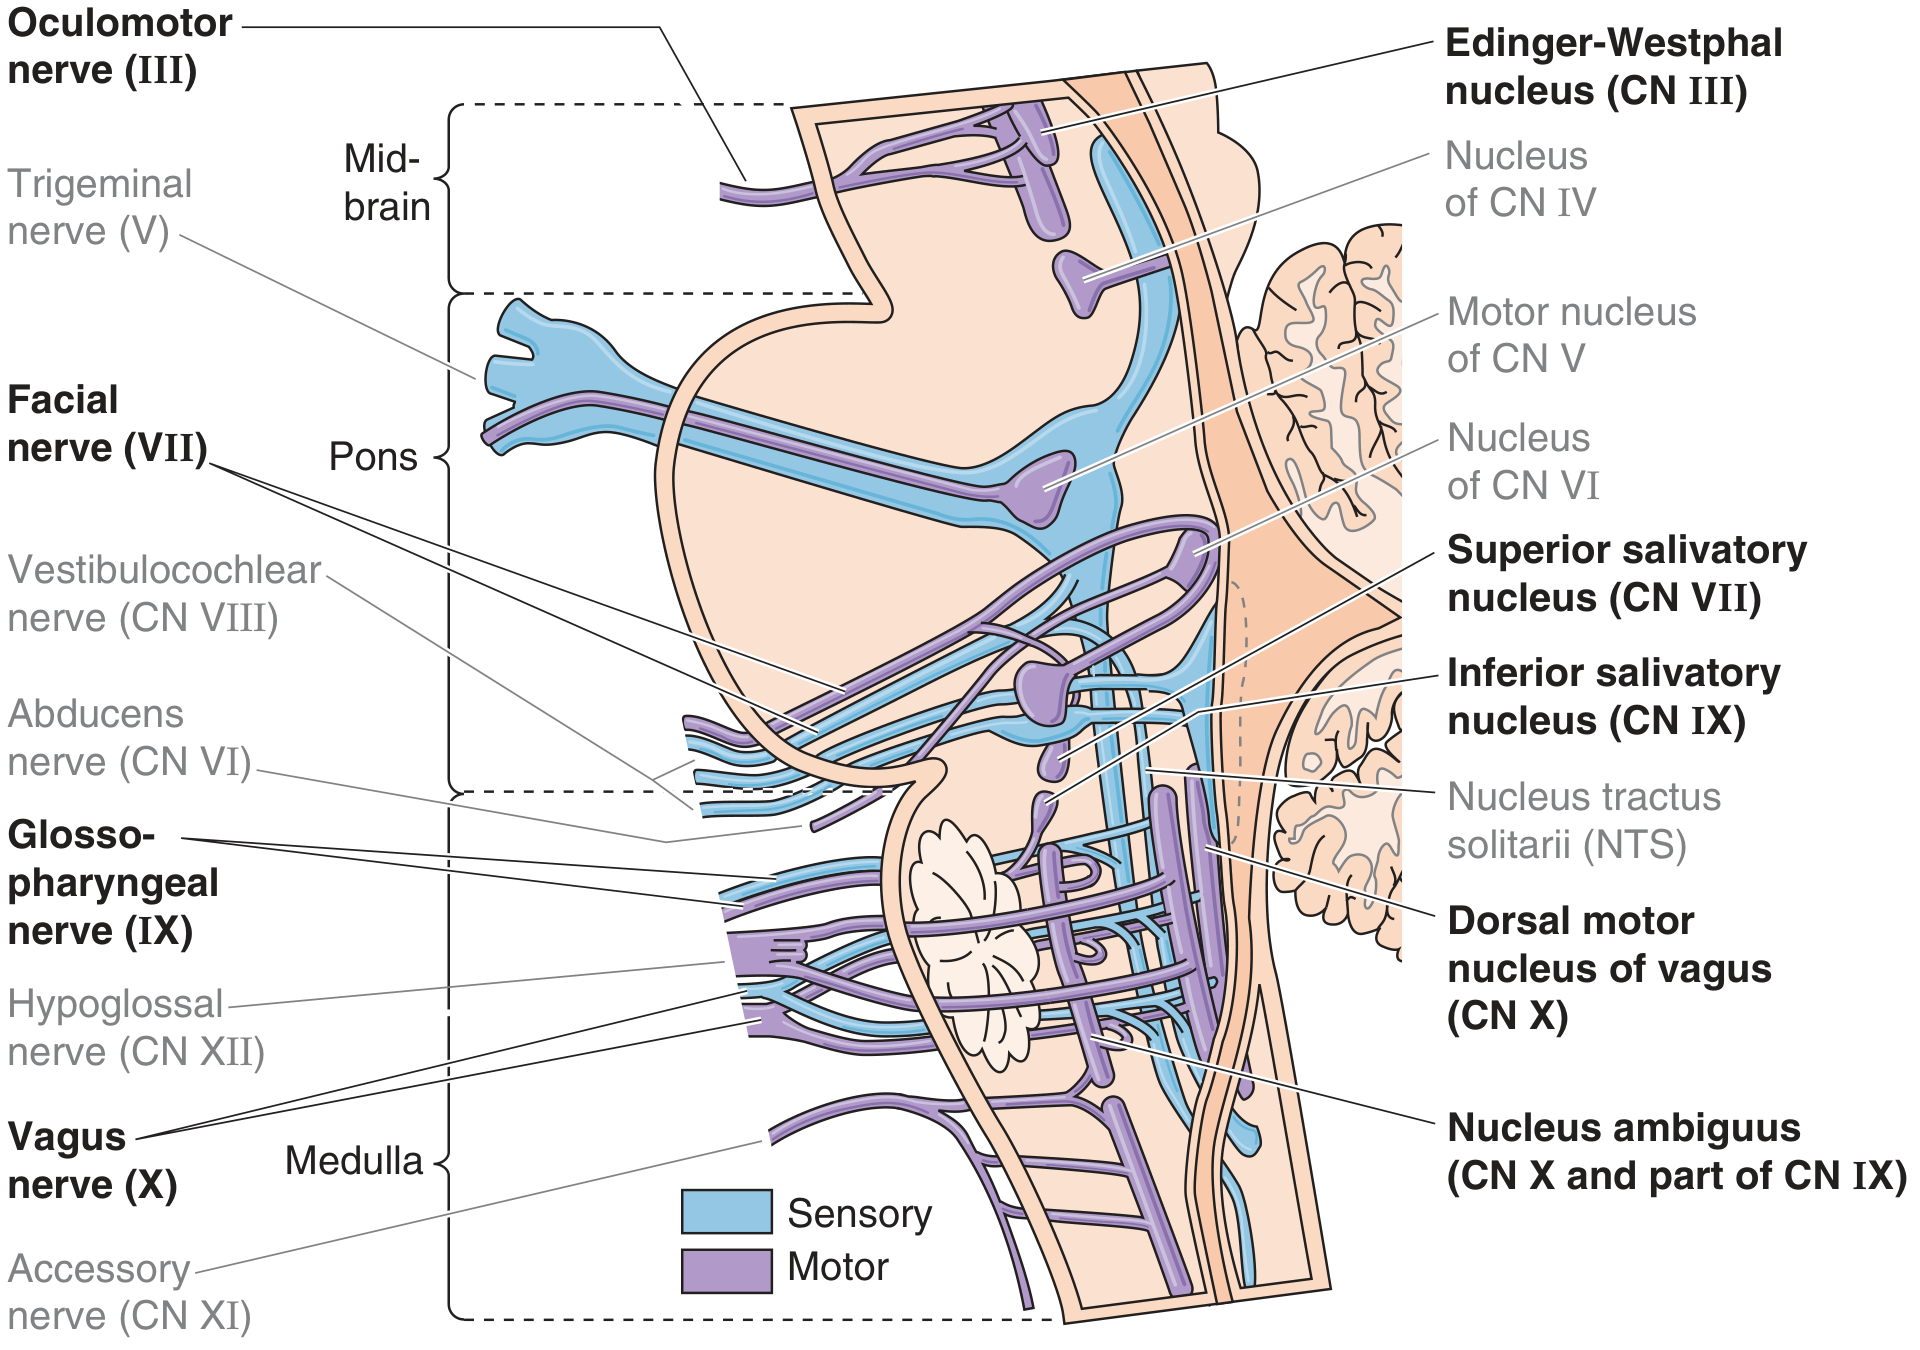
1. Cranial Outflow (Brainstem - CN III, VII, IX, X)
| Nucleus | Cranial Nerve | Ganglion | Target |
|---|---|---|---|
| Edinger-Westphal nucleus (midbrain) | CN III (oculomotor) | Ciliary ganglion | Constrictor pupillae, ciliary muscle (accommodation) |
| Superior salivatory nucleus (pons) | CN VII (facial) | Pterygopalatine ganglion | Lacrimal gland, nasal/palatine mucous glands |
| Superior salivatory nucleus (pons) | CN VII (facial) | Submandibular ganglion | Submandibular and sublingual salivary glands |
| Inferior salivatory nucleus (medulla/pons junction) | CN IX (glossopharyngeal) | Otic ganglion | Parotid salivary gland |
| Dorsal motor nucleus of vagus + Nucleus ambiguus (medulla) | CN X (vagus) | Terminal ganglia in organ walls | Heart, lungs, trachea, esophagus, GI tract (to splenic flexure), liver, pancreas |
2. Sacral Outflow (S2-S4)
- Pelvic viscera (bladder, rectum, uterus, prostate)
- Distal colon (descending colon, sigmoid, rectum)
- Erectile tissue of external genitalia
- Postganglionic neurons lie in the walls of the target organs
Key Properties of Preganglionic Parasympathetic Fibers
| Property | Detail |
|---|---|
| Fiber type | Lightly myelinated (B fibers) |
| Length | Long (ganglia are near or within target organs) |
| Neurotransmitter released | Acetylcholine (ACh) |
| Receptor on postganglionic neuron | Nicotinic (N2) receptors |
| Branching ratio | Low divergence (one preganglionic neuron contacts relatively few postganglionic neurons) - contrast with sympathetic system's high divergence |
Neurotransmitter
Comparison: Cranial vs. Sacral Preganglionic Outflow
| Feature | Cranial (CN III, VII, IX, X) | Sacral (S2-S4) |
|---|---|---|
| Origin | Brainstem nuclei | Lateral horn of S2-S4 spinal cord |
| Nerve | CN III, VII, IX, X | Pelvic splanchnic nerves |
| Ganglia | Discrete named ganglia (ciliary, pterygopalatine, submandibular, otic) or terminal ganglia in organ walls | Terminal ganglia in organ walls |
| Targets | Head, thoracic viscera, most abdominal viscera (to splenic flexure) | Pelvic viscera, descending/sigmoid colon, rectum, erectile tissue |
Special Points
- Vagus nerve (CN X) carries approximately 75% of all parasympathetic preganglionic outflow, making it by far the most important cranial parasympathetic nerve
- In the GI tract, preganglionic fibers from the vagus and pelvic splanchnic nerves often synapse directly onto enteric ganglia (submucosal and myenteric plexuses) rather than distinct named ganglia
- CN III, VII, and IX preganglionic fibers synapse in distinct named ganglia that lie near branches of CN V (trigeminal), and postganglionic fibers hitch a ride along trigeminal branches to reach their targets
- Preganglionic fibers from CN X and S2-S4 synapse in terminal (intramural) ganglia located within or very close to the effector organ wall
- The nucleus ambiguus in the medulla contributes additional preganglionic fibers to CN IX (rostral portion) and CN X (remainder), alongside the dorsal motor nucleus of the vagus

Answer
- pH = 7.36 (low-normal, acidic side)
- PaCO₂ = 60 mmHg (HIGH - above 45)
- HCO₃⁻ = 34 mEq/L (HIGH - above 26)
Step-by-step ABG Interpretation
Expected HCO₃⁻ rise = 3.5 × (PaCO₂ - 40) / 10
For acute respiratory acidosis, the expected rise would only be 1 × per 10 mmHg = +2 mEq/L, giving expected HCO₃⁻ ≈ 26. The HCO₃⁻ of 34 is far too high for acute - ruling out option D.
Answer
Why the other options are wrong:
| Option | Why Wrong |
|---|---|
| A. Metabolic alkalosis with respiratory compensation | pH is on the acidic side (7.36 < 7.40). If metabolic alkalosis were primary, pH would be >7.40 |
| B. Mixed respiratory acidosis and alkalosis | There is no independent metabolic alkalosis here; the elevated HCO₃⁻ is entirely explained by renal compensation for chronic hypercapnia |
| D. Acute respiratory acidosis | In acute respiratory acidosis, HCO₃⁻ rises only ~1 mEq/L per 10 mmHg rise in PaCO₂. With PaCO₂ of 60, expected HCO₃⁻ ≈ 26, not 34 |