
Act as a cardiovascular radiologist with specialisation in cardiac MRI. Explain cardiac MRI basics, uses, imaging findings in various conditions, what extra sequences are required for specific conditions, everything in a structured format. Use professional terms and explain in depth
Continue
cardiac MRI late gadolinium enhancement cardiomyopathy short axis
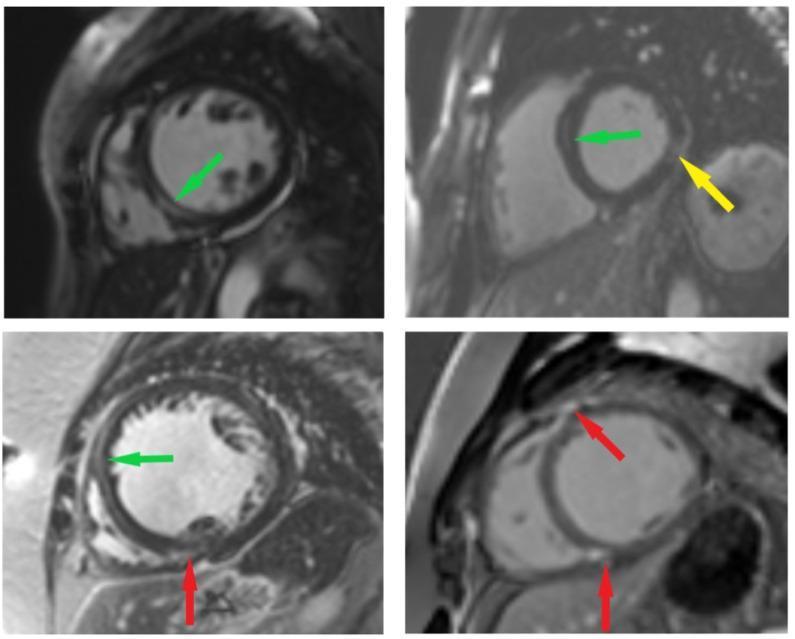
A series of four short-axis cardiac Magnetic Resonance Imaging (MRI) panels demonstrating Late Gadolinium Enhancement (LGE) patterns in patients with non-ischemic dilated cardiomyopathy. These diagnostic images highlight different spatial distributions of myocardial replacement fibrosis. The green arrows indicate a linear mid-wall enhancement pattern, commonly seen in non-ischemic injury. Yellow arrows point to subepicardial enhancement, where high signal intensity is localized to the outer myocardial layer. Red arrows identify RV insertion point enhancement, occurring at the superior and inferior junctions where the right ventricular free wall meets the interventricular septum. Anatomical structures clearly visible include the left ventricle (LV) cavity, the surrounding LV myocardium, and the adjacent right ventricle. These patterns are critical for distinguishing non-ischemic cardiomyopathy from subendocardial ischemic injury and serve as important prognostic indicators for myocardial fibrosis and future cardiac events.
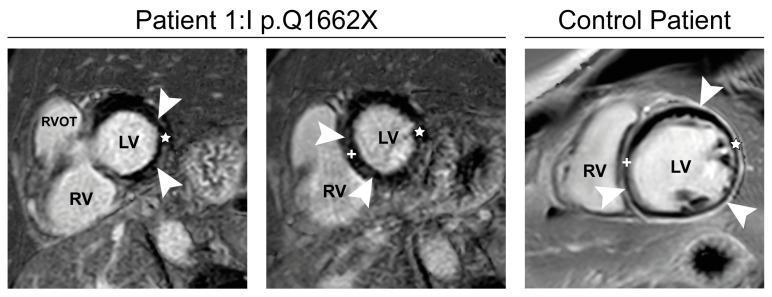
Diagnostic cardiac MRI scans utilizing Phase-sensitive inversion-recovery (PSIR) sequences to demonstrate late gadolinium enhancement (LGE) patterns in FLNC-cardiomyopathy. The image comprises three short-axis views: a basal view (left) and mid-ventricular view (center) of Patient I:1 (p.Q1662X), and a comparison view of a control patient (right). In the Patient I:1 images, white arrowheads indicate focal subepicardial to mid-wall late enhancement localized within the lateral wall (indicated by a star) and the interventricular septum (indicated by a plus sign). Structural landmarks include the left ventricle (LV), right ventricle (RV), and right ventricular outflow tract (RVOT). In contrast, the control patient (right) shows more diffuse, extensive late enhancement throughout the myocardium, involving larger portions of the left ventricular circumference. This imaging modality and pattern are used to identify myocardial fibrosis or replacement, which is a hallmark finding in filamin-C (FLNC) related cardiomyopathies and differentiates it from standard ischemic patterns.
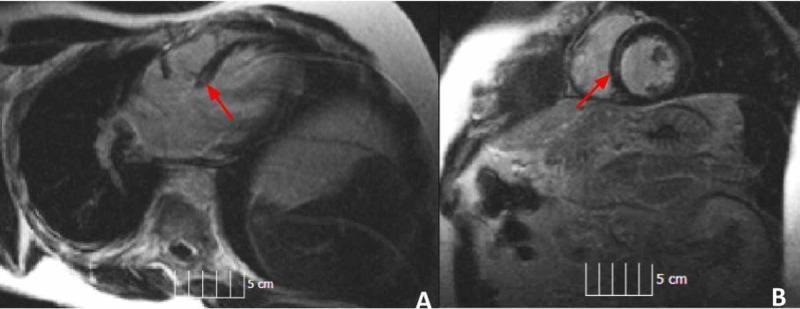
Cardiac Magnetic Resonance Imaging (MRI) demonstrating Late Gadolinium Enhancement (LGE) indicative of myocardial fibrosis or sarcoidosis. The image is divided into two panels: Panel A displays a horizontal long-axis (four-chamber) view of the heart, while Panel B shows a short-axis view at the basal-mid ventricular level. In both views, red arrows point to areas of linear, mid-myocardial hyperintensity (increased signal) located within the interventricular septum, specifically in the anterior basilar region. This pattern is characteristic of non-ischemic cardiomyopathy. The left ventricle in Panel B appears relatively circular with uniform wall thickness, while Panel A shows the relationship between the atria and ventricles. Each panel includes a 5 cm scale bar for anatomical dimensioning. The diagnostic focus is on identifying mid-wall delayed enhancement, which is a critical finding for assessing myocardial tissue characterization and infiltrative diseases like cardiac sarcoidosis.
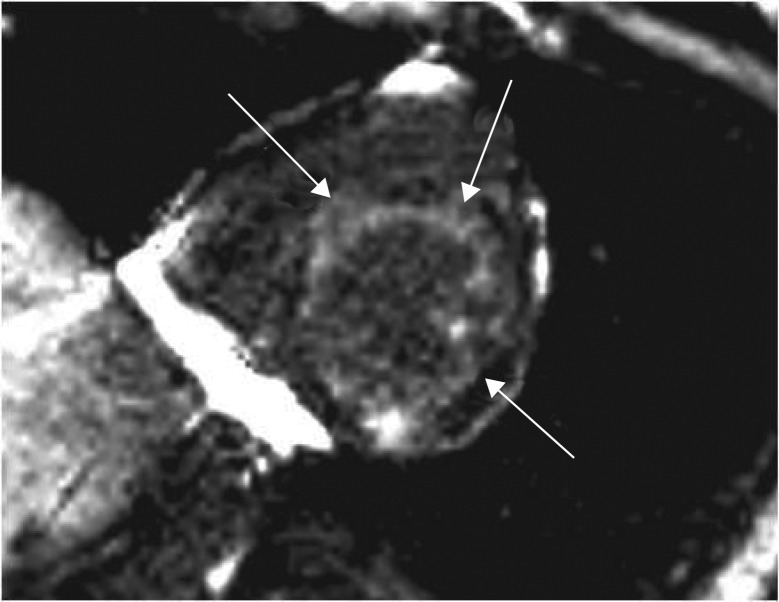
**Modality:** Cardiac Magnetic Resonance Imaging (CMR) **Sequence:** Late Gadolinium Enhancement (LGE), Short-Axis View **Anatomy:** Mid-ventricular short-axis cross-section of the left ventricle (LV). **Observations:** The image demonstrates a circumferential pattern of hyperintensity within the left ventricular myocardium. This Late Gadolinium Enhancement (LGE) is primarily subendocardial in distribution, appearing as a patchy, bright signal involving the anterior, septal, inferior, and lateral segments. In several areas, the enhancement extends beyond the subendocardium into the mid-myocardium. The right ventricle is partially visualized adjacent to the interventricular septum. **Pathological Features:** The non-coronary, circumferential subendocardial enhancement pattern is characteristic of systemic infiltrative or inflammatory processes, such as cardiac amyloidosis or systemic sclerosis, rather than a single-vessel territory myocardial infarction. The presence of these findings indicates replacement fibrosis or expansion of the extracellular space within the myocardial wall. **Key Search Terms:** Cardiac MRI, Late Gadolinium Enhancement (LGE), subendocardial enhancement, circumferential myocardial fibrosis, short-axis view, infiltrative cardiomyopathy.
cardiac MRI cine SSFP four chamber view anatomy
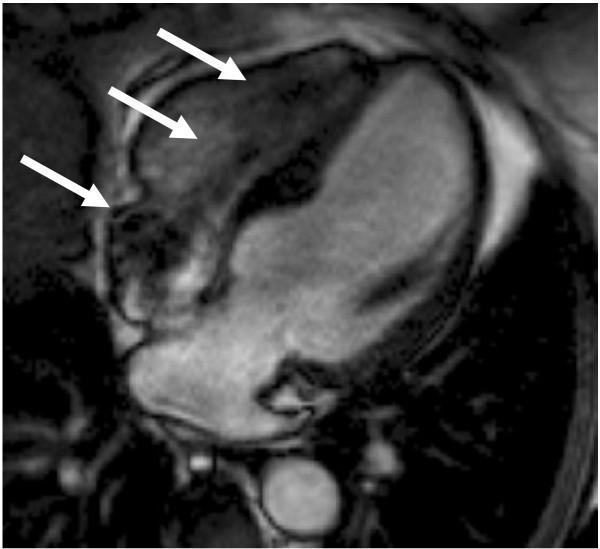
This diagnostic image is a steady-state free precession (SSFP) cine cardiac MRI in a four-chamber horizontal long-axis view. The image clearly depicts the internal anatomy of the heart, including the left and right atria, left and right ventricles, and the interventricular septum. A prominent feature of the image is the presence of metal-induced susceptibility artifacts, indicated by white arrows. These artifacts appear as localized regions of signal void and peripheral distortion along the right heart border, corresponding to the positioning of implanted dual-chamber pacemaker leads. This image serves as an educational example of how metallic implants impact cardiac MRI signal quality, specifically illustrating the 'blooming' effect that can obscure myocardial and blood pool detail in patients with MRI-conditional cardiovascular electronic devices (CIEDs).
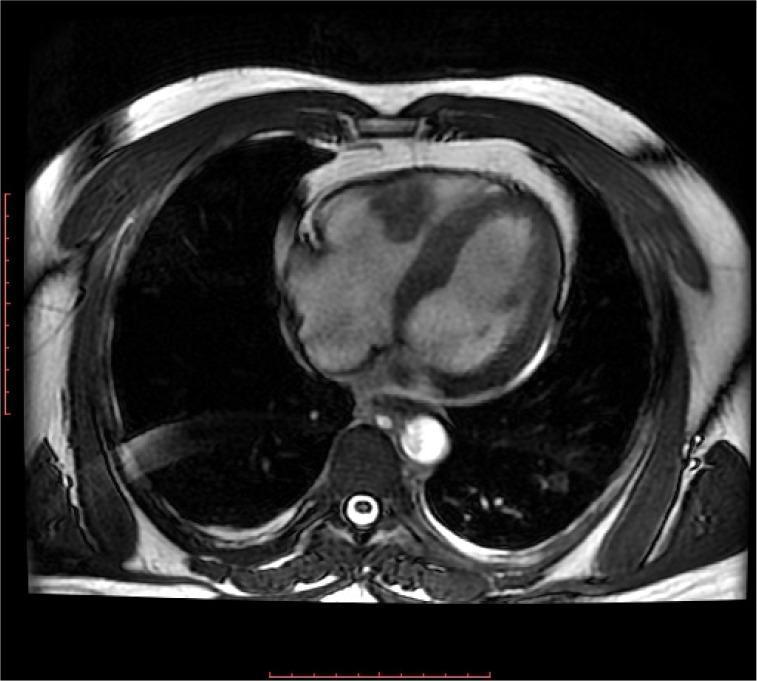
This diagnostic image is a steady-state free precession (SSFP) cardiac magnetic resonance imaging (MRI) in a four-chamber cine view. The image shows the thoracic cross-section with a clear view of the heart's anatomy. The right ventricle (RV) exhibits significant pathology characterized by apical obliteration and a heterogeneous, mass-like structure protruding into the RV cavity from the free wall. This mass is located near the apex and appears to occupy a portion of the right ventricular lumen. Additionally, a circumferential pericardial effusion is visible as a hypointense band surrounding the cardiac silhouette within the pericardial sac. Surrounding anatomical structures including the descending aorta, spinal canal, and pulmonary parenchyma are also captured in this axial-plane representation. The image serves as an educational example of cardiac masses and associated pericardial changes, demonstrating the utility of MRI in evaluating right ventricular morphology and identifying space-occupying lesions in the heart.
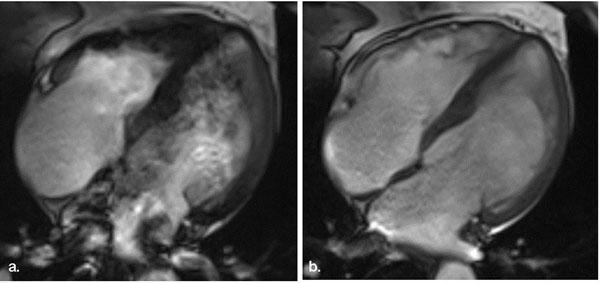
This Comparison Chart displays two diagnostic images (a and b) from a Cardiac Magnetic Resonance (CMR) study. Both images show a four-chamber view of the heart using a Steady-State Free Precession (SSFP) cine sequence. The comparison illustrates the impact of 'off-resonance artifacts,' which are common in high-field strength MRI (3.0T). Image (a) demonstrates significant signal distortion and heterogeneity within the left and right ventricles and atria, resulting in blurred endocardial borders and obscured valvular anatomy. Image (b) shows the result of frequency offset adjustment (+50Hz), which effectively minimizes the off-resonance artifact. This technical correction restores signal uniformity and enhances the clarity of anatomical structures, including the interventricular septum, atrial walls, and ventricular chambers. The educational focus is on MRI physics and artifact management, specifically teaching how to optimize SSFP sequences for clearer diagnostic imaging of cardiac morphology and function.
cardiac MRI myocarditis T2 STIR subepicardial enhancement
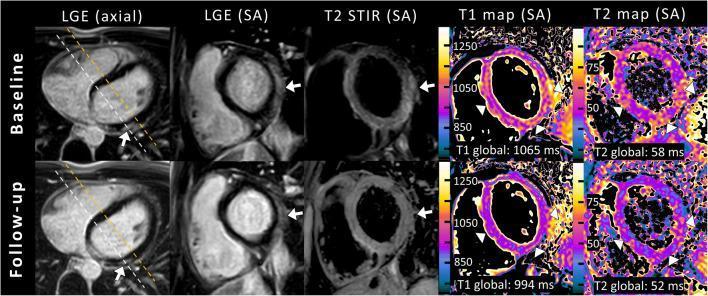
A multi-panel cardiac magnetic resonance imaging (MRI) study demonstrating acute myocarditis at baseline and follow-up (2 months) in a pediatric patient. The top row (baseline) shows subepicardial late gadolinium enhancement (LGE) in the basal lateral wall across axial and short-axis (SA) views, along with focal myocardial edema indicated by hyperintensity on T2 STIR (arrows). Quantitative T1 and T2 mapping displays elevated global relaxation times (T1: 1065 ms; T2: 58 ms) with arrowheads highlighting diffuse alterations in the septal and inferior walls. The bottom row (follow-up) illustrates clinical recovery: LGE intensity in the basal lateral wall is significantly reduced, T2 STIR signal has normalized indicating resolution of focal edema, and quantitative mapping shows a decrease in T1 (994 ms) and T2 (52 ms) values back to normal ranges. This comparison highlights the diagnostic value of both qualitative LGE/T2 STIR imaging and quantitative mapping according to the 2018 Lake Louise criteria for monitoring myocarditis progression and recovery.
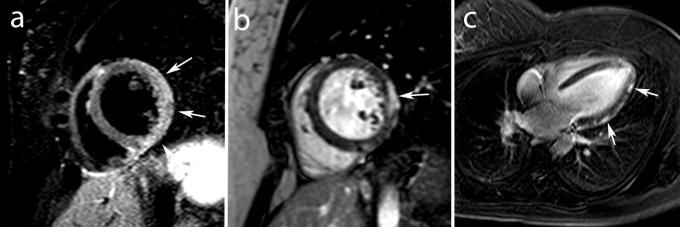
Diagnostic cardiac MRI study illustrating findings consistent with acute myocarditis in a young adult. Panel A presents a mid-ventricular short-axis view using T2-weighted Short Tau Inversion Recovery (STIR) imaging, which demonstrates high signal intensity (hyperintensity) in the lateral myocardium, indicated by arrows, representing myocardial edema. Panel B shows a contrast-enhanced (ce-MRI) mid-ventricular short-axis view, and Panel C shows a vertical long-axis view. Both contrast-enhanced images reveal characteristic late gadolinium enhancement (LGE) with a subepicardial distribution along the lateral wall (white arrows). The absence of subendocardial involvement helps differentiate this inflammatory pattern from ischemic injury. These imaging hallmarks—edema on T2-weighted sequences and subepicardial LGE—are critical diagnostic criteria for myocarditis in the clinical context of acute chest pain.
cardiac amyloidosis MRI diffuse subendocardial late gadolinium enhancement
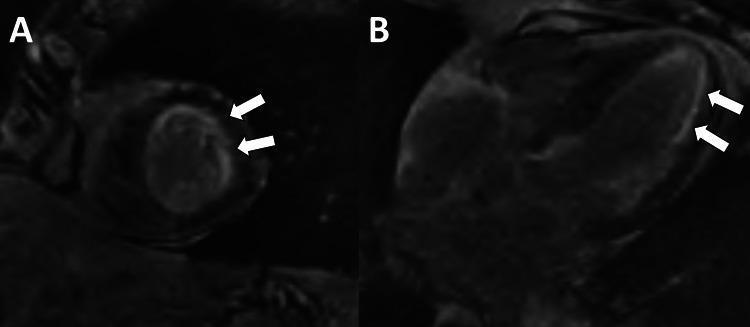
Two-panel cardiac magnetic resonance imaging (MRI) demonstrating late gadolinium enhancement (LGE) patterns characteristic of cardiac amyloidosis. Image A presents a short-axis view of the left ventricle, where white arrows highlight a diffuse, hyperintense white stripe along the subendocardial layer of the anterolateral wall. Image B shows a four-chamber view, further illustrating this diffuse subendocardial LGE pattern within the ventricular walls. The enhancement represents abnormal gadolinium kinetics and extracellular space expansion typical of infiltrative cardiomyopathies. Key educational findings include the non-ischemic, subendocardial distribution of the enhancement and its diffuse nature, which are critical diagnostic markers for identifying systemic AL amyloidosis with cardiac involvement in clinical cardiology and radiology.
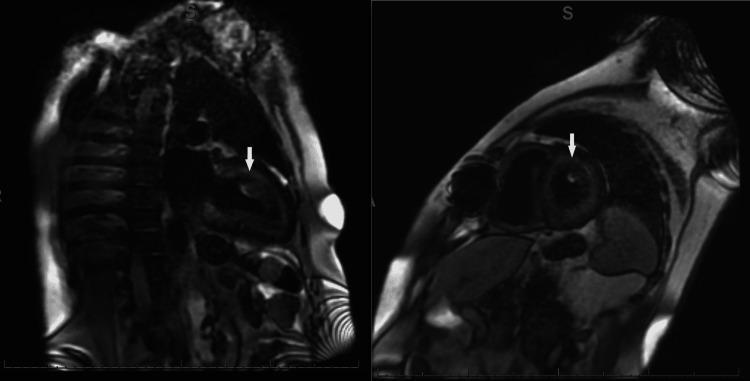
Diagnostic Imaging: Gadolinium-enhanced cardiac MRI (late gadolinium enhancement - LGE) presenting two views of the heart: a long-axis view (left) and a short-axis cross-section (right). The images demonstrate a hallmark diagnostic pattern of cardiac amyloidosis. Specifically, there is diffuse, heterogeneous, and circumferential subendocardial enhancement involving the entire left ventricle. White arrows highlight areas where this pathological enhancement extends significantly into the myocardium, occupying at least 50% of the myocardial thickness. This pattern is indicative of extensive infiltrative cardiomyopathy, most commonly associated with AL (light chain) amyloidosis. The visualization emphasizes the loss of the normal myocardial nulling and the presence of transmural extension of the amyloid deposits within the left ventricular wall.
Cardiac MRI (CMR): A Comprehensive Reference for the Cardiovascular Radiologist
SECTION 1: FUNDAMENTALS OF CARDIAC MRI
1.1 Why Cardiac MRI?
- True 3D volumetric data for LV/RV ejection fraction, volumes, and mass
- Tissue characterization via T1 mapping, T2 mapping, T2* mapping, and Late Gadolinium Enhancement (LGE)
- Flow quantification via phase-contrast velocity encoding
- Perfusion imaging with first-pass gadolinium kinetics
- Myocardial stress testing via dobutamine or vasodilator pharmacological stress
1.2 Core CMR Sequences - The Radiologist's Toolkit
A. Cine Imaging - SSFP (Steady-State Free Precession)
- Also known as: TrueFISP (Siemens), FIESTA (GE), BFFE (Philips)
- Principle: Exploits the T2/T1 ratio of tissues. Blood pool appears bright (high T2/T1), myocardium appears intermediate gray - creating excellent blood-myocardium contrast without contrast agent
- Clinical use: The cornerstone sequence. Used for biventricular function, EF, volumes, wall motion analysis, valve assessment, and morphology
- ECG-gating: Retrospective ECG gating is standard; allows reconstruction of the complete cardiac cycle
- Standard planes acquired:
- 2-chamber (vertical long axis)
- 4-chamber (horizontal long axis)
- 3-chamber (left ventricular outflow tract, LVOT)
- Short-axis stack (base to apex, typically 10-12 slices)
- Artifacts: Dark banding artifacts (off-resonance artifact) - correctable with frequency adjustment. Susceptibility artifacts from metallic implants
B. Black-Blood Sequences (Dark Blood)
- Technique: Double inversion recovery (DIR) fast spin-echo (FSE/TSE). Two radiofrequency pulses null the blood pool signal - blood appears dark, myocardium and vessel wall appear bright
- T1-weighted black-blood: Best for morphology, fat (appears bright), hemorrhage (subacute - bright), fibrosis
- T2-weighted STIR (Short Tau Inversion Recovery): Fat suppressed T2. Edema and inflammation appear hyperintense (bright). Critical for myocarditis, acute MI, and cardiac masses
- Applications: Pericardial thickness, intracardiac masses, vessel wall imaging, myocardial edema
C. Late Gadolinium Enhancement (LGE)
- Principle: Gadolinium-based contrast agent (GBCA) distributes into the extracellular space. Normal myocardium with intact cell membranes has a small extracellular volume (ECV ~25%). In necrotic or fibrotic tissue, cell membranes rupture or collagen replaces cells - ECV expands dramatically. Gadolinium accumulates here and washes out slowly
- Technique: Phase-sensitive inversion recovery (PSIR) or magnitude IR sequence, acquired 10-15 minutes post-contrast. The inversion time (TI) is set to null normal myocardium (myocardium appears black); fibrosis/necrosis appears bright white
- TI scout: A TI-scout sequence (Look-Locker) is run first to identify the optimal TI (~240-300 ms typically, but varies with time post-injection, renal function, heart rate)
- Planes: Short axis stack + two- and four-chamber long axis views
- Patterns of LGE and their diagnostic significance (detailed below)
D. T1 Mapping and Extracellular Volume (ECV) Quantification
- Native T1 mapping: Quantifies myocardial T1 relaxation time without contrast. Uses Modified Look-Locker Inversion Recovery (MOLLI) or ShMOLLI sequences. Elevated native T1 = edema, inflammation, fibrosis, infiltration
- Post-contrast T1 mapping: T1 shortens after gadolinium. Combined with native T1 and hematocrit:
- ECV = (1 - hematocrit) × (ΔR1 myocardium / ΔR1 blood)
- Normal ECV ~25%; elevated ECV indicates expanded extracellular space
- Clinical use: Amyloidosis (markedly elevated ECV), myocarditis, diffuse fibrosis in cardiomyopathies, monitoring treatment response
E. T2 Mapping
- Quantitative T2 relaxation time without the confounders of T2-STIR (signal normalization, heterogeneity). Normal myocardial T2 ~50 ms
- Elevated T2 = myocardial edema (acute MI, myocarditis, transplant rejection)
- Advantages over T2-STIR: No reference tissue needed, more reproducible, captures diffuse edema
F. T2* Mapping (Myocardial Iron Quantification)
- Based on gradient-echo multi-echo technique
- T2 is shortened by iron*: Ferromagnetic iron deposits act as local field inhomogeneities accelerating T2* decay
- T2 <20 ms* = iron overload; T2 <10 ms* = severe iron overload with high arrhythmia risk
- Primary indication: Thalassemia major, hemochromatosis, sideroblastic anemia, repeated transfusions
- Liver T2* is acquired simultaneously for comparison
G. Phase-Contrast (PC) Flow Imaging / Velocity Encoding (VENC)
- Principle: Spins moving through a bipolar gradient accumulate phase proportional to velocity. Phase difference maps encode velocity
- VENC setting: Set slightly above peak expected velocity to avoid aliasing
- Applications:
- Aortic/pulmonary flow quantification (forward and regurgitant volumes, regurgitant fraction)
- Shunt quantification (Qp:Qs ratio) - pulmonary-to-systemic flow ratio in ASD, VSD
- Stenotic jet velocity measurement
- 4D flow: Time-resolved 3D PC imaging of the great vessels
H. First-Pass Perfusion Imaging
- Technique: Fast spoiled gradient-echo or EPI sequence acquired during bolus injection of GBCA (0.05-0.1 mmol/kg). Images acquired at 3 standard short-axis levels (basal, mid, apical) every cardiac cycle
- Rest perfusion: Detects severe resting ischemia, subendocardial hypoperfusion
- Stress perfusion: Vasodilator stress (adenosine at 140 µg/kg/min, or regadenoson) - coronary hyperemia unmasks relative perfusion defects in territory of stenosed coronary arteries
- Visual analysis: Dark subendocardial rim at peak enhancement = inducible perfusion defect
- Quantitative perfusion: Myocardial blood flow (mL/g/min) can be calculated using signal-time curves
I. Stress Cine (Dobutamine CMR)
- Dobutamine infused at 10-40 µg/kg/min with atropine if needed
- Assessment: New wall motion abnormalities (hypokinesia, akinesia) at stress = inducible ischemia
- Superior specificity compared with dobutamine echo in technically challenging windows
- Also used to assess contractile reserve in low-flow low-gradient aortic stenosis
J. Coronary MRA (Non-invasive)
- Navigator-gated, free-breathing, whole-heart coronary MRA
- Limited spatial resolution compared to CTA
- Used primarily for anomalous coronary artery course (avoids radiation), coronary aneurysms in Kawasaki disease
1.3 Standard CMR Protocol
| Step | Sequence | Purpose |
|---|---|---|
| 1 | Scout / Localizer | Cardiac orientation |
| 2 | Axial/coronal SSFP or bSSFP stack | Morphology, great vessels |
| 3 | Cine SSFP - 2C, 4C, 3C, SAx stack | Biventricular function, volumes |
| 4 | Black-blood T2-STIR SAx | Edema/inflammation screen |
| 5 | Native T1 mapping (MOLLI) | Tissue characterization pre-contrast |
| 6 | T2 mapping | Quantitative edema |
| 7 | First-pass perfusion (if stress protocol) | Inducible ischemia |
| 8 | GBCA injection | 0.1-0.2 mmol/kg gadolinium |
| 9 | Early enhancement (1-2 min) | Hyperemia, pericarditis |
| 10 | Post-contrast T1 mapping (MOLLI) | ECV calculation |
| 11 | LGE - SAx stack + LAx | Fibrosis, necrosis, infiltration |
| 12 | Phase-contrast at aortic valve | Flow quantification |
SECTION 2: STANDARD CARDIAC ANATOMY ON CMR
2.1 Planes and Structures
SECTION 3: CMR IN SPECIFIC CARDIAC CONDITIONS
3.1 Ischemic Heart Disease
Acute Myocardial Infarction
- Transmural extent of LGE predicts functional recovery: <25% transmural = high likelihood of recovery; >75% transmural = unlikely to recover even after revascularization
- Microvascular obstruction (MVO): Dark core within the enhancing territory on LGE images (also called "no-reflow"). Represents zones of hemorrhagic necrosis with impaired gadolinium delivery. On T2*, it appears hypointense due to iron from degraded hemoglobin. MVO on LGE is an adverse prognostic marker
Chronic MI / Hibernating Myocardium
- LGE <50% transmural + wall motion abnormality = hibernating/stunned myocardium (viable - likely to recover with revascularization)
- LGE >50% transmural = transmural scar (non-viable)
- Fat deposition within old LGE territory (bright on T1, suppressed on STIR) = chronic lipomatous metaplasia of scar
3.2 Cardiomyopathies
3.2.1 Hypertrophic Cardiomyopathy (HCM)
- LV hypertrophy - asymmetric septal hypertrophy (ASH) most common. CMR precisely measures maximum wall thickness in all segments (more accurate than echo, especially for lateral wall, apex)
- Apical HCM (Yamaguchi variant): Apical cavity obliteration, "ace of spades" configuration on 4-chamber cine at end-diastole
- Systolic anterior motion (SAM) of the anterior mitral leaflet - visible on 3-chamber cine
- LVOT obstruction: turbulent jet (signal void) in LVOT on cine
- Pattern: Mid-wall / intramural hyperintensity, predominantly at the RV insertion points (anterior and inferior septum-RV junction), also in hypertrophied segments. Characteristically spares the subendocardium (distinguishing from ischemic pattern)
- Extent of LGE correlates with arrhythmia risk and SCD risk - used for ICD risk stratification
- Diffuse or large-foci intramural LGE = fibrosis
3.2.2 Dilated Cardiomyopathy (DCM)
- Global LV (and often RV) dilatation
- Reduced LVEF, global hypokinesia
- Spherical LV remodeling
- Functional mitral regurgitation jet (signal void into LA)
- Non-ischemic DCM: LGE absent (most common, ~60%) OR faint mid-wall / mesocardial enhancement in the interventricular septum (stripe pattern). Subendocardium is spared - this distinguishes it from ischemic DCM
- Ischemic DCM: Subendocardial or transmural LGE in a coronary territory distribution
- The presence of any LGE in DCM independently predicts SCD and adverse events (18% SCD rate with LGE vs 2% without, over 4.6 years follow-up) - Braunwald's Heart Disease
3.2.3 Arrhythmogenic Cardiomyopathy (ACM / ARVC)
- RV dilatation (RVEDV index ≥110 mL/m² men, ≥100 mL/m² women per Task Force Criteria)
- Reduced RVEF (<40% major, 40-45% minor)
- Regional RV wall motion abnormalities: dyskinesia/akinesia of RVOT, RV apex, or subtricuspid region (the "triangle of dysplasia")
- LV involvement in biventricular ACM
- RV free wall fibrofatty replacement: Thin, hyperenhancing RV free wall, most prominent in RVOT
- LV involvement: Mid-wall LGE in the inferolateral wall in left-dominant or biventricular ACM
3.2.4 Cardiac Amyloidosis
- Concentrically thickened LV walls (can mimic HCM)
- Biatrial dilatation
- Diastolic dysfunction pattern
- Granular sparkling appearance on echo; less specific on CMR
- Diffuse subendocardial enhancement in a non-coronary distribution, affecting all segments globally - the classic "zebra striping" pattern
- In advanced disease, transmural enhancement
- Abnormal gadolinium kinetics: Blood pool and myocardium both null abnormally - difficult to set an appropriate TI. The "inverted" LGE appearance (where the blood pool nulls before the myocardium) is a diagnostic hallmark
- ECV is markedly elevated (often >40-50%, normal ~25%)
3.2.5 Cardiac Sarcoidosis
- Variable - can be normal or show regional/global LV dysfunction
- Wall thinning in areas of granulomatous replacement
- Aneurysmal dilatation in burnt-out disease
- Focal or patchy mid-wall (intramural) enhancement - most common in the basal and mid-interventricular septum and basal inferolateral wall
- Enhancement does not follow a coronary territory
- Can also show subepicardial enhancement, mimicking myocarditis
- Perilesional transmural extension possible
3.3 Myocarditis
Lake Louise Criteria (2018 Updated CMR Criteria)
- LGE in a non-ischemic pattern: typically subepicardial or mid-wall distribution, most commonly lateral wall, inferior wall, or septal involvement. The subendocardium is characteristically spared (key differentiator from MI)
- Elevated native T1 (globally or regionally above vendor/center normal values)
- Elevated ECV
- Regional or global T2 signal increase on T2-STIR (T2 ratio myocardium/skeletal muscle >1.9)
- Elevated regional T2 on T2 mapping (>59 ms at 1.5T)
- Acute: Subepicardial LGE + T2 hyperintensity (edema) in the same region - lateral wall most common
- Chronic: LGE without edema, often mesocardial/septal - associated with new-onset arrhythmias. Septal LGE is the most arrhythmogenic substrate
3.4 Pericardial Disease
Pericardial Effusion
Pericarditis / Myopericarditis
- Pericardial enhancement: the inflamed, vascular pericardium enhances avidly on early post-contrast imaging (delayed gadolinium with shorter TI, or dedicated early enhancement sequences)
- Pericardial enhancement on LGE correlates with active inflammation and predicts response to anti-inflammatory therapy
- Enhancement extending into subepicardial myocardium = myopericarditis
Constrictive Pericarditis
- Pericardial thickening >4 mm (normal <2 mm) - but constriction can occur with normal thickness in up to 20% cases
- Black-blood sequences: Low T1 and T2 signal in fibrous/calcified pericardium (note: CMR cannot detect calcification as reliably as CT - CT is preferred for calcification assessment)
- Pericardial adhesions may be seen
- Septal bounce / interventricular dependence: On cine imaging, paradoxical septal motion - the interventricular septum flattens or shifts leftward during inspiration as RV filling increases at the expense of LV filling. This exaggerated septal motion is the MRI equivalent of the echocardiographic "septal bounce"
- Dilated IVC and hepatic veins
- Flat diaphragmatic descent pattern
3.5 Valvular Heart Disease
Aortic Regurgitation
- Cine SSFP: Signal void (flow turbulence) jet extending from the aortic valve into the LV during diastole. LV dilatation (volume overload pattern)
- Phase-contrast at the aortic valve: Quantifies regurgitant volume (mL/beat) and regurgitant fraction (%). Gold standard method for AR quantification when echo is discordant
- LGE: Mid-wall fibrosis in LV may indicate advanced disease with irreversible myocardial injury
Aortic Stenosis
- Cine SSFP: Thickened, restricted aortic leaflets. Systolic signal void jet through the stenotic orifice (jet size correlates with severity). LV hypertrophy (concentric)
- Planimetry of aortic valve area (AVA): Using cine or phase-contrast - provides "anatomical orifice area (AOA)"
- Phase-contrast: Measures peak systolic velocity for gradient estimation
- LGE / T1 mapping: Myocardial fibrosis assessment in AS is a major emerging indication - mid-wall fibrosis predicts worse outcomes post-TAVI/SAVR. ECV elevation even before LVEF reduction
Mitral Regurgitation
- Cine: Signal void jet into the LA during systole. Eccentric jets harder to grade than central
- Phase-contrast: Indirect calculation of regurgitant volume = LV stroke volume - aortic forward flow
- LGE: Fibrosis patterns in myxomatous/ischemic MR
Mitral Stenosis
- Cine: Thickened, restricted mitral leaflets, reduced mitral valve area (planimetry), diastolic jet signal void. LA dilatation
- Phase-contrast: Mean transmitral gradient
3.6 Iron Overload Cardiomyopathy
- T2* >20 ms: Normal cardiac iron
- T2* 10-20 ms: Mild-moderate iron overload
- T2* <10 ms: Severe iron overload - high risk of LV dysfunction and arrhythmia
- T2* <6 ms: Critical - imminent heart failure
3.7 Cardiac Masses and Tumors
Tissue characterization sequences:
| Sequence | Benign clue | Malignant clue |
|---|---|---|
| T1-weighted | Fat = bright (lipoma, liposarcoma) | Low-intermediate signal |
| T2-STIR | Cysts, myxomas = very bright | Heterogeneous |
| LGE | Peripheral enhancement (cyst) | Heterogeneous, central necrosis |
| Perfusion | Benign: variable | Malignant: early, heterogeneous wash-in |
| Cine | Pedunculated, mobile mass | Infiltrative, immobile |
- Myxoma: T1 intermediate, T2 bright, heterogeneous LGE; pedunculated from fossa ovalis; mobile
- Lipoma: T1 bright, T2 moderate; signal drops on fat saturation; no LGE
- Fibroelastoma: Usually valve-associated; small; T2 intermediate
- Rhabdomyoma: Neonates; T1 iso, T2 bright; multiple; associated with tuberous sclerosis
- Angiosarcoma: RA most common. T1 intermediate with areas of high signal (hemorrhage). T2 heterogeneous. Avid, heterogeneous LGE. Pericardial invasion
- Rhabdomyosarcoma: Any age, any chamber. T1 iso, T2 high. Aggressive LGE
- Metastases: History of primary tumor. Multiple lesions. Pericardial effusion common
3.8 Congenital Heart Disease (CHD)
- Cine: Direct visualization of shunt flow (signal void through defect)
- Phase-contrast Qp:Qs >1.5 = significant shunt
- RV volume overload (dilated RV on SAx)
- Phase-contrast Qp:Qs ratio
- LV volume overload
- Primary indication for repeat CMR
- RVEF and RVEDV indexed - determines timing of pulmonary valve replacement
- Pulmonary regurgitation quantification (phase-contrast)
- RVOT aneurysm assessment
- Residual VSD
3.9 Aortic Disease
- Aortic root dimensions, ascending aorta, arch, descending aorta
- Aortic dissection: True vs. false lumen (cine shows differential flow); intimal flap
- Aortic wall hematoma: T1 hyperintense crescentic wall thickening (no dissection flap)
- Penetrating aortic ulcer
3.10 Takotsubo Syndrome (Stress Cardiomyopathy)
SECTION 4: LGE PATTERN SUMMARY - QUICK REFERENCE
| Pattern | Location | Condition |
|---|---|---|
| Subendocardial, coronary territory | Endo to transmural | Myocardial infarction (ischemic) |
| Subendocardial, non-coronary, diffuse circumferential | Endo to transmural, global | Cardiac amyloidosis |
| Mid-wall / mesocardial linear | IVS stripe | Dilated cardiomyopathy, sarcoidosis |
| Intramural, RV insertion points | IVS junctions | HCM, pulmonary hypertension |
| Subepicardial / mid-wall, lateral | Endo spared | Myocarditis |
| Patchy, basal septum + inferolateral | Non-coronary, focal | Cardiac sarcoidosis |
| Absent LGE despite WMA | - | Takotsubo, stunned/hibernating myocardium |
| Pericardial enhancement | Pericardium | Acute pericarditis, myopericarditis |
| Diffuse heterogeneous LGE | Any | Malignant tumor |
SECTION 5: CONTRAINDICATIONS AND SAFETY
- Non-MRI-conditional pacemakers/ICDs (though many modern devices are now MRI-conditional at 1.5T)
- Cochlear implants (most; check manufacturer)
- Certain intracranial aneurysm clips
- Metallic foreign bodies in or near the eye
- Severe claustrophobia
- Inability to breath-hold (degrades image quality; free-breathing navigator sequences available)
- Renal impairment (eGFR <30 mL/min): gadolinium risk of Nephrogenic Systemic Fibrosis (NSF) with older Group 1 agents; modern macrocyclic agents (gadobutrol, gadoteridol) have excellent safety profiles
- Pregnancy: avoid gadolinium in first trimester unless absolutely necessary
- Macrocyclic chelates (gadobutrol, gadoterate) are preferred for cardiac imaging due to superior thermodynamic stability
- Group 1 linear agents (gadodiamide, gadopentetate) are associated with gadolinium deposition in brain and bone - avoid where possible
SECTION 6: QUANTITATIVE REFERENCE VALUES
| Parameter | Normal Value |
|---|---|
| LV EF | >55% (men), >54% (women) |
| LV EDV index | 75-100 mL/m² (men), 62-88 mL/m² (women) |
| LV wall thickness (end-diastole) | 6-12 mm |
| RV EF | >45% |
| RV EDV index | <110 mL/m² (men), <100 mL/m² (women) |
| LV mass index | <85 g/m² (women), <102 g/m² (men) |
| Native T1 (1.5T) | ~970 ms |
| Native T2 (1.5T) | ~50 ms |
| ECV | 25 ± 3% |
| T2* (cardiac iron, 1.5T) | >20 ms = normal |
| Pericardial thickness | <2 mm normal; >4 mm = thickened |
SECTION 7: CONDITION-SPECIFIC ADDITIONAL SEQUENCES SUMMARY
| Condition | Standard Protocol + | Extra Sequences Required |
|---|---|---|
| Acute MI / Viability | LGE (mandatory) | T2-STIR (area at risk), T2* (MVO/hemorrhage), stress perfusion |
| HCM | LGE | T2-STIR, LVOT phase-contrast, 4D flow, T1/ECV mapping |
| DCM | LGE, T1/ECV | Stress perfusion (exclude ischemia), phase-contrast |
| ARVC | Axial SSFP cine | Fat-suppression T1-w, dedicated RV cines, T2-STIR |
| Amyloidosis | LGE, T1 mapping, ECV | TI scout (abnormal kinetics), post-contrast T1 mapping |
| Myocarditis | LGE + T2-STIR | T1 mapping, T2 mapping, ECV, early pericardial enhancement |
| Sarcoidosis | LGE, T2-STIR | T1 mapping, PET-CMR (where available) |
| Iron overload | T2* mapping | Liver T2*, T1 mapping |
| Pericarditis | Early pericardial LGE | Free-breathing real-time cine (respiratory variation), T2-STIR |
| Constrictive pericarditis | Cine (septal bounce) | Real-time free-breathing cine, complementary CT (calcification) |
| Cardiac mass | T1, T2-STIR, LGE | First-pass perfusion (vascularity), fat-saturation T1 |
| Valvular disease | Cine SSFP | Phase-contrast (flow/regurgitant fraction), dobutamine stress cine (AS) |
| ASD/shunt | Phase-contrast Qp:Qs | Cine SAx (RV volume overload) |
| Takotsubo | Cine (apical ballooning) | T2 mapping (circumferential edema), LGE (expected absence) |