
Mechanism of action of calcium gluconate in hyperkalemia & hypokalemia
hyperkalemia ECG cardiac membrane potential calcium mechanism
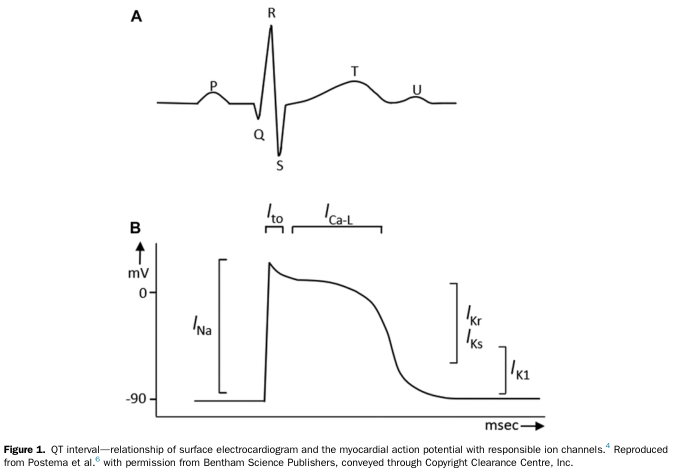
Summary : This figure illustrates the relationship between the surface electrocardiogram (ECG) waveform and the myocardial action potential, highlighting the corresponding ion channels responsible for different phases of cardiac electrical activity. line diagram: # Panel A: Surface Electrocardiogram (ECG) Waveform : • Shows a typical ECG trace with labeled points: P, Q, R, S, T, and U. • The waveform represents the electrical activity of the heart during a cardiac cycle. • P wave: atrial depolarization. • QRS complex: ventricular depolarization. • T wave: ventricular repolarization. • U wave: sometimes seen, origin not fully understood. # Panel B: Myocardial Action Potential : • Plots membrane potential (mV) on the y-axis (ranging from -90 mV to above 0 mV) against time (msec) on the x-axis. • Shows the phases of the cardiac action potential: – Rapid upstroke (depolarization) due to I_Na (sodium current). – Early repolarization (I_to, transient outward potassium current). – Plateau phase (I_Ca-L, L-type calcium current). – Repolarization phase (I_Kr and I_Ks, rapid and slow delayed rectifier potassium currents). – Resting potential maintained by I_K1 (inward rectifier potassium current). # Ion Channels & Phases : • I_Na: Responsible for the initial rapid depolarization. • I_to: Contributes to early repolarization. • I_Ca-L: Maintains the plateau phase. • I_Kr and I_Ks: Mediate repolarization. • I_K1: Maintains the resting membrane potential. # Design Encodings : • Simple black line traces for both ECG and action potential. • Ion channel names are annotated above the relevant phases of the action potential. # Analysis : • The figure visually links the phases of the ECG waveform to the underlying myocardial action potential and the specific ion channels involved. • The QRS complex corresponds to the rapid depolarization (I_Na), while the T wave aligns with repolarization (I_Kr, I_Ks). • The plateau phase (I_Ca-L) is crucial for the duration of the QT interval, which is clinically significant for arrhythmia risk. • The diagram provides a clear educational overview of how surface ECG features relate to cellular electrophysiology.
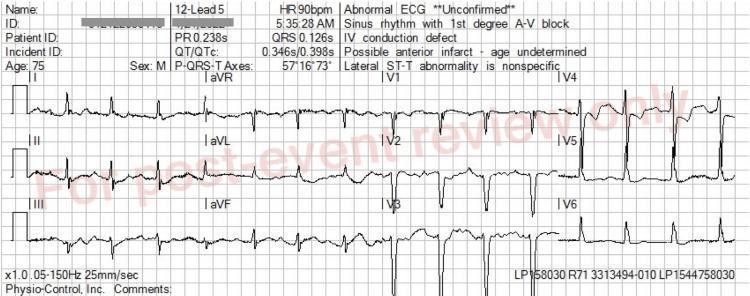
A 12-lead electrocardiogram (ECG) showing a sinus rhythm with a prolonged PR interval (238 ms) and a wide QRS complex (126 ms), characteristic of a first-degree atrioventricular (AV) block and an intraventricular conduction delay or borderline left bundle branch block (LBBB). In the limb leads (I, II, III, aVR, aVL, aVF), the P waves are upright in the inferior leads and inverted in aVR. The precordial leads (V1-V6) demonstrate deep S-waves in V1-V3 and tall R-waves in V4-V6, typical of LBBB morphology. There is noticeable ST-segment depression and T-wave flattening in leads V1-V3, while leads V4-V6 show more prominent upright T-waves and slight ST-elevation. This image represents the post-treatment state following calcium chloride administration for hyperkalemia, illustrating the narrowing of the QRS complex and stabilization of the cardiac membrane compared to earlier findings. Key educational concepts include ECG recognition of electrolyte imbalances, conduction abnormalities, and the therapeutic effect of calcium in emergency medicine.
![This pathophysiology diagram presents electrophysiological traces and calcium transients from a cardiac cellular model, comparing Wild Type (WT) in grey and the T309I mutation (WT/T309I) in red under beta-adrenergic stimulation and a shortened cycle length (CL 500 ms). The top-left panel illustrates the intracellular calcium concentration at the end of diastole ([Ca2+]i,end), showing a sudden onset of oscillations in the mutant line starting at 540 seconds, labeled as the 'start of DADs' (delayed afterdepolarizations). The subsequent Vm (membrane voltage) plots show that while WT maintains stable action potentials, the WT/T309I variant exhibits abnormal voltage oscillations and triggers spontaneous activity, marked by red asterisks. The bottom panels provide a high-resolution view of cytosolic calcium ([Ca2+]i) and Vm between 550 and 560 seconds, demonstrating the temporal coupling between erratic calcium handling and membrane potential instability. This visual data illustrates the cellular mechanism of arrhythmia, specifically how increased calcium load under sympathetic stimulation leads to triggered activity and potential ventricular tachycardia in the context of T309I-related channelopathy.](https://cdn.orris.care/cdss_images/pmc_clinical_VQA_7f0faf190186bb25dbafe77a1b7ce643ead7780576398ac8eaaf5d77961e425e.jpg)
This pathophysiology diagram presents electrophysiological traces and calcium transients from a cardiac cellular model, comparing Wild Type (WT) in grey and the T309I mutation (WT/T309I) in red under beta-adrenergic stimulation and a shortened cycle length (CL 500 ms). The top-left panel illustrates the intracellular calcium concentration at the end of diastole ([Ca2+]i,end), showing a sudden onset of oscillations in the mutant line starting at 540 seconds, labeled as the 'start of DADs' (delayed afterdepolarizations). The subsequent Vm (membrane voltage) plots show that while WT maintains stable action potentials, the WT/T309I variant exhibits abnormal voltage oscillations and triggers spontaneous activity, marked by red asterisks. The bottom panels provide a high-resolution view of cytosolic calcium ([Ca2+]i) and Vm between 550 and 560 seconds, demonstrating the temporal coupling between erratic calcium handling and membrane potential instability. This visual data illustrates the cellular mechanism of arrhythmia, specifically how increased calcium load under sympathetic stimulation leads to triggered activity and potential ventricular tachycardia in the context of T309I-related channelopathy.
Mechanism of Action of Calcium Gluconate in Hyperkalemia & Hypokalemia
Understanding the Core Physiology
In HYPERKALEMIA - "Membrane Stabilization"
The Problem
- Cells become hyperexcitable and fire spontaneously
- Cardiac conduction slows (sodium channels inactivate when membrane is already partially depolarized)
- ECG shows: peaked T waves → prolonged PR → wide QRS → sine wave → VF/asystole
What Calcium Gluconate Does
"High K+ concentration increases the resting membrane potential of the myocyte from approximately −90 to −80 mV, which is close to the depolarization threshold of −75 mV. Infusion of calcium...rapidly increases extracellular Ca2+ concentrations, which raise the depolarization threshold to approximately −65 mV. Raising the depolarization threshold to −65 mV re-establishes the interval between the normal resting potential and normal depolarization threshold, in effect decreasing myocyte excitability."
- Tietz Textbook of Laboratory Medicine, 7e
"Calcium raises the action potential threshold to a less negative value, without changing the resting membrane potential; by restoring the usual 15-mV difference between resting and threshold potentials, myocyte excitability is reduced. Administration of calcium also alters the relationship between Vmax and the resting membrane potential, maintaining a more normal Vmax at less negative resting membrane potentials and thus restoring myocardial conduction."
- Brenner and Rector's The Kidney, 2-Vol Set
| Parameter | Hyperkalemia State | After Calcium Gluconate |
|---|---|---|
| Resting membrane potential | -80 mV (less negative) | -80 mV (UNCHANGED) |
| Depolarization threshold | -75 mV (unchanged) | -65 mV (raised) |
| Gap (safety margin) | ~5 mV (dangerously narrow) | ~15 mV (restored to normal) |
| Myocyte excitability | Very high (arrhythmia risk) | Reduced (protected) |
Dosing & Clinical Notes (Harrison's 22e)
- Dose: 10 mL of 10% calcium gluconate IV over 2-3 min with cardiac monitoring
- Onset: 1-3 minutes; Duration: 30-60 minutes
- Repeat if no ECG improvement or if changes recur
- Caution with digoxin: Hypercalcemia potentiates digoxin toxicity. If unavoidable, dilute in 100 mL D5W and infuse over 20-30 min
- Calcium gluconate is preferred over calcium chloride for peripheral IV access (less risk of tissue necrosis if extravasation occurs)
In HYPOKALEMIA - A Different (and Often Misunderstood) Role
1. Concurrent Hypocalcemia (Very Common)
"Magnesium should be replaced concurrently when replacing calcium, as in hypokalemia."
- Current Surgical Therapy, 14e
2. The Digoxin-Hypokalemia Connection (Important Caveat)
- Digoxin already elevates intracellular Ca2+ by blocking Na+/K+-ATPase
- Adding exogenous calcium further increases intracellular Ca2+ → triggers delayed afterdepolarizations (DADs) → ventricular arrhythmias
- Classic teaching: calcium + digoxin toxicity = "stone heart" (irreversible systolic arrest)
Summary Comparison
| Feature | Hyperkalemia | Hypokalemia |
|---|---|---|
| Role of calcium gluconate | First-line cardiac protector | Not indicated (treats coexisting hypocalcemia only) |
| Mechanism | Raises depolarization threshold → restores 15 mV safety margin | Replaces Ca2+ if hypocalcemia is coexistent |
| Effect on K+ | None - does not change serum K+ | Not applicable |
| Onset | 1-3 minutes | N/A |
| Duration | 30-60 minutes | N/A |
| Key caution | Avoid in digoxin toxicity (use slowly diluted if essential) | Avoid if digoxin toxicity is co-present |
Pt inr levels
PT / INR - Complete Reference
What Is PT and Why Does INR Exist?
INR = (PTpatient / PTnormal mean)^ISI
- Guyton and Hall Textbook of Medical Physiology
Clotting Factors Measured by PT/INR
| Factor | Name | Pathway |
|---|---|---|
| I | Fibrinogen | Common |
| II | Prothrombin | Common |
| V | Labile factor | Common |
| VII | Proconvertin | Extrinsic (shortest half-life; most sensitive) |
| X | Stuart-Prower factor | Common |
Normal Values
| Parameter | Normal Range |
|---|---|
| Prothrombin Time (PT) | ~11-13 seconds |
| INR (healthy person) | 0.9 - 1.3 |
| High INR (e.g., 4-5) | High bleeding risk |
| Low INR (e.g., 0.5) | Thrombosis risk |
- Guyton and Hall Textbook of Medical Physiology
Therapeutic INR Targets (Warfarin)
| Indication | Target INR | Range |
|---|---|---|
| Venous thromboembolism (DVT/PE) - treatment & prevention | 2.5 | 2.0 - 3.0 |
| Atrial fibrillation (non-valvular) | 2.5 | 2.0 - 3.0 |
| Bioprosthetic heart valve | 2.5 | 2.0 - 3.0 |
| Mechanical heart valve (aortic) | 2.5 | 2.0 - 3.0 |
| Mechanical heart valve (mitral) / high-risk | 3.0 | 2.5 - 3.5 |
| Antiphospholipid syndrome (recurrent thrombosis) | 3.0 | 2.0 - 3.0 (standard) |
- Goldman-Cecil Medicine International Edition, Miller's Anesthesia 10e
Causes of Elevated INR (Prolonged PT)
- Warfarin / VKA therapy (blocks vitamin K-dependent factors II, VII, IX, X)
- Liver disease / failure - liver synthesizes all coagulation factors; INR is used as a prognostic marker (e.g., MELD score uses INR)
- Vitamin K deficiency - malnutrition, malabsorption, prolonged antibiotic use
- Disseminated intravascular coagulation (DIC) - consumption of factors
- Massive transfusion / dilutional coagulopathy
- Factor VII deficiency (most sensitive factor for PT - shortest half-life)
"The PT/INR is still accepted as a valid prognostic marker of liver failure, but can no longer be considered a reliable indicator of clinical bleeding or thrombotic risk in a patient with liver disease."
- Goldman-Cecil Medicine
Management of Elevated INR
| INR Level | Situation | Action |
|---|---|---|
| 3.5 - 10 | Asymptomatic, no bleeding | Hold warfarin; let INR drift down to range |
| ≥4.5 but <10 | Asymptomatic, high bleed risk | Oral vitamin K 1-2.5 mg |
| Any elevated | Active serious bleeding | IV Vitamin K + 4-factor PCC (Kcentra) - preferred over FFP for speed |
| Any elevated | Intracranial hemorrhage | 4-factor PCC immediately (PCC contains factors II, VII, IX, X) |
- Harrison's 22e, Washington Manual of Medical Therapeutics, Rosen's Emergency Medicine
Note: FFP is not effective for mildly elevated INR (<2.0) and risks volume overload. PCC works more rapidly.
Special Cautions
- Digoxin toxicity: Hypokalemia + hypercalcemia increase digoxin sensitivity; INR monitoring is still required if warfarin is co-prescribed
- INR is NOT reliable in liver disease for assessing bleeding risk (because protein C and S, which are anti-coagulants, are also reduced - giving a false sense of bleeding risk)
- DOACs (rivaroxaban, apixaban, dabigatran) do NOT require INR monitoring
- INR should not be used to monitor heparin (use aPTT for unfractionated heparin, or anti-Xa levels for LMWH)
Cect torso
CT scan abdomen contrast phases arterial portal venous
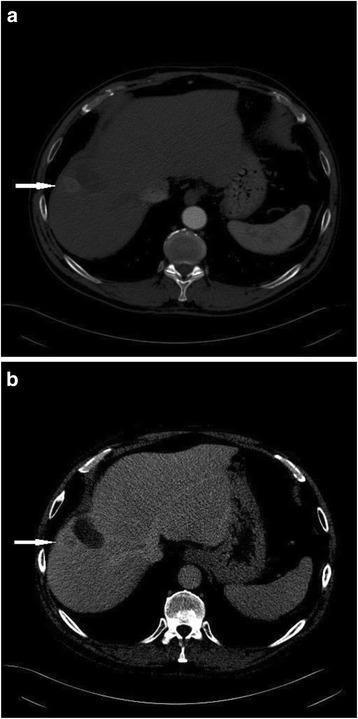
Two-panel axial CT scan of the abdomen in the arterial (a) and venous (b) phases, demonstrating a post-radiofrequency ablation (RFA) assessment in a patient with cirrhosis. Image (a) shows a hyperattenuating, arterial-enhancing nodule located at the periphery of a hypodense, well-defined rounded ablation zone in the liver. Image (b) shows the same nodule in the portal venous phase, characterized by contrast 'washout,' where the nodule becomes hypoattenuating relative to the surrounding liver parenchyma. The ablation zone itself remains non-enhancing and relatively homogeneous in both phases. This dynamic contrast enhancement pattern—arterial hyperenhancement followed by venous washout—is the hallmark of recurrent or residual hepatocellular carcinoma (HCC). The image illustrates the clinical application of CT in monitoring locoregional therapy response and identifying residual tumor at the treatment margins.
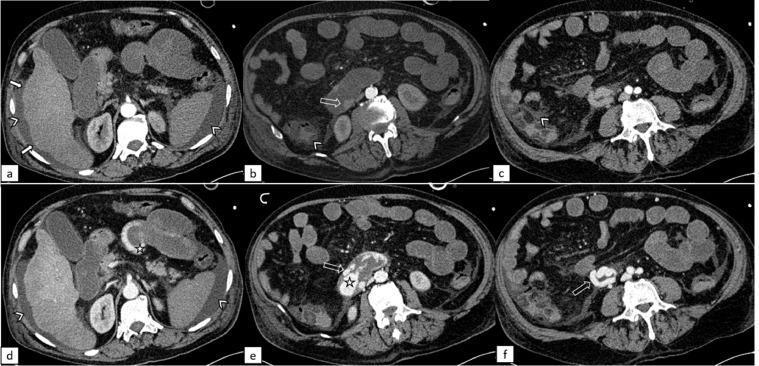
Contrast-enhanced axial computed tomography (CT) images of the abdomen displaying a comparison between the arterial phase (top row, a-c) and the venous/portal phase (bottom row, d-f). The images demonstrate hallmark features of liver cirrhosis and portal hypertension. Key findings include an irregular liver contour with surface undulations (white arrows) and significant ascites (arrowheads) manifesting as low-attenuation fluid in the perihepatic and perisplenic spaces. In the portal phase (d-f), there is a prominent, dilated, and tortuous ectopic venous varix located in the third section of the duodenum (empty arrows). High-attenuation contrast leakage (star) within the duodenal lumen in the portal phase indicates active intraluminal bleeding. The images effectively contrast the differential enhancement of hepatic parenchyma and the progressive visualization of venous structures and hemorrhage between phases. This clinical imaging set is highly relevant for medical education on the complications of portal hypertension and the diagnostic utility of multi-phase CT in identifying ectopic variceal bleeding.
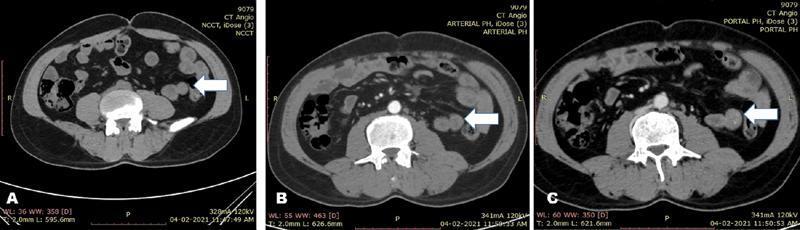
This diagnostic image is a triple-phase axial computed tomography (CT) scan of the lower abdomen, demonstrating a vascular malformation in the small bowel. The image is divided into three panels representing different contrast phases: (A) non-contrast (NCCT), (B) arterial phase, and (C) portal venous phase. Each panel shows the central lumbar vertebral body, paraspinal musculature, and abdominal cavity containing loops of bowel. White arrows in each phase point to a specific bowel loop in the left quadrant. In the non-contrast phase (A), the target loop is isodense to surrounding soft tissue. In the arterial phase (B), there is subtle hyperattenuation indicating early filling of a vascular lesion. In the portal venous phase (C), the enhancement becomes significantly more pronounced and radio-dense, characteristic of a slow-flow vascular malformation or hemangioma that fills over time. This sequence illustrates the importance of multiphase imaging in identifying mucosal vascular ectasias and angioectasias, which are key clinical considerations in patients presenting with obscure gastrointestinal bleeding or melena.
CECT Torso (Contrast-Enhanced CT of Chest-Abdomen-Pelvis)
What Is It?
"In a multitrauma patient undergoing CT scans of the head, neck, chest, abdomen, and pelvis (whole-body CT 'pan-scans'), CT images can be reconstructed to facilitate the evaluation of the spine."
- Rosen's Emergency Medicine
Contrast Phases - What They Show
| Phase | Timing After Contrast | What It Best Shows |
|---|---|---|
| Non-contrast (NCCT) | 0 sec (before injection) | Calcifications, hemorrhage, fat, baseline density |
| Arterial phase | ~25-35 sec | Aorta, arterial anatomy, hypervascular tumors (HCC, RCC, NET), active arterial bleeding |
| Portal venous phase | ~60-70 sec | Liver parenchyma (max enhancement), bowel wall, mesentery, metastases, venous thrombosis |
| Delayed / equilibrium phase | ~3-5 min | Cholangiocarcinoma, urothelial tumors (CT urogram), fibrosis, washout lesions |
- Sleisenger and Fordtran's Gastrointestinal and Liver Disease

Indications by Clinical Context
Trauma / Emergency
- Polytrauma / high-energy mechanism - Pan-scan to detect pneumothorax, hemothorax, solid organ lacerations, free fluid, vascular injury, spinal fractures
- Suspected aortic injury (deceleration mechanism)
- Occult abdominal injury in unconscious/intubated patients
- Blunt abdominal trauma with hemodynamic instability (after FAST)
Oncology (Most common indication)
| Cancer | Role of CECT CAP |
|---|---|
| Colorectal cancer | Staging - hepatic/pulmonary metastases |
| Breast cancer (locally advanced T3/T4) | Staging + bone scan |
| Lung cancer | Staging - nodal, adrenal, hepatic spread |
| Lymphoma (Hodgkin & Non-Hodgkin) | Staging (Ann Arbor) - nodal map |
| Renal cell carcinoma | Staging - vascular, nodal, adrenal, pulmonary |
| Rectal cancer | Distant metastases (+ pelvic MRI for local staging) |
| Testicular/germ cell tumors | Staging (retroperitoneal nodes) |
| HCC | Triple-phase liver protocol |
| Unknown primary | Detection of primary lesion + metastases |
- Bailey & Love's Surgery 28e, Sabiston Textbook of Surgery
Vascular
- Suspected aortic aneurysm / dissection (CTA protocol)
- Suspected mesenteric ischemia (arterial + portal venous phases)
- PE with abdominal extension (CTPA + abdomen)
Infection / Inflammatory
- Sepsis with unknown source - abscess, infective collections
- Suspected malignancy vs. inflammatory mass
- Pyrexia of Unknown Origin (PUO)
Unexplained weight loss
"Whole-body CT imaging has been demonstrated to have a diagnostic yield of 33.5% for unexplained weight loss."
- Yamada's Gastroenterology 7e
Contrast Agent & Practical Considerations
IV Contrast Used
- Iodinated non-ionic contrast (e.g., iohexol, iopamidol)
- Standard dose: 1-2 mL/kg, injected at 3-5 mL/sec via peripheral IV (18-20G cannula)
- Warm contrast reduces viscosity and injection discomfort
Pre-procedure Checklist
| Parameter | Action |
|---|---|
| Renal function (eGFR/creatinine) | Check before contrast - risk of contrast-induced nephropathy (CIN) |
| Metformin | Hold 48 hours if eGFR <45 (risk of lactic acidosis if AKI develops) |
| Allergy history | Prior contrast reaction? Premedicate with steroids + antihistamine |
| Pregnancy | Avoid if possible; discuss risk/benefit |
| Thyroid disease | Iodinated contrast can precipitate thyroid storm in hyperthyroid patients |
| Fasting | 4-6 hours (reduces aspiration risk and bowel gas artifact) |
Contrast-Induced Nephropathy (CIN)
- Risk increases significantly with eGFR <45 mL/min/1.73m²
- Prevention: IV hydration (0.9% saline or isotonic NaHCO3 before and after)
- N-acetylcysteine: historically used but evidence is mixed per meta-analyses
- Note from the National Kidney Foundation: "There is no absolute contraindication to iodinated contrast administration in patients with CKD, including those on dialysis, although preservation of existing kidney function is an important consideration"
What CECT Torso Detects - Organ by Organ
Chest
- Pulmonary metastases (nodules ≥3 mm reliably seen)
- Mediastinal / hilar lymphadenopathy
- Pleural effusion / empyema
- Pericardial effusion
- Aortic pathology (aneurysm, dissection, traumatic injury)
- Pulmonary embolism (if CT pulmonary angiogram timing used)
Abdomen
- Liver: Metastases, HCC (wash-in/wash-out), hemangioma (peripheral nodular enhancement → centripetal fill), FNH (intense arterial enhancement + central scar)
- Spleen: Laceration, infarct, lymphomatous infiltration
- Pancreas: Mass, ductal dilation, pancreatitis, necrosis
- Kidneys: RCC, AML, hydronephrosis, stones (better on NCCT), trauma laceration
- Adrenals: Adenoma vs. metastasis (washout protocol)
- Bowel: Obstruction, ischemia, perforation (free air / free fluid), wall thickening
- Mesentery / retroperitoneum: Lymph nodes, sarcoma, vascular structures
Pelvis
- Bladder, uterus, ovaries, prostate
- Pelvic nodal stations (iliac, obturator)
- Bony pelvis fractures (trauma)
- Free fluid / hemoperitoneum
Radiation Dose
| Region | Approximate Effective Dose |
|---|---|
| CT Chest | ~7 mSv |
| CT Abdomen-Pelvis | ~10-14 mSv |
| Full CT CAP (single pass) | ~15-20 mSv |
| Triple-phase CT CAP | ~30-45 mSv |
When to Prefer MRI Over CECT Torso
| Situation | Prefer MRI |
|---|---|
| Liver characterization (indeterminate lesion) | MRI liver with hepatobiliary contrast (Primovist) |
| Rectal cancer local staging | MRI pelvis |
| Young patients / repeat imaging | MRI (no radiation) |
| Renal failure / contrast allergy | MRI with gadolinium (different contraindications) |
| Brain / spinal cord | MRI preferred in all cases |
| Pregnancy | MRI (no ionizing radiation) |