
Describe The Events That Occur During CARDIAC CYCLE. B) Describe Volume & Pressure Changes In The Pp
I'll start with a quick answer while I search the medical library for detailed information.
The cardiac cycle refers to the sequence of events that occur during one complete heartbeat - from the beginning of one contraction to the beginning of the next. It involves coordinated phases of systole (contraction) and diastole (relaxation) with precise pressure and volume changes in all four chambers.
Searching sources...
Reading File
Now let me search the library for cardiac cycle content in parallel:
Finding Sources
Finding Sources
Excellent - found great sources. Let me read from the best physiology textbooks in parallel:
Reading File
Reading File
Reading File
Excellent content retrieved. Now let me get the remaining phases and pressure-volume loop details:
Reading File
Reading File
Finding Sources
I have rich content. Let me now get the pressure-volume loop details and the Guyton content on systole/diastole pressures:
Reading File
Reading File
Reading File
I now have all the information needed to compose a detailed answer. Let me also fetch the key diagram image and the Guyton systole/diastole data:
Loading Image
Reading File
Reading File
I now have all the comprehensive content needed. Let me also get the pressure-volume loop image and Guyton's specific pressure values:
Reading File
Finding Sources
I now have a comprehensive set of information from multiple authoritative physiology textbooks. Let me compile the full, detailed answer.
The Cardiac Cycle
Part A: Events During the Cardiac Cycle
The cardiac cycle is the complete sequence of mechanical and electrical events that repeats with every heartbeat - from the beginning of one contraction to the beginning of the next. At a normal heart rate of 72 beats/min, one cycle lasts approximately 0.833 seconds. The cycle is initiated by spontaneous action potential generation in the sinoatrial (SA) node, which travels through the atria, then down through the AV bundle to the ventricles, with an intentional delay of >0.1 second at the AV node that allows atria to contract ahead of the ventricles.
The Wiggers diagram (shown below) illustrates all events of one cardiac cycle simultaneously:
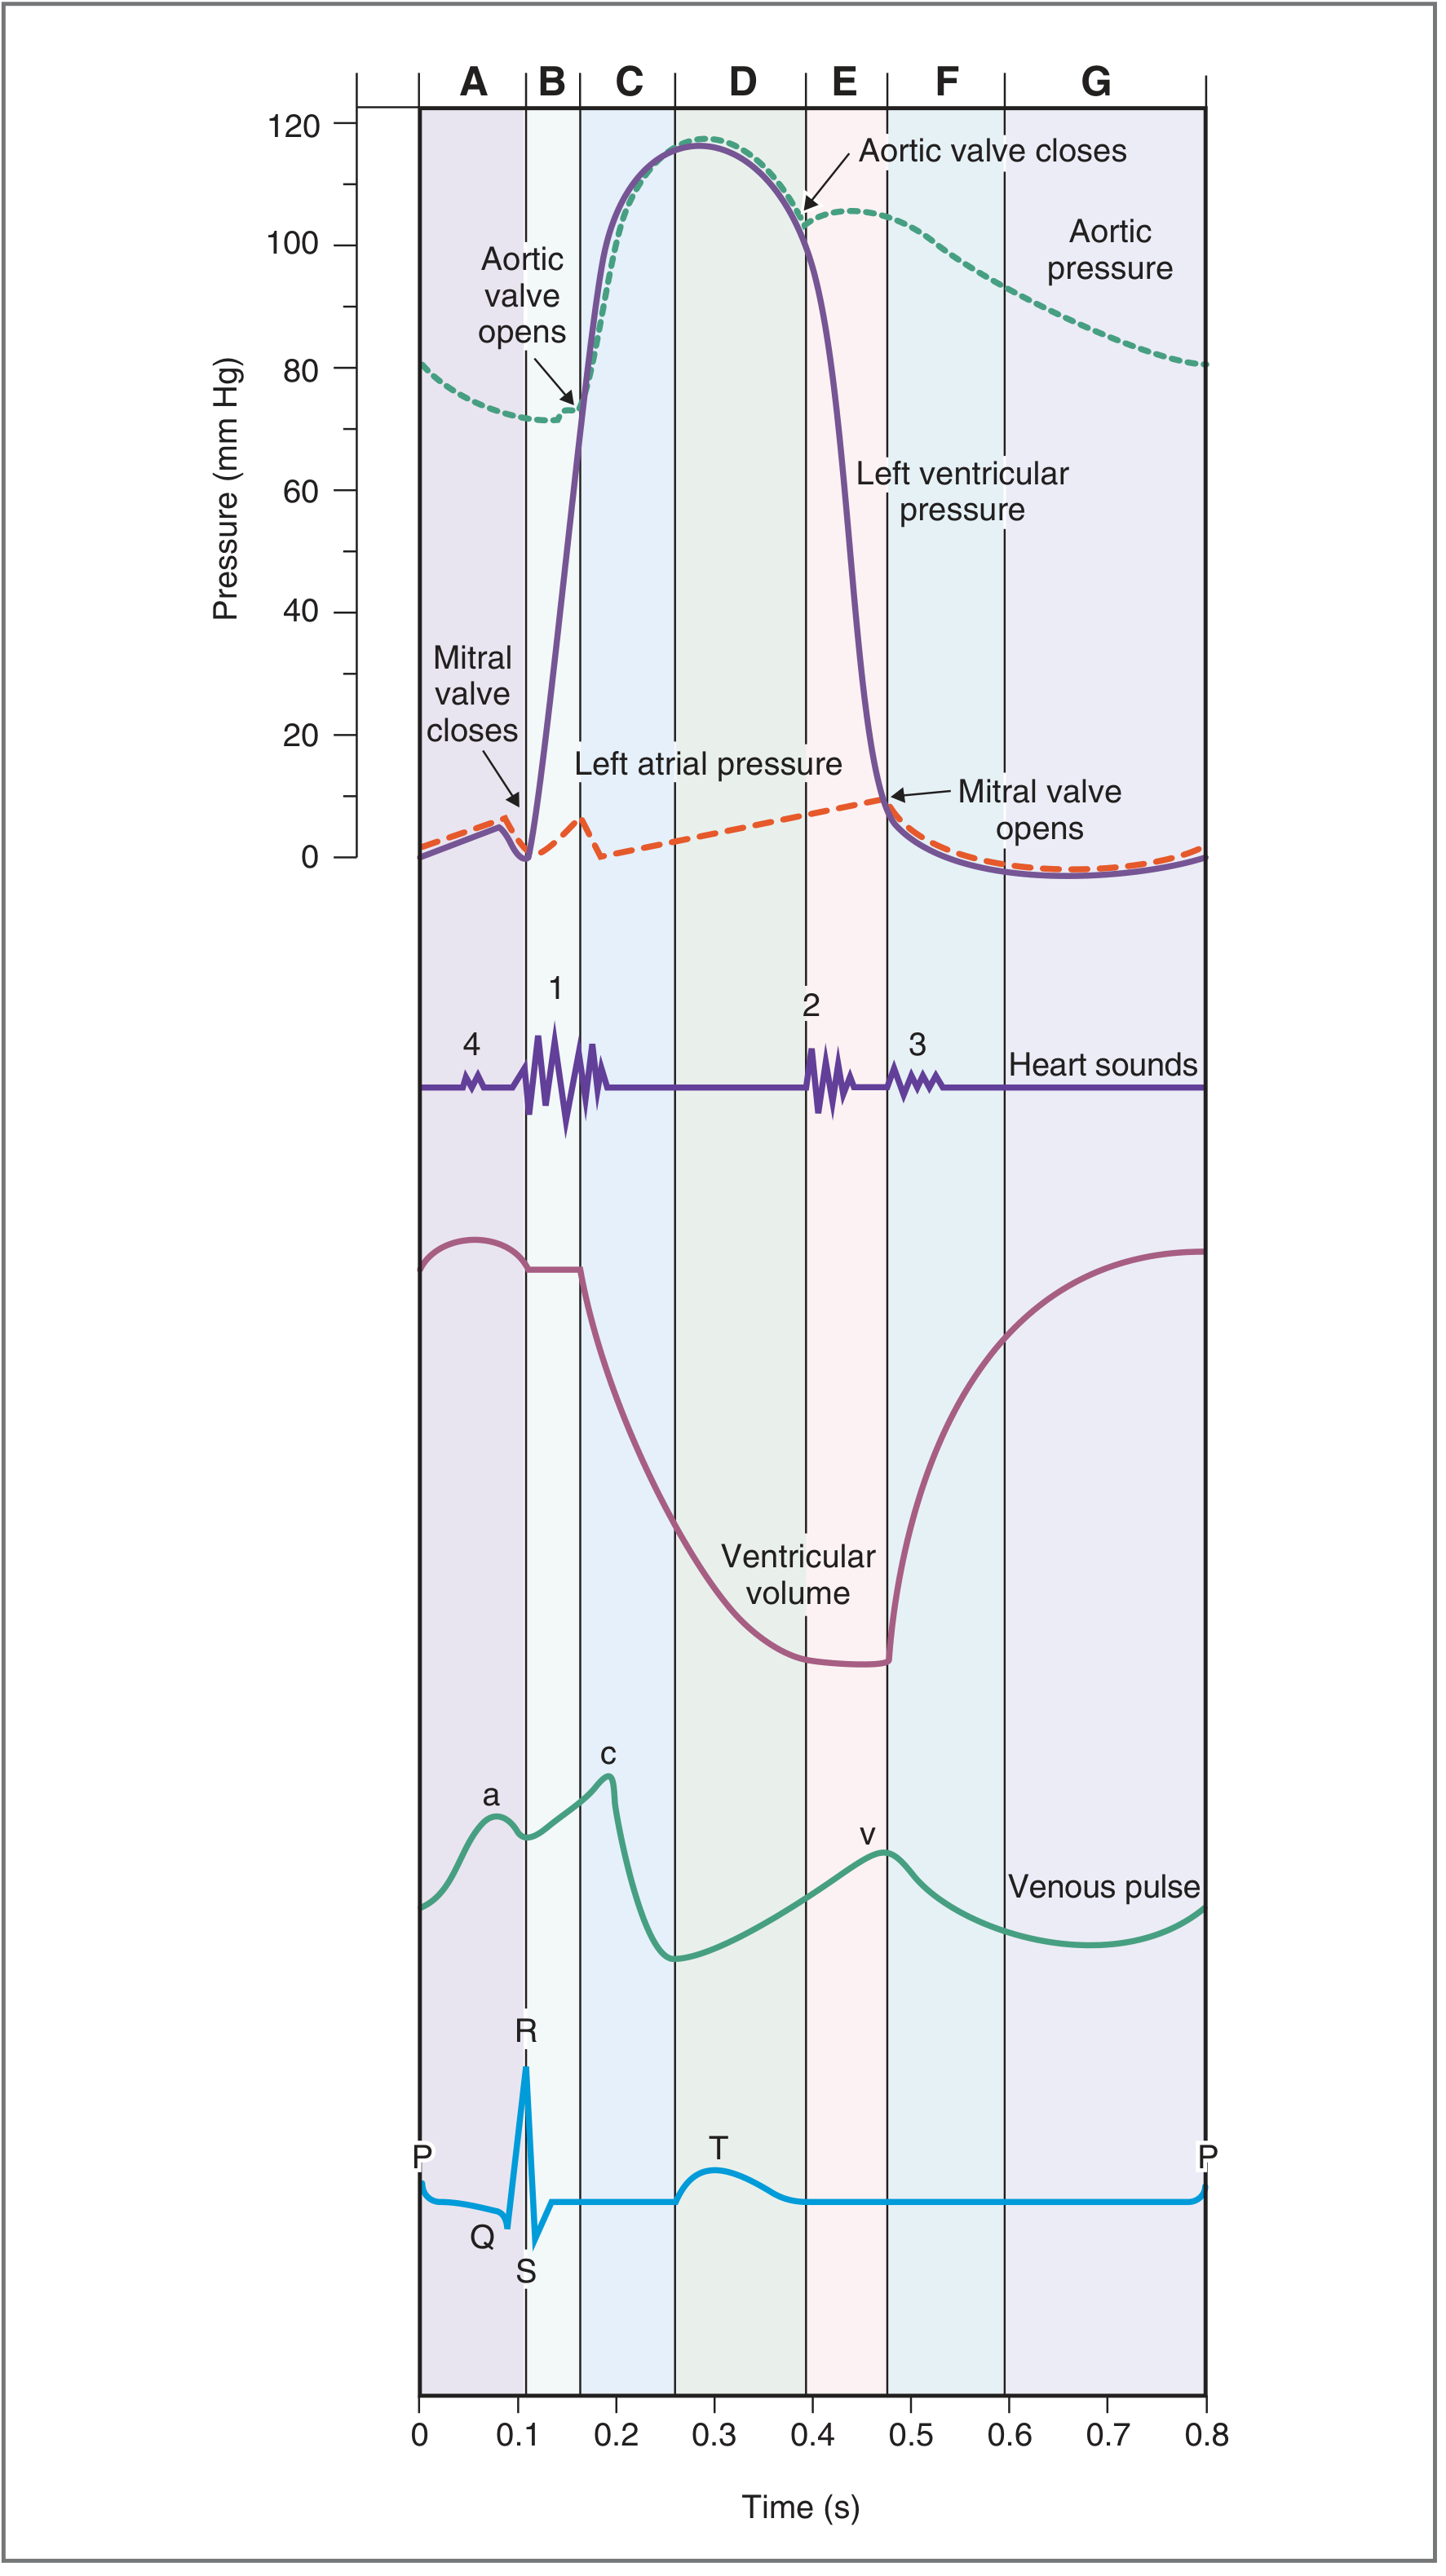
Fig. 4.25 - The Cardiac Cycle (Costanzo Physiology, 7th Edition): Phases A-G with simultaneous display of LV pressure, aortic pressure, atrial pressure, ventricular volume, venous pulse waves, heart sounds, and ECG.
The 7 Phases of the Cardiac Cycle
Phase A - Atrial Systole (Atrial Contraction)
| Parameter | Event |
|---|---|
| ECG | P wave → PR interval |
| Valves | Mitral valve open; aortic valve closed |
| Heart Sound | S4 (not audible normally; audible in ventricular hypertrophy) |
- The P wave marks depolarization of the atria, triggering atrial contraction.
- Atrial contraction raises left atrial pressure, propelling blood into the already-filling left ventricle through the open mitral valve.
- This constitutes the final phase of ventricular filling (the "atrial kick"), contributing ~20-25% of stroke volume at rest (up to 40% during heavy exercise).
- The rise in atrial pressure is reflected back to the great veins and appears as the "a" wave on the jugular venous pulse (JVP).
- Ventricular volume increases to reach End-Diastolic Volume (EDV) = ~140 mL.
- A faint S4 ("atrial gallop") may be heard if the ventricle is stiff and resists filling.
Phase B - Isovolumetric Ventricular Contraction (IVC)
| Parameter | Event |
|---|---|
| ECG | QRS complex |
| Valves | Mitral valve closes (all valves closed) |
| Heart Sound | S1 (lub) |
- Triggered by the QRS complex, the ventricles begin to contract.
- As soon as left ventricular pressure exceeds left atrial pressure, the mitral valve snaps shut - producing S1 (first heart sound). S1 may be slightly split because the mitral valve closes slightly before the tricuspid valve.
- The aortic valve remains closed (LV pressure has not yet reached aortic pressure).
- With both valves closed, no blood can enter or leave the ventricle - volume remains constant (isovolumetric).
- LV pressure rises steeply but volume stays fixed at 140 mL (EDV).
- This is the phase of maximum myocardial oxygen consumption per unit time.
Phase C - Rapid Ventricular Ejection
| Parameter | Event |
|---|---|
| ECG | ST segment |
| Valves | Aortic valve opens |
| Heart Sound | None |
- When LV pressure rises above aortic pressure (~80 mmHg diastolic), the aortic valve opens.
- Blood is rapidly ejected into the aorta driven by the pressure gradient.
- LV pressure rises to its peak systolic value (~120 mmHg).
- ~70% of the stroke volume is ejected during this rapid phase.
- Ventricular volume decreases sharply; aortic pressure rises rapidly to its peak (~120 mmHg systolic).
- Simultaneously, the left atrium begins filling with blood returning from the pulmonary veins - left atrial pressure slowly increases (seen as the "c" wave → rising towards "v" wave on JVP).
Phase D - Reduced Ventricular Ejection
| Parameter | Event |
|---|---|
| ECG | T wave |
| Valves | Aortic valve still open |
| Heart Sound | None |
- The T wave marks ventricular repolarization - the ventricle begins to relax.
- The aortic valve remains open; blood continues to be ejected but at a slower rate.
- Ventricular volume continues to decrease (reaching End-Systolic Volume, ESV = ~70 mL).
- Aortic pressure begins to fall as blood runs off into the peripheral arterial tree faster than it is being added from the ventricle.
- Left atrial pressure continues to build as pulmonary venous return accumulates.
Phase E - Isovolumetric Ventricular Relaxation (IVR)
| Parameter | Event |
|---|---|
| ECG | After T wave |
| Valves | Aortic valve closes (all valves closed) |
| Heart Sound | S2 (dub) |
- When LV pressure falls below aortic pressure, the aortic valve closes - producing S2 (second heart sound). Aortic valve closes slightly before the pulmonic valve.
- The point of aortic valve closure produces the dicrotic notch (incisura) on the aortic pressure tracing.
- Physiological splitting of S2 occurs during inspiration: decreased intrathoracic pressure increases venous return to the right heart, prolonging right ventricular ejection and delaying pulmonic valve closure, causing the aortic and pulmonic components of S2 to separate.
- With both valves again closed, the ventricle relaxes but volume remains constant (isovolumetric) at 70 mL (ESV).
- LV pressure falls rapidly.
Phase F - Rapid Ventricular Filling
| Parameter | Event |
|---|---|
| ECG | Isoelectric (between T and next P) |
| Valves | Mitral valve opens |
| Heart Sound | S3 (normal in children; pathological in adults) |
- When LV pressure falls below left atrial pressure, the mitral valve opens.
- Blood rushes from the atrium into the relaxed, highly compliant ventricle - ventricular volume rises rapidly.
- Ventricular pressure stays low because the compliant ventricle accommodates volume with little pressure rise.
- The rapid rush of blood into the ventricle generates S3 (third heart sound). In adults >40 years, S3 = "ventricular gallop" and indicates volume overload (e.g., heart failure, mitral regurgitation).
- The large "v" wave on the JVP tracing collapses as blood empties from the atrium into the ventricle (the "y descent").
- Aortic pressure continues to fall as blood runs off into the arterial tree.
Phase G - Reduced Ventricular Filling (Diastasis)
| Parameter | Event |
|---|---|
| ECG | Isoelectric |
| Valves | Mitral valve open |
| Heart Sound | None |
- This is the longest phase of the cardiac cycle.
- Ventricular filling continues but at a much slower rate as the pressure gradient between atrium and ventricle equalizes.
- Both atrial and ventricular pressures rise slowly and together, driven by the slightly higher pulmonary venous pressure.
- The cycle then resumes with the next P wave and atrial systole.
- Clinical note: Tachycardia primarily shortens or eliminates diastasis. If heart rate is very high, this phase may disappear entirely, compromising ventricular filling, reducing EDV, and reducing stroke volume (via Frank-Starling mechanism).
Summary Table of All 7 Phases
| Phase | Description | ECG | Valves | Heart Sound |
|---|---|---|---|---|
| A | Atrial Systole | P wave | Mitral open | S4 (if present) |
| B | Isovolumetric Ventricular Contraction | QRS | Mitral closes (all closed) | S1 |
| C | Rapid Ventricular Ejection | ST segment | Aortic opens | - |
| D | Reduced Ventricular Ejection | T wave | - | - |
| E | Isovolumetric Ventricular Relaxation | After T | Aortic closes (all closed) | S2 |
| F | Rapid Ventricular Filling | Isoelectric | Mitral opens | S3 (if present) |
| G | Reduced Ventricular Filling (Diastasis) | Isoelectric | - | - |
Part B: Volume and Pressure Changes During the Cardiac Cycle
Left Ventricular Pressure Changes
| Phase | LV Pressure | LV Volume | Aortic Pressure |
|---|---|---|---|
| Atrial systole | 0-8 mmHg (slight rise) | Rises to 140 mL (EDV) | ~80 mmHg (falling) |
| IVC | 0 → ~80 mmHg (rising steeply) | Constant at 140 mL | ~80 mmHg |
| Rapid ejection | 80 → 120 mmHg (peak) | 140 → ~90 mL (falling fast) | 80 → 120 mmHg (rising) |
| Reduced ejection | 120 → ~80 mmHg (falling) | ~90 → 70 mL (ESV) | 120 → ~100 mmHg (falling) |
| IVR | 80 → ~8 mmHg (falling steeply) | Constant at 70 mL | ~100 → 80 mmHg (dicrotic notch, then falling) |
| Rapid filling | ~5-8 mmHg (low, stable) | 70 → ~130 mL (rising fast) | ~80 mmHg (falling) |
| Diastasis | ~5-8 mmHg | 130 → 140 mL (slow rise) | ~80 mmHg (continuing to fall) |
Key Volume Values (Typical at Rest)
| Parameter | Value |
|---|---|
| End-Diastolic Volume (EDV) | ~140 mL |
| End-Systolic Volume (ESV) | ~70 mL |
| Stroke Volume (EDV - ESV) | ~70 mL |
| Ejection Fraction (EF) | 70/140 = ~50% (normal ≥55%) |
| Cardiac Output | 70 mL × 70 beats/min = ~5 L/min |
Aortic Pressure Waveform Features
- Peak systolic pressure: ~120 mmHg (Phase C)
- Dicrotic notch (incisura): Occurs at aortic valve closure (Phase E) - a brief upward deflection followed by a fall in pressure
- Diastolic pressure: ~80 mmHg (lowest point before next systole)
- Pulse pressure: Systolic - Diastolic = 120 - 80 = 40 mmHg
- Mean arterial pressure (MAP): ~93 mmHg (= Diastolic + 1/3 Pulse Pressure)
Jugular Venous Pulse (JVP) Waves During the Cardiac Cycle
| Wave | Timing | Cause |
|---|---|---|
| a wave | Phase A | Atrial contraction → rise in RA pressure |
| c wave | Phase B | Tricuspid valve bulging into RA during IVC; carotid artery pulsation |
| x descent | Phase C/D | Atrial relaxation + downward displacement of AV ring during ejection |
| v wave | Phase E/F | Venous filling of atrium while tricuspid valve is still closed |
| y descent | Phase F | Tricuspid valve opens → rapid atrial emptying into RV |
The Left Ventricular Pressure-Volume Loop
The pressure-volume (PV) loop (also called the Wiggers diagram in its PV form) graphically represents the entire cardiac cycle as a loop plotted with LV volume on the x-axis and LV pressure on the y-axis:
- Point 1 (bottom right): End-diastole - mitral valve closes. LV volume = 140 mL, LV pressure = low (~8 mmHg)
- 1 → 2 (IVC): Pressure rises steeply with no volume change (vertical line on right)
- Point 2: Aortic valve opens when LV pressure = aortic diastolic pressure
- 2 → 3 (Ejection): Pressure continues rising then falls; volume decreases significantly. Width of loop = stroke volume (70 mL)
- Point 3 (top left): End-systole - aortic valve closes. LV volume = 70 mL (ESV)
- 3 → 4 (IVR): Pressure falls steeply with no volume change (vertical line on left)
- Point 4: Mitral valve opens when LV pressure falls below LA pressure
- 4 → 1 (Filling): Volume increases back to EDV with minimal pressure change (compliant ventricle)
The area enclosed by the PV loop = stroke work of the ventricle (external mechanical work done per beat).
Right Heart vs. Left Heart
The right ventricle follows the same sequence of events but with lower pressures:
| Parameter | Left Heart | Right Heart |
|---|---|---|
| Systolic pressure | ~120 mmHg | ~25 mmHg |
| Diastolic pressure | ~8 mmHg | ~5 mmHg |
| End-diastolic volume | Same (~140 mL) | Same (outputs must be equal) |
| End-systolic volume | Same | Same |
Effect of Heart Rate on the Cardiac Cycle
- At 72 beats/min, systole = ~0.4 of the cycle; diastole = ~0.6 of the cycle
- At very high heart rates, diastole is disproportionately shortened (especially diastasis)
- Tachycardia reduces diastolic filling time → reduces EDV → reduces stroke volume (Frank-Starling)
- This is why very fast heart rates (e.g., >150 bpm) can reduce cardiac output despite more beats per minute
Sources: Costanzo Physiology 7th Edition, pp. 160-163 | Guyton and Hall Textbook of Medical Physiology | Medical Physiology (Boron & Boulpaep)
This is a shared conversation. Sign in to Orris to start your own chat.