
What can be the conditions with patient having needle like pain in knee when pressed
needle like sharp stabbing pain in knee when pressed causes differential diagnosis
knee pain anatomy diagram showing bursae joint line tenderness locations
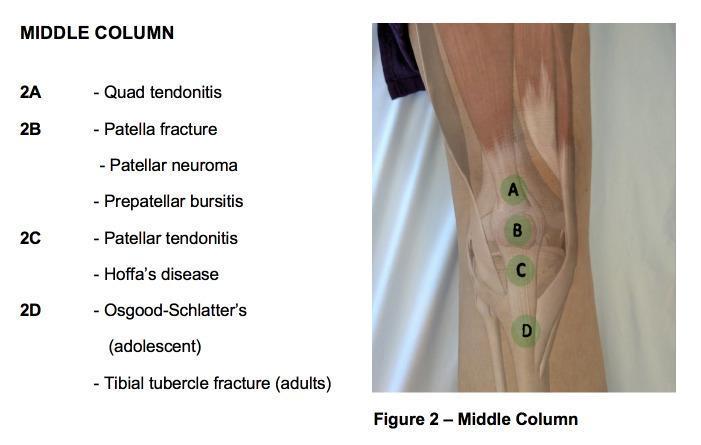
This educational infographic, titled 'Figure 2 – Middle Column', illustrates the surface anatomy and clinical differential diagnosis for anterior knee pain. The image features a clinical photograph of a lower limb with a transparent anatomical overlay showing the musculature and skeletal structure from the distal femur to the proximal tibia. Four green circular markers (A, B, C, D) are vertically aligned over the 'middle column' of the knee to pinpoint specific anatomical landmarks. Marker A corresponds to the quadriceps tendon (associated with quad tendonitis); B is positioned over the patella (related to patella fracture, patellar neuroma, and prepatellar bursitis); C indicates the patellar tendon (associated with patellar tendonitis and Hoffa’s fat pad disease); and D marks the tibial tuberosity (related to Osgood-Schlatter’s disease in adolescents and tibial tubercle fractures in adults). This anatomical diagram serves as a diagnostic guide for identifying localized pathology based on the site of anterior knee tenderness.
This composite educational graphic illustrates a pre-clinical study on knee osteoarthritis (KOA) treatment using miRNA modulation in a mouse model. (A) Timeline diagram showing the 28-day experimental protocol including MIA injection, behavioral testing, and therapeutic injections. (B) Line graph tracking heat hyperalgesia (pain threshold) over 28 days. (C, D) Bar charts quantifying serum inflammatory markers TNF-α and IFN-γ across experimental groups. (E) Comparative histology of joint sections using Safranin O/Fast Green staining at 50x and 200x magnification. The 'Model', 'RNAnc', and 'mimic' groups show significant depletion of red Safranin O stain, indicating proteoglycan loss and articular cartilage thinning. The 'inhibitor' group demonstrates preserved cartilage integrity and increased red stain intensity. (F) Statistical box plot of OARSI scores quantifying cartilage degradation. (G) Diagnostic imaging comprising 3D μCT joint reconstructions and 2D sagittal cross-sections. These images visualize structural changes such as cartilage erosion and joint space narrowing in the KOA model versus the restorative effects observed in the inhibitor treatment group. The visual elements demonstrate the efficacy of miR-199b-5p inhibition in attenuating osteoarthritic pathology.
This medical illustration consists of two comparative anatomical diagrams in a posterior view, likely representing surgical concepts related to posterior tissue releases in orthopedic surgery. The left diagram depicts the distal femur, proximal tibia, and fibula forming the knee joint. It features black hatch marks across the posterior joint capsule and soft tissues, alongside red dashed lines indicating ligamentous or neurovascular structures. The right diagram illustrates the effect of a posterior release; it shows a bowed posterior capsule with arrows indicating the mobilization and displacement of tissues away from the joint space. A continuous red line on both diagrams represents the neurovascular bundle or skin contour, demonstrating its relationship to the underlying musculoskeletal structures. This illustration is an educational tool for understanding surgical approaches to correcting knee flexion contractures or managing posterior knee anatomy during joint reconstruction.
Conditions Causing Needle-Like (Sharp, Point) Pain in the Knee When Pressed
1. Bursitis (most common cause of focal, sharp tenderness)
| Bursa | Location of tenderness | Typical cause |
|---|---|---|
| Prepatellar bursa ("Housemaid's knee") | Over the front of the kneecap | Chronic kneeling, direct fall |
| Infrapatellar bursa | Just below the kneecap / tibial tubercle | Overuse, jumping athletes |
| Anserine bursa | Medial (inner) side, just below the joint line | Obesity, OA, middle-aged women |
| Tibial collateral ligament bursa | Medial joint line | Calcification, fibrositis |
- The prepatellar bursa area is tender to palpation, with palpable bursal margins
- Passive range of motion is typically preserved (unlike intra-articular injury)
- Can become infected (septic bursitis), especially in children - Tintinalli's Emergency Medicine
2. Meniscal Tear
- Cardinal sign: sharp, focal joint line tenderness - pressing along the inner (medial) or outer (lateral) joint line reproduces the pain
- Associated features: intermittent locking or catching, giving way, clicking, delayed swelling (12-24 hours)
- Caused by twisting injury on a flexed knee, or degenerative wear in middle age
- McMurray and Thessaly tests can reproduce pain - Bailey & Love's Surgery; Rosen's Emergency Medicine
3. Patellar Tendinitis ("Jumper's Knee")
- Sharp, needle-like tenderness at the inferior pole of the patella (where the tendon attaches)
- Common in jumping athletes (basketball, volleyball)
- Worsened by resisted knee extension, stairs, squatting
4. Quadriceps Tendinitis
- Tenderness at the superior pole of the patella (quadriceps tendon insertion)
- Pain on pressing just above the kneecap
- Often from overuse or eccentric loading
5. Patellofemoral Pain Syndrome (PFPS) / Chondromalacia Patellae
- Pain around or behind the kneecap, reproduced by pressing the patella against the femur (patellar compression test)
- Most common cause of knee pain overall; women more affected than men
- Worsened by prolonged sitting, stairs, squatting - Rosen's Emergency Medicine
6. Plica Syndrome
- Thickened synovial fold (plica) causes a tender, cord-like structure on the medial side of the knee
- Pressing on the anteromedial knee with the knee extended reproduces sharp pain
- Associated snapping or clicking; often missed because it mimics meniscal tear
7. Osgood-Schlatter Disease (adolescents)
- Sharp tenderness at the tibial tubercle (bony bump below the kneecap)
- Classic in growing teenagers (10-15 years), especially active boys
- Pressing the tibial tuberosity reproduces the needle-like pain
8. Sinding-Larsen-Johansson Syndrome (adolescents)
- Tenderness at the inferior pole of the patella (similar to Osgood-Schlatter, but at a different location)
- Apophysitis of the distal patella in skeletally immature athletes
9. Pes Anserine Bursitis
- Sharp tenderness at the proximal medial tibia, about 2-3 cm below the joint line
- Common in overweight, diabetic, or osteoarthritic patients with valgus deformity
- Pressing this spot produces the characteristic needling pain - Rosen's Emergency Medicine
10. Ligament Injuries (MCL/LCL)
- Medial collateral ligament (MCL): point tenderness along the medial side of the knee
- Lateral collateral ligament (LCL): lateral side tenderness, worsened by varus stress
- Pellegrini-Stieda disease: ossification of the proximal MCL, causes a palpable, tender mass on the medial knee - Tintinalli's Emergency Medicine
11. Iliotibial (IT) Band Syndrome
- Sharp, burning pain on the lateral knee, at the IT band's insertion point
- Reproduced by pressing the lateral femoral condyle with the knee at ~30 degrees flexion (Noble compression test)
- Classic in runners
12. Nerve Entrapment / Neuroma
- Saphenous nerve or infrapatellar branch entrapment can cause sharp, needle-like (neuropathic) pain
- Tinel's sign: tapping over the nerve reproduces shooting pain
- Can follow prior surgery or trauma to the knee
13. Hoffa's Fat Pad Impingement
- Tenderness on pressing either side of the patellar tendon (infrapatellar fat pad)
- Worsened by full extension of the knee
14. Septic Arthritis / Osteomyelitis (urgent)
- If pressing the knee causes severe pain accompanied by warmth, redness, fever, and inability to move the joint - this is an emergency
- Must be ruled out before assuming a benign cause
Key Diagnostic Approach
| What to assess | Why it matters |
|---|---|
| Exact location of maximal tenderness | Narrows diagnosis significantly (joint line vs. tibial tubercle vs. patellar area) |
| Age of patient | Osgood-Schlatter in teens; OA/anserine bursitis in older adults |
| History of trauma or twisting | Points toward meniscal/ligament injury |
| Activity level / overuse | Points toward tendinitis, bursitis, IT band |
| Swelling | Intra-articular (effusion) vs. soft tissue (bursitis) |
| Fever, redness | Raises concern for septic bursitis/arthritis |