
Somites
somite formation embryology paraxial mesoderm diagram
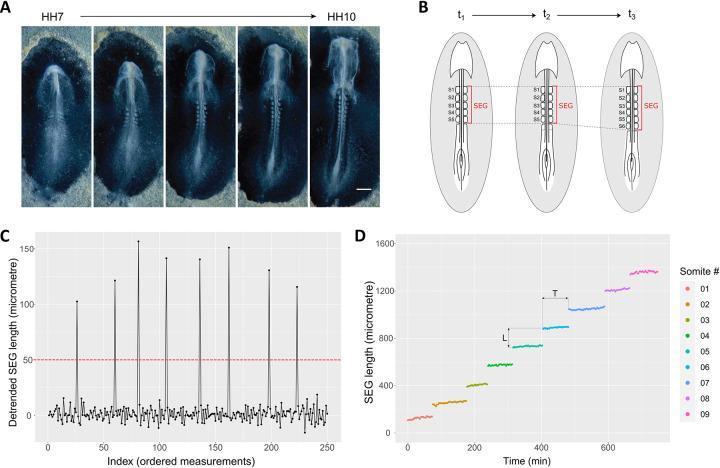
This figure illustrates the methodological approach for measuring somitogenesis in a developing chick embryo. Panel A displays a time-lapse series of dark-field microscopy images from Hamburger-Hamilton stage 7 (HH7) to HH10, showing the anterior-posterior elongation and the progressive formation of somites as segmental paired blocks of paraxial mesoderm. Panel B is a schematic diagram illustrating the measurement of the Segmented Region (SEG), defined as the distance between the first and last formed somitic clefts across time points t1 to t3. Panel C is a line graph showing detrended SEG length in micrometers, where periodic peaks exceeding a 50 μm threshold identify the discrete addition of new somites. Panel D is a stepwise progression chart plotting total SEG length over time (minutes). Each color-coded horizontal step represents the formation of a specific somite (1 through 9), where vertical distance (L) indicates individual somite length and horizontal distance (T) indicates the time interval of formation. This visual content demonstrates developmental biology principles and quantitative morphometric analysis of embryonic segmentation.
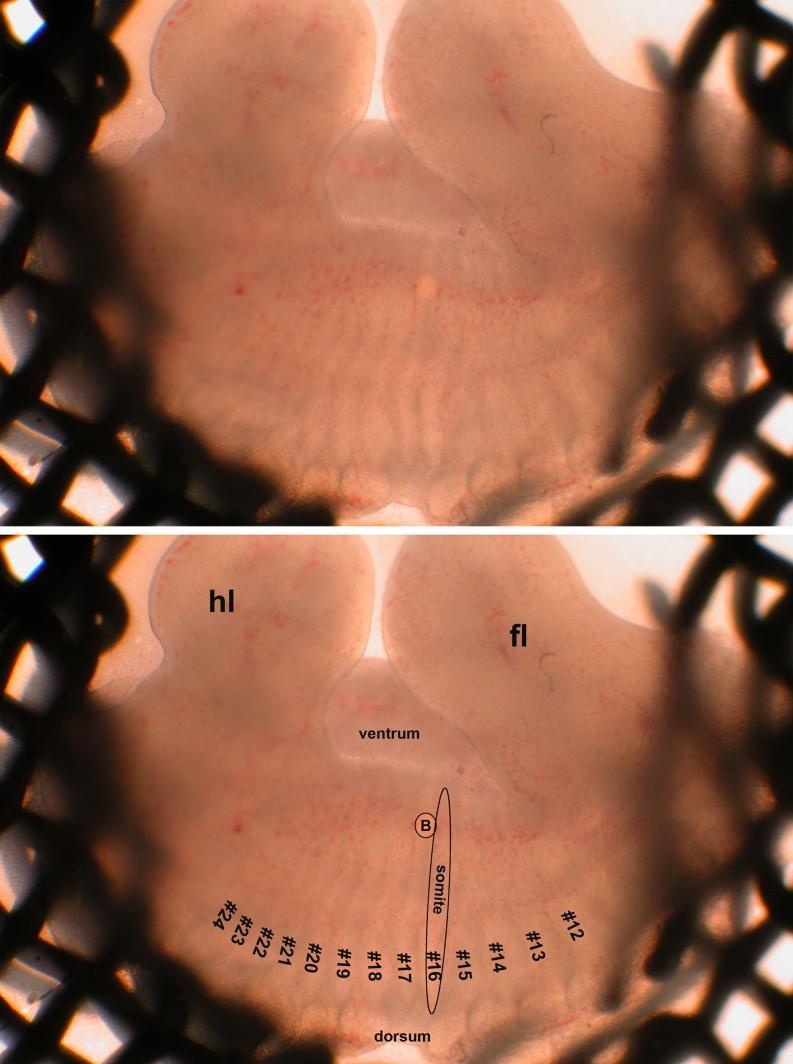
Micrograph showing a cultured embryonic flank explant used in developmental biology research. The image is split into two panels: the top panel shows the original specimen, and the bottom panel provides detailed anatomical annotations. The translucent tissue sample is positioned on a filter over a metal support grid. Key structures identified include the forelimb (fl) and hindlimb (hl) buds, as well as the ventral and dorsal orientations. A series of somites are numbered from #12 to #24, illustrating the segmental organization of the paraxial mesoderm. An ellipse highlights a specific somite (#16), and a circle labeled 'B' marks the location of a grafted bead, likely used for local delivery of biochemical signals to study limb or somite development. This visual is representative of experimental embryology techniques used to analyze tissue patterning and organogenesis.
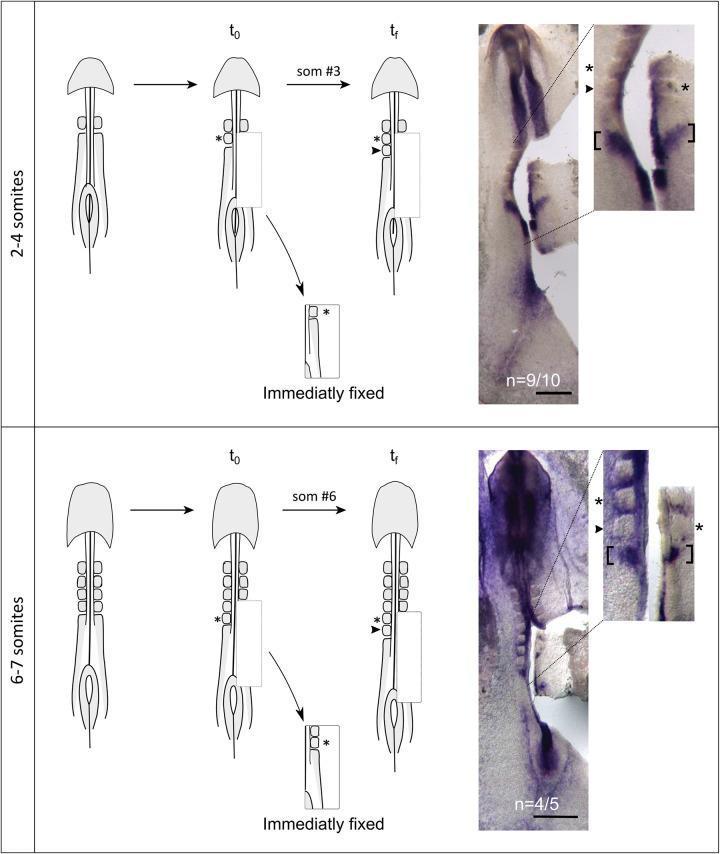
This scientific figure illustrates the oscillatory expression of the hairy1 gene during somitogenesis in early chick embryos. The image is divided into two panels: the top representing the 2-4 somite stage and the bottom representing the 6-7 somite stage. Each panel features a schematic representation of the experimental protocol and corresponding in situ hybridization results. The experimental setup demonstrates live-imaging where a newly formed somite cleft is identified at time t0; one side of the paraxial mesoderm is excised and fixed, while the contralateral side is cultured until the next somite (tf) forms. The right side of the figure displays microscopic photographs of the embryos after in situ hybridization for hairy1 mRNA (dark purple staining). High-intensity staining is visible within the segmented somites and the presomitic mesoderm. Asterisks and arrowheads indicate the sequential formation of somites, while brackets highlight consistent oscillatory expression domains between the t0 and tf stages. This visualization supports the biological concept that the segmentation clock is temporally coupled to physical somite formation along the anterior-posterior axis.
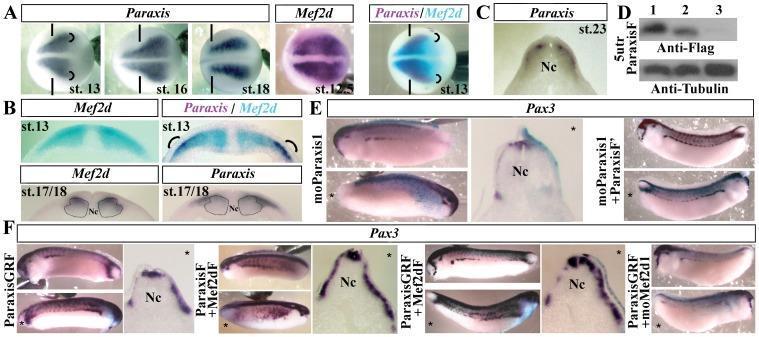
This composite educational graphic illustrates the cooperative effects of transcription factors Paraxis and Mef2d on dermomyotome formation in Xenopus embryos. Panels A-C show whole-mount in situ hybridization (WISH) and transverse sections tracking Paraxis and Mef2d mRNA expression from neurulation (stage 13) to tailbud stages. Notable findings include co-localization in the lateral paraxial mesoderm at stage 13, shifting to dorsolateral somite regions by stage 18. Panel D presents a Western blot confirming the knockdown efficiency of oligomorpholinos (moParaxis1) against Flag-tagged Paraxis protein. Panels E and F demonstrate the functional hierarchy through loss-of-function and gain-of-function experiments using Pax3 as a marker for dermomyotome development. Data show that moParaxis1 injection decreases Pax3 expression, which can be rescued by ParaxisF' mRNA. Conversely, overexpression of Paraxis (ParaxisGRF) or co-injection with Mef2dF significantly enhances and ventrally extends the Pax3 expression domain. Transverse sections reveal spatial orientation relative to the notochord (Nc). The visual supports the role of a Mef2d/Paraxis/Meox2/Pax3 regulatory pathway in early myogenesis and somite compartmentalization.
somite differentiation sclerotome dermomyotome myotome
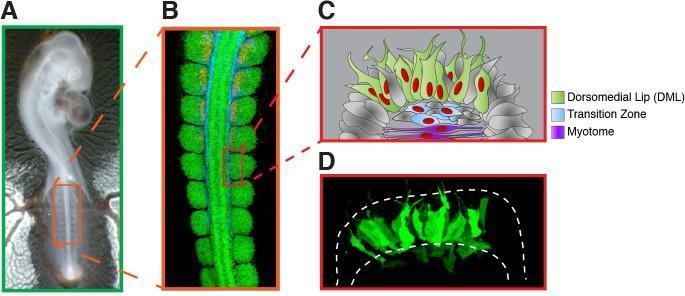
This composite image illustrates the experimental design and visual results of a developmental biology study using chick embryos to analyze somite differentiation. (A) Gross photograph of a chick embryo at HH stage 15–16, highlighting the newly formed somites targeted for electroporation. (B) Immunofluorescence microscopy of the somite region. PAX7 (green) labels the dermomyotome, HNK1 (blue) marks the neural crest, and MYF5 (red) indicates myotome formation. (C) An anatomical diagram providing a cross-sectional view of a single somite, categorizing the dorsomedial lip (DML, green), transition zone (blue), and nascent primary myotome (purple). (D) A diagnostic confocal microscopy image showing a maximum intensity projection of a somite 6 hours post-electroporation with Green Fluorescent Protein (GFP). The image reveals clustered, elongated green signals within a dashed white boundary, indicating successful mosaic expression of the construct in the target somitic cells. This visual set demonstrates the early stages of skeletal muscle progenitor formation and the spatial relationship between neural crest migration and myogenesis.
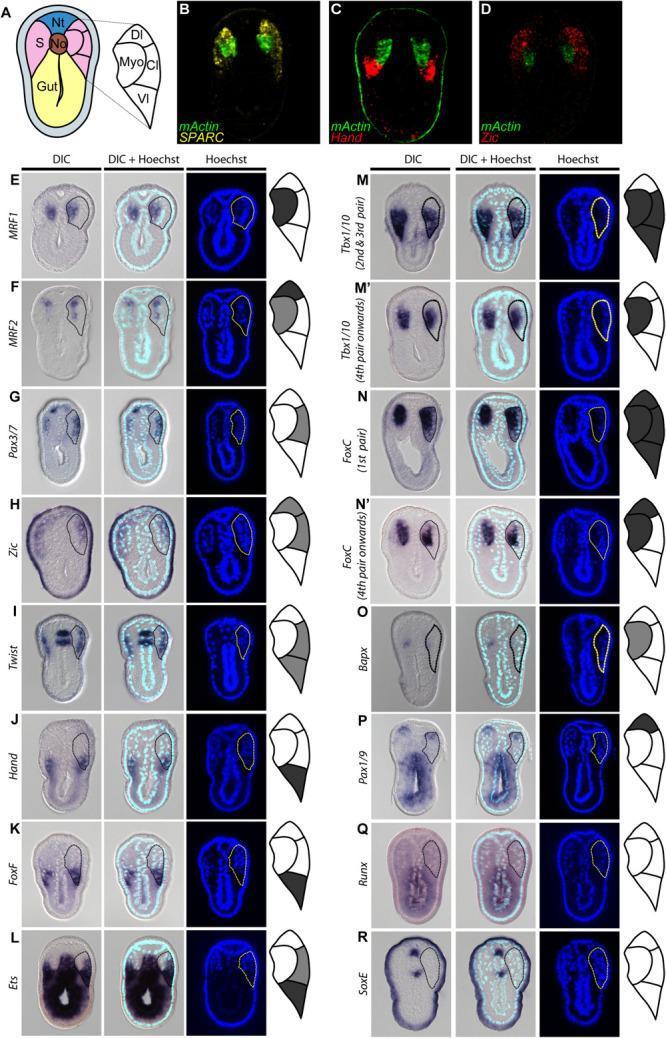
This composite educational image illustrates the molecular compartmentalization of somites in an N3-stage amphioxus (Branchiostoma) embryo, a key model for chordate evolution and developmental biology. Panel A provides a schematic of the cross-section, identifying the neural tube, notochord, and gut, with the somite divided into myotome (Myo), dorsolateral (Dl), centrolateral (Cl), and ventrolateral (Vl) domains. Panels B–D utilize double fluorescent in situ hybridization to demonstrate mutually exclusive expression of medial markers (mActin in red) and lateral markers (SPARC, Hand, and Zic in green). Panels E–R present a systematic survey of somite marker genes (e.g., MRF1/2, Pax3/7, Twist, FoxC, Pax1/9) across three imaging modalities: Differential Interference Contrast (DIC) for purple-stained gene expression, DIC + Hoechst, and Hoechst nuclear staining (fluorescence). Each row includes a localized diagram shaded in gray to indicate expression intensity. This comparative analysis demonstrates homologous patterning to vertebrate dermomyotome, myotome, and lateral plate mesoderm, while highlighting specific differences in sclerotome marker expression.
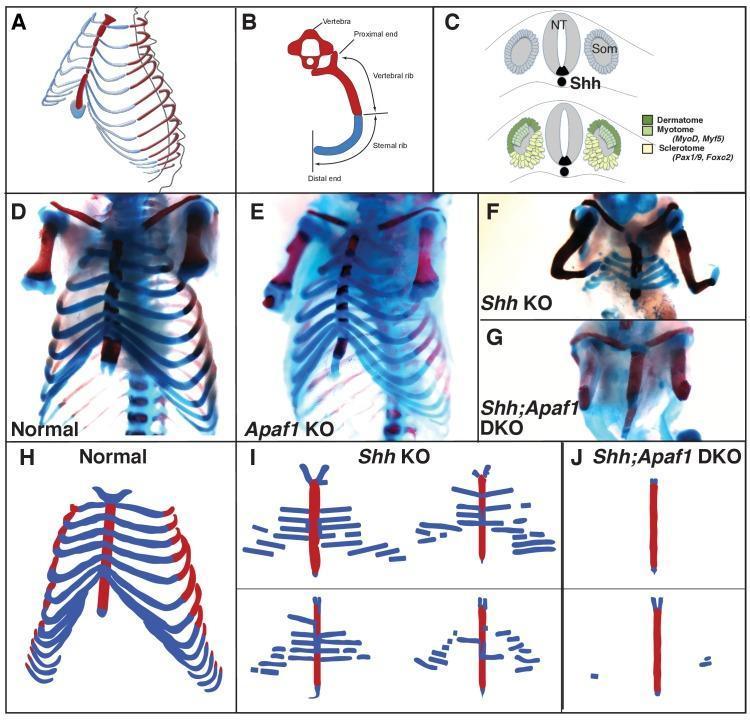
This composite educational graphic details rib cage development and skeletal defects in mouse embryos. Panel A provides a 3D perspective of the thoracic cage, while Panel B is a schematic defining the anatomy: the proximal/vertebral rib (bone, red) and distal/sternal rib (cartilage, blue). Panel C illustrates somite differentiation into dermatome, myotome, and sclerotome, highlighting Shh expression from the notochord. Panels D-G show E18.5 skeletal preparations using Alizarin red (bone) and Alcian blue (cartilage). Normal (D) and Apaf1 KO (E) embryos show 13 intact rib pairs and vertebrae. Shh KO (F) embryos display complete absence of vertebrae and proximal ribs, with mispatterned, discontinuous distal cartilaginous ribs. Shh;Apaf1 DKO (G) embryos exhibit the most severe phenotype, lacking both vertebrae and nearly all rib elements, leaving only the ossified sternum. Panels H-J provide stylized schematics summarizing these phenotypes. The visual highlights the essential role of Sonic Hedgehog signaling in sclerotome induction and the patterning of the proximal-distal axial skeleton.
Somites
Definition and Origin
Timing and Numbers
-
Somites appear first in the occipital region and proceed caudally
-
Between day 26 and day 32, 38-39 pairs form - this is called the "somite period"
-
By the end of week 5, 42-44 pairs are present
-
The full complement consists of:
- 4 occipital pairs
- 8 cervical pairs
- 12 thoracic pairs
- 5 lumbar pairs
- 5 sacral pairs
- 8-10 coccygeal pairs
-
The 1st occipital pair and the last 5-7 coccygeal pairs disappear
-
Because somites form with precise periodicity, counting somites is used to stage embryo age
-
The Developing Human, Clinically Oriented Embryology, p. 212
-
Langman's Medical Embryology, p. 100-101
Molecular Regulation of Somite Formation (Segmentation Clock)
| Pathway | Role |
|---|---|
| NOTCH signaling (Hairy1/HES7/HER1) | Core oscillator; Notch protein accumulates then decreases in presomitic mesoderm as each somite forms |
| WNT signaling | High caudally, promotes presomitic state |
| FGF8 + WNT3a | High caudally, low cranially; forms gradient controlling somite boundaries |
| Retinoic acid (RA) | High cranially, low caudally; counteracts FGF/WNT |
| Delta-Notch | Controls craniocaudal segmental patterning |
| Tbx6 (T-box gene) | Important role in somitogenesis |
| FoxC1, FoxC2 (forkhead transcription factors) | Expressed before somite formation |
- Creasy & Resnik's Maternal-Fetal Medicine, p. 1927
- Langman's Medical Embryology, p. 101
Somite Differentiation
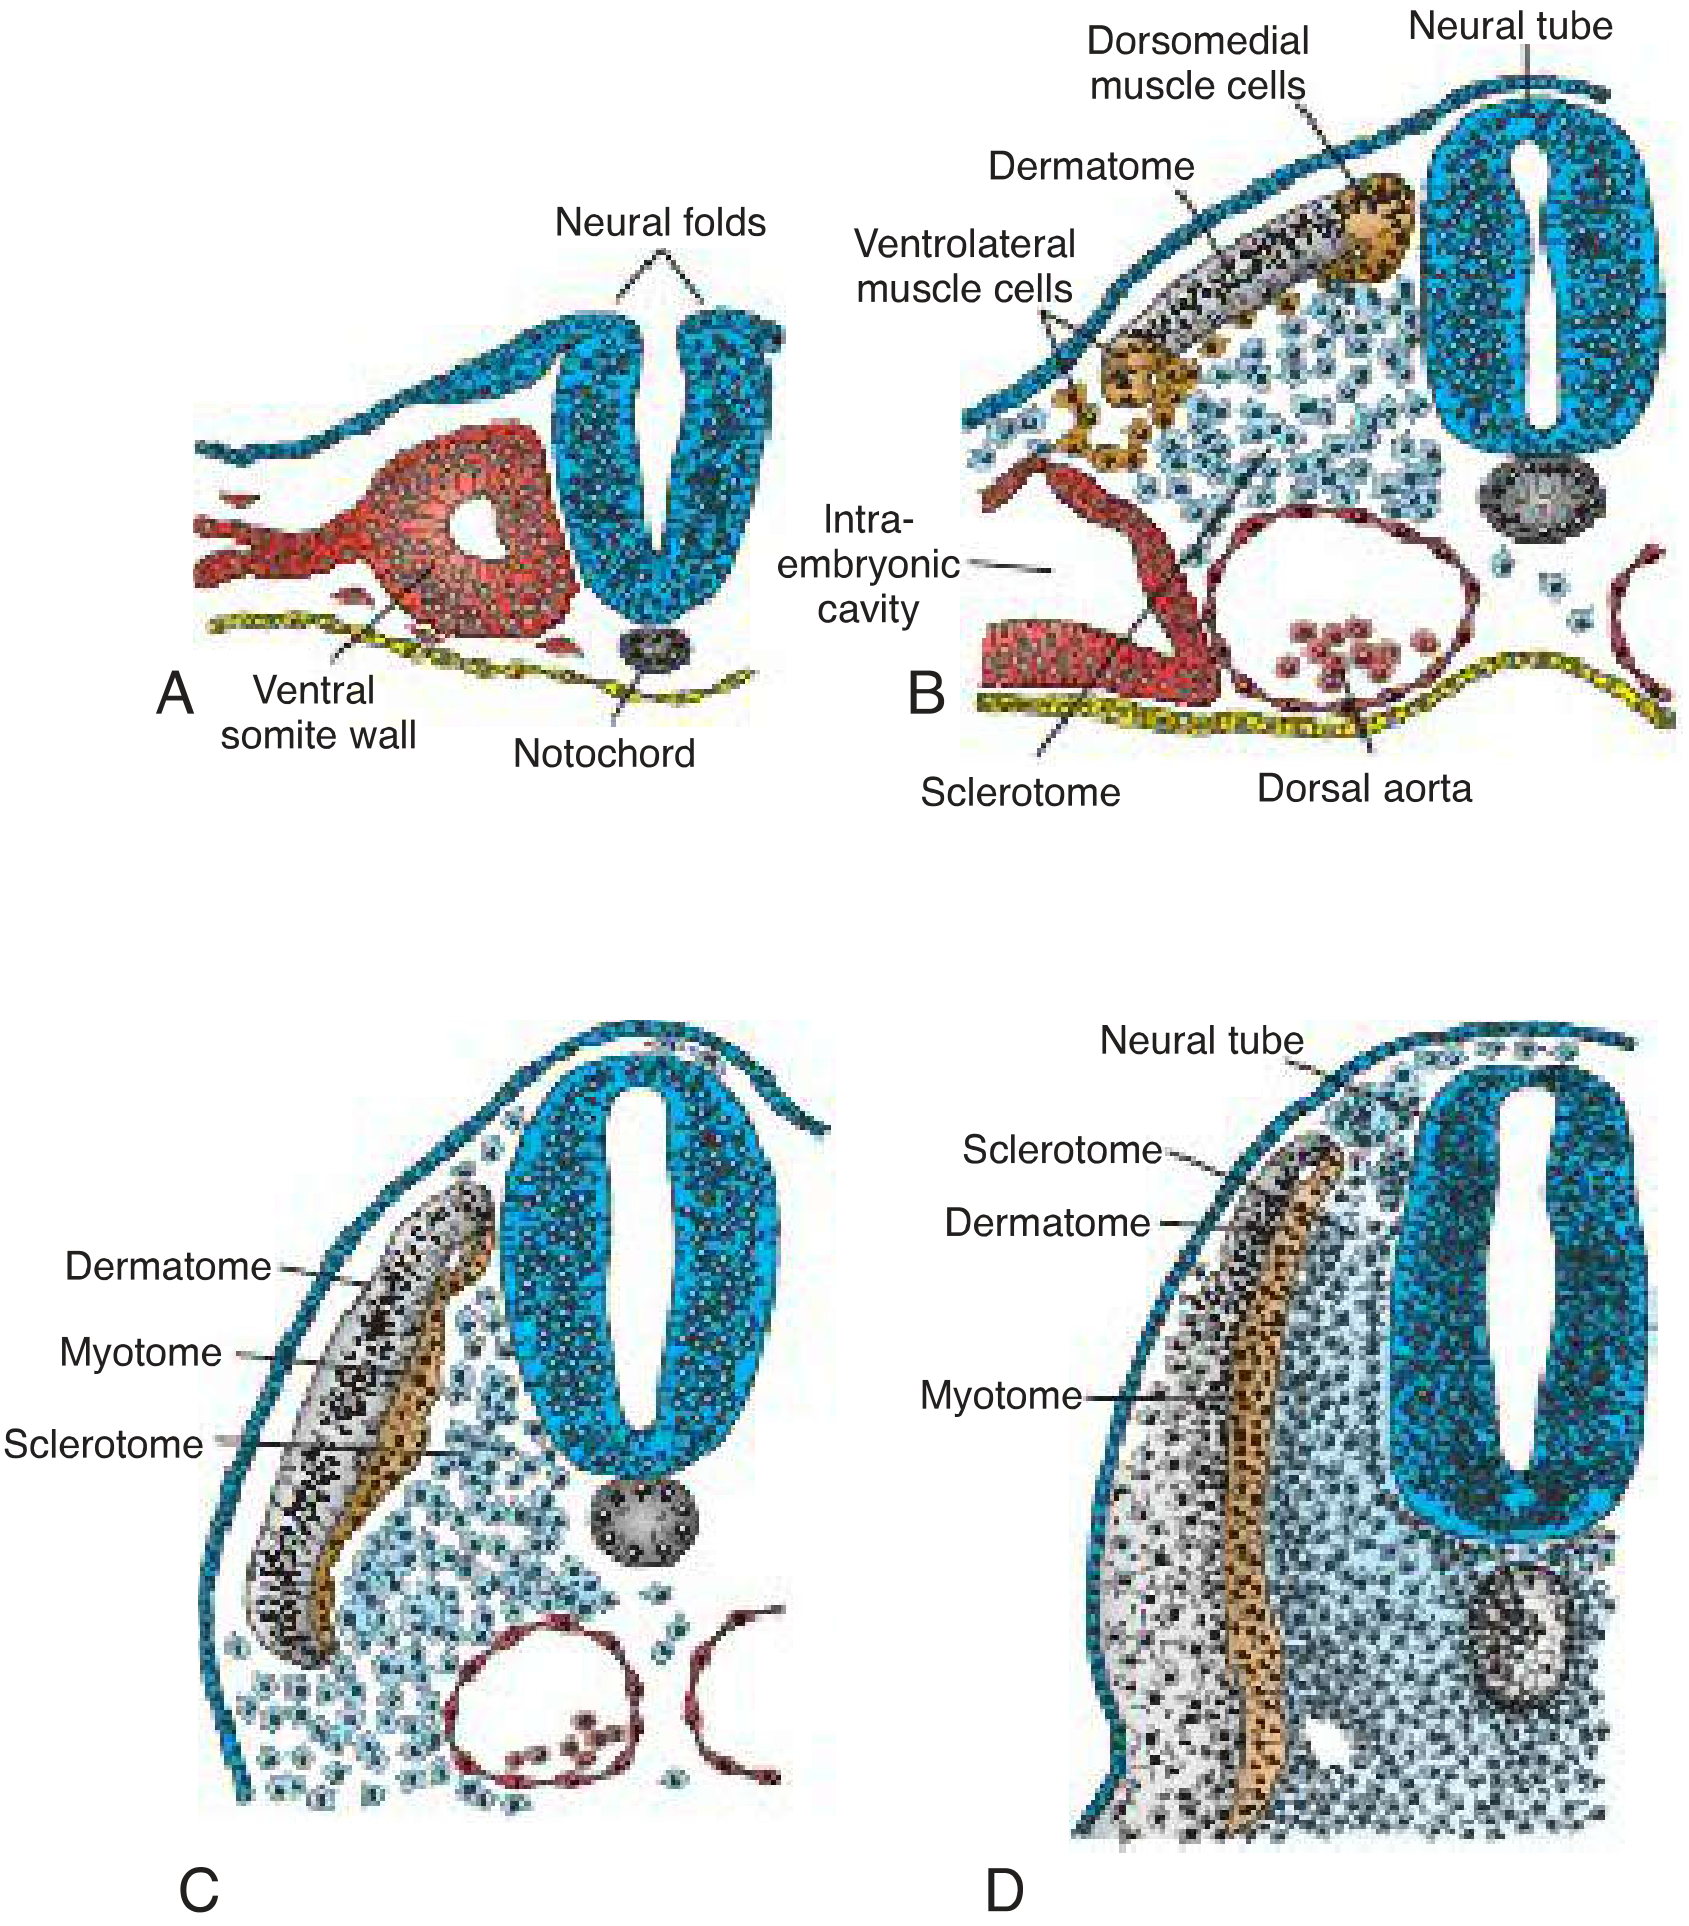
1. Sclerotome (ventromedial)
- Cells in the ventral and medial walls lose epithelial character, become mesenchymal again, and migrate to surround the neural tube and notochord
- Form the vertebrae and ribs
- Induced by SHH and NOGGIN from the notochord and floor plate
- Express transcription factor PAX1, which initiates chondrogenesis and vertebral formation
2. Dermomyotome (dorsolateral)
| Sub-region | Location | Derivatives | Key Genes |
|---|---|---|---|
| Myotome | Dorsomedial + ventrolateral edges | Axial (back) muscles, intercostals, limb muscles, body wall muscles | MYF5 (dorsomedial), MyoD (dorsolateral) |
| Dermatome | Mid-dorsal epithelium | Dermis of the back | NT-3 from dorsal neural tube |
- WNT proteins from the dorsal neural tube activate PAX3 to demarcate the dermomyotome and promote MYF5 expression (dorsomedial muscle precursors)
- BMP4 from lateral plate mesoderm + activating WNT from epidermis drives MYOD expression in dorsolateral muscle precursors
- Ventrolateral muscle precursor cells migrate into the lateral plate mesoderm to form muscles of the body wall (external/internal oblique, transversus abdominis) and most limb muscles
Key principle: Segmental innervation
- Langman's Medical Embryology, p. 102-103
Summary: What Somites Give Rise To
| Somite Region | Derivatives |
|---|---|
| Sclerotome | Vertebrae, ribs, intervertebral discs |
| Myotome | Axial back muscles, intercostals, some limb muscles |
| Dermatome | Dermis of the back |
| Ventrolateral myotome cells (migrate out) | Body wall muscles (obliques, transversus), most limb muscles |
Clinical Relevance
- Spondylocostal dysostosis: mutations in HES7 (segmentation clock) causing vertebral and rib defects
- Vertebral anomalies (hemivertebrae, fused vertebrae): mutations in genes involved in somitogenesis or somite patterning (HOX code disruption)
- Somite counting is used for precise embryo staging during the 4th-5th weeks
- HOX gene expression in the mesoderm controls regional vertebral identity (cervical vs. thoracic vs. lumbar) - distinct from HOX expression in the neural tube
Yolk sac
yolk sac embryology development diagram
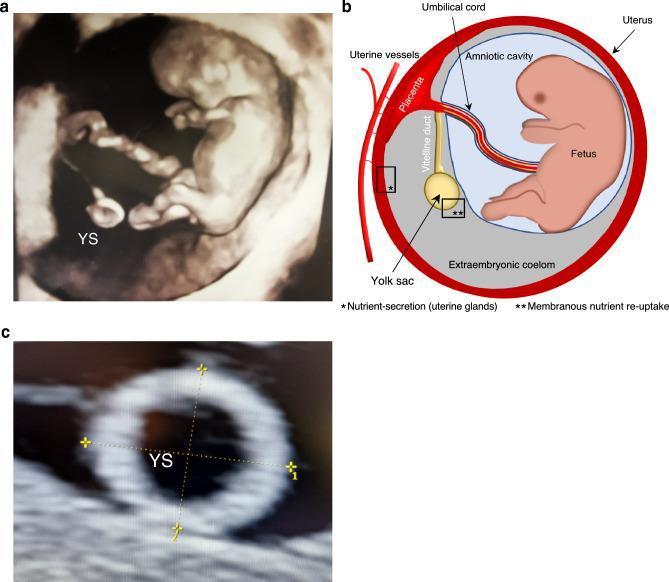
This composite educational graphic details first-trimester embryonic development and yolk sac (YS) anatomy. Panel (a) is a 3D ultrasound of a 10-week-old embryo, showing the echogenic fetus and its connection to the secondary yolk sac via the vitelline duct, set against hypoechoic amniotic fluid. Panel (b) provides a corresponding anatomical diagram illustrating the spatial relationship between the amniotic cavity containing the fetus and the extraembryonic coelom (exocoelomic cavity) housing the yolk sac. It highlights key structures including the placenta, umbilical cord, uterine vessels, and uterine glands. Labels indicate physiological processes like nutrient secretion from uterine glands and membranous re-uptake by the yolk sac. Panel (c) is a high-magnification 2D ultrasound demonstrating the clinical method for measuring yolk sac size using two perpendicular outer-to-outer diameters. The image serves as a reference for early obstetric imaging, fetal-maternal nutrient exchange mechanisms, and standard sonographic biometry during the first trimester.
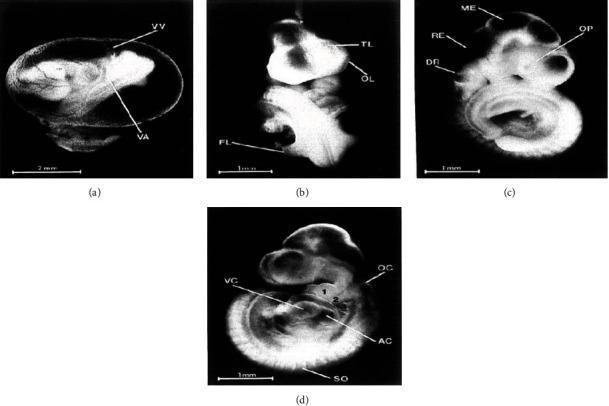
A series of four microphotographs (a-d) documenting the morphological development and organogenesis of a twelve-day-old rat embryo, used as a model for vertebrate embryology. Image (a) depicts the embryo within an intact yolk sac, highlighting the vitelline artery (VA) and vitelline vein (VV) which form the early yolk sac circulation. Images (b), (c), and (d) show the embryo with the yolk sac removed to reveal specific primordial structures. Key anatomical features identified include the telencephalon (TL), olfactory plate (OL), and forelimb bud (FL) in the anterior/cephalic region; the mesencephalon (ME), rhombencephalon (RE), optic primordia (OP), and otic structures (dorsal recess of otocyst, DR; otocyst, OC) in the mid-section; and the primitive heart chambers (atrium commune, AC; ventriculus communis, VC) and posterior somites (SO). The collection illustrates the cephalocaudal progression of development and is intended for educational study of musculoskeletal, neurological, and cardiovascular system initiation during the embryonic period.
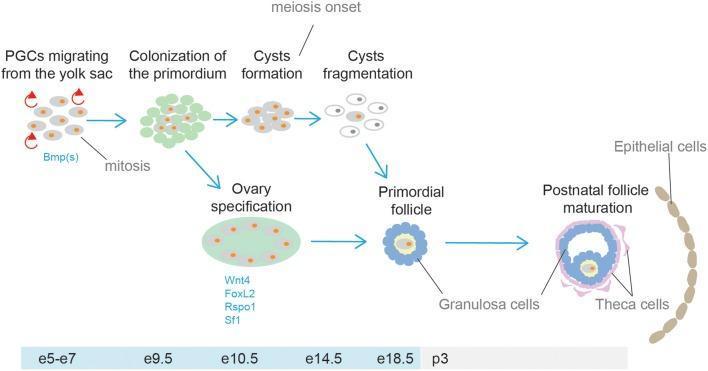
This medical schematic illustrates the developmental stages of the human ovary and oogenesis, from embryonic migration to postnatal maturation. The timeline begins with primordial germ cells (PGCs) migrating from the yolk sac (e5-e7), influenced by Bmp signaling and undergoing mitosis. By e9.5, these cells colonize the gonadal primordium, followed by ovary specification (e10.5) involving key transcription factors and signaling molecules like Wnt4, FoxL2, Rspo1, and Sf1. The diagram highlights the formation of germ cell cysts through incomplete cytokinesis and the subsequent onset of meiosis at e14.5. Following cyst fragmentation, the development of primordial follicles is shown around e18.5, characterized by a single oocyte surrounded by pre-granulosa cells. The final stage depicted is postnatal follicle maturation (p3), showing the structural organization of an antral follicle with defined layers of granulosa cells and theca cells, situated near the ovarian epithelial cells. This illustration is an educational resource for embryology and reproductive biology.
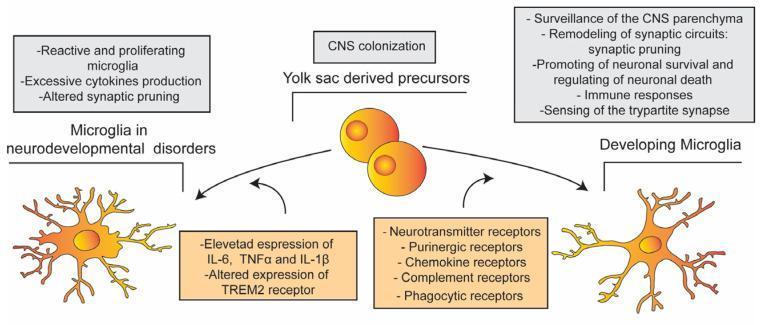
This pathophysiology diagram illustrates the development and functional divergence of microglia in healthy versus neurodevelopmental disorder states. At the center, the 'Yolk sac derived precursors' represent the embryonic origin of these cells during central nervous system (CNS) colonization. Two developmental pathways are depicted. On the right, 'Developing Microglia' represent the healthy state, characterized by ramified morphology with long, thin processes. Their associated functions include CNS surveillance, synaptic pruning, neuronal survival regulation, and sensing of the tripartite synapse. On the left, 'Microglia in neurodevelopmental disorders' are shown with a more reactive morphology, featuring shorter, thicker, and more branched processes. This pathological state is associated with microglial proliferation, excessive cytokine production (IL-6, TNFα, IL-1β), altered TREM2 receptor expression, and dysfunctional synaptic pruning. Centrally listed receptors—including neurotransmitter, purinergic, chemokine, complement, and phagocytic receptors—underlie the sensory capabilities of both states. The diagram serves as an educational summary of how microglial dysfunction contributes to pathologies like Autism Spectrum Disorder (ASD) and Schizophrenia (SZ).
The Yolk Sac
Important Note on Terminology
Formation: Primary vs. Secondary Yolk Sac
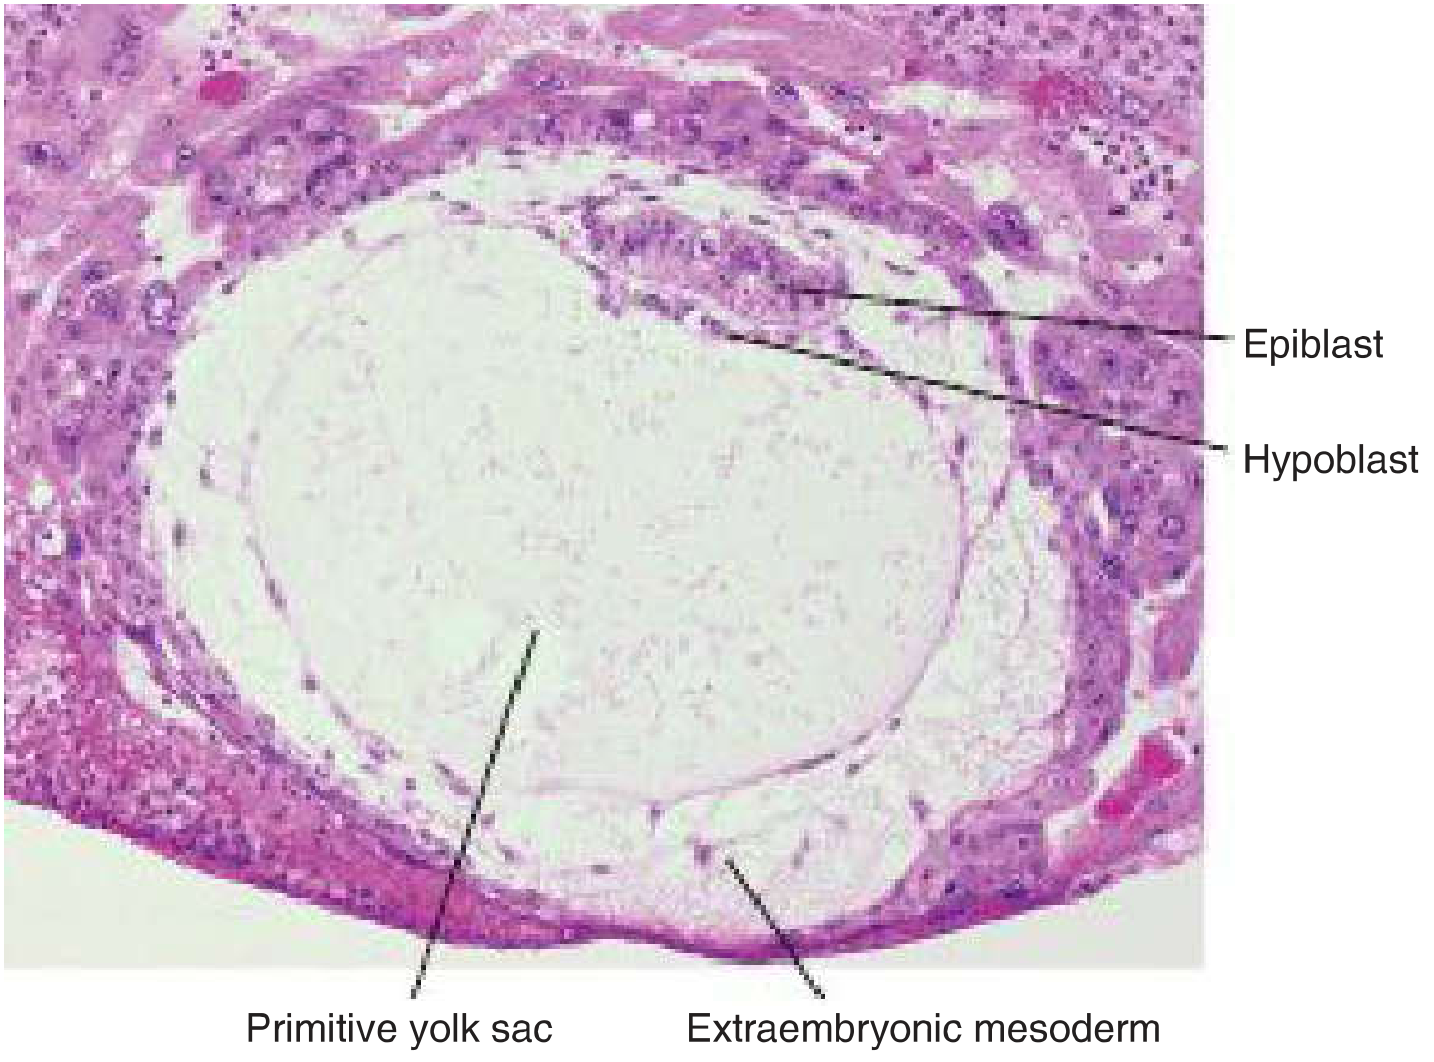
1. Primary Yolk Sac (Primitive Yolk Sac)
- Forms around day 8-9 when hypoblast cells line the blastocyst cavity, creating the exocoelomic cavity (Heuser's cavity)
- Bounded by: hypoblast above and exocoelomic membrane (Heuser's membrane) below
2. Secondary Yolk Sac (Definitive Yolk Sac)
- Forms by day 13 when hypoblast cells proliferate and migrate along the inside of the exocoelomic membrane, creating a new, smaller cavity
- The original exocoelomic cavity is pinched off, leaving exocoelomic cysts in the chorionic cavity
- Surrounded by extraembryonic splanchnic mesoderm
- Connected to the embryo via the vitelline (yolk) duct / yolk stalk
-
Extraembryonic somatic mesoderm = lines cytotrophoblast + covers amnion
-
Extraembryonic splanchnic mesoderm = covers the yolk sac
-
Langman's Medical Embryology, p. 72-73
-
The Developing Human, p. 161-162
Functions of the Yolk Sac
| Function | Details |
|---|---|
| Early nutrition | Absorbs nutritive fluid from lacunar spaces and transfers it to the embryo before placentation |
| Primary hematopoiesis | First site of blood cell formation (3rd week); "blood islands" form in its wall - the yolk-sac phase |
| Origin of tissue-resident macrophages | Microglia (brain), Kupffer cells (liver), alveolar macrophages arise from yolk sac progenitors and migrate to their respective organs early in embryogenesis |
| Primordial germ cells (PGCs) | PGCs arise in the posterior wall of the yolk sac at ~3 weeks and migrate along the mesentery of the hindgut to reach the gonads by week 5 |
| Contribution to gut | The midgut remains temporarily connected to the yolk sac via the vitelline duct - the midgut endoderm is continuous with yolk sac endoderm |
- Langman's Medical Embryology, p. 109
- Histology: A Text and Atlas, p. 733
Hematopoiesis: The Yolk Sac Phase
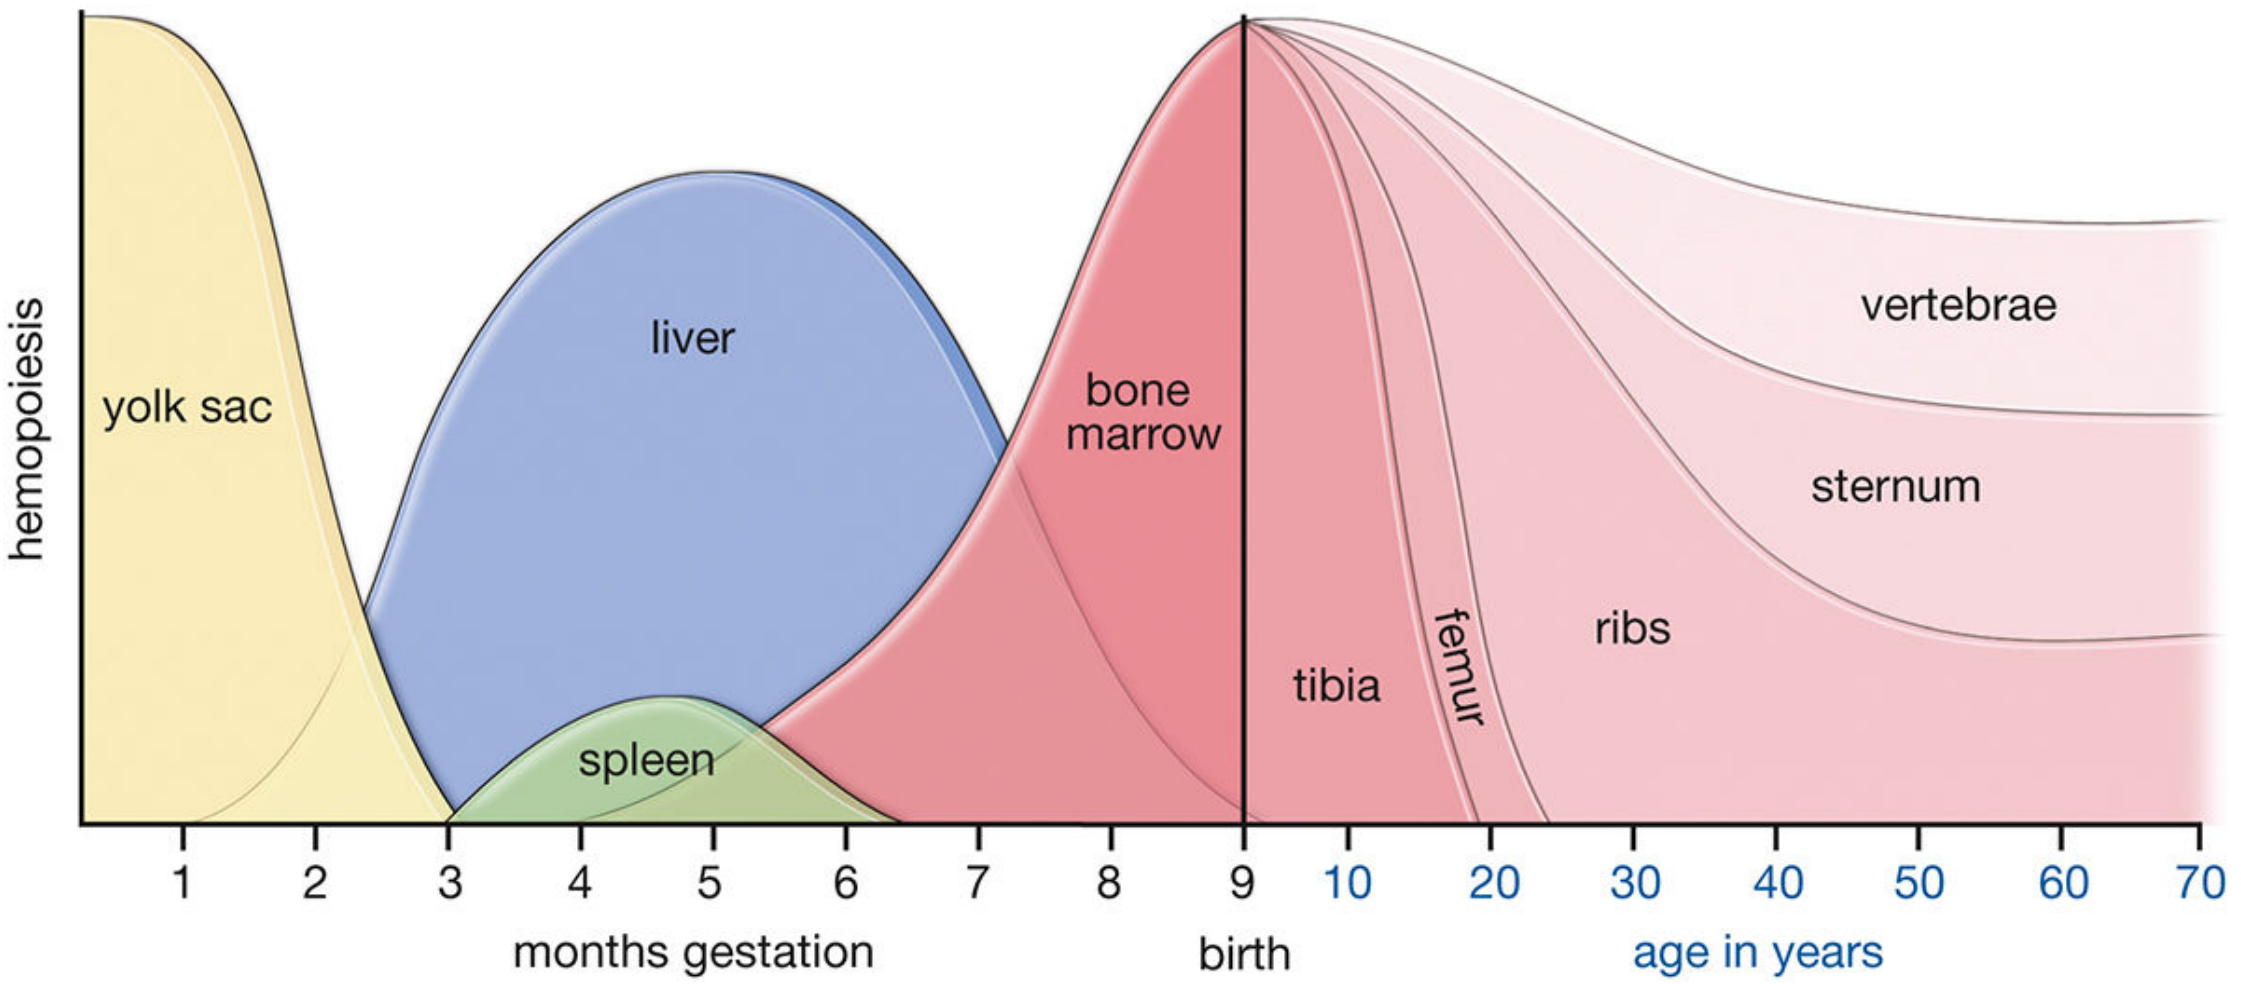
| Phase | Site | Timing |
|---|---|---|
| Phase 1 | Yolk sac | Weeks 3-8 (gestation months 1-2) |
| Phase 2 | Liver (major) + spleen (minor) | 2nd trimester |
| Phase 3 | Bone marrow | 3rd trimester onward; persists through life |
- Histology: A Text and Atlas (Histology A Text and Atlas), p. 733
- Robbins, Cotran & Kumar Pathologic Basis of Disease
Fate of the Yolk Sac
- As the embryo folds (weeks 3-4), the yolk sac is partially incorporated into the embryo as the primitive gut
- The vitelline duct (yolk stalk) narrows and is eventually obliterated by week 5-6
- The yolk sac itself shrinks and becomes a small vestige at the base of the umbilical cord
- By the end of week 5, the yolk sac duct, allantois, and umbilical vessels are restricted to the umbilical region
Clinical Relevance
1. Meckel's Diverticulum
2. Yolk Sac Tumor (Endodermal Sinus Tumor)
- Second most common malignant ovarian germ cell tumor
- Derived from malignant germ cells differentiating along yolk sac lineage
- Secretes alpha-fetoprotein (AFP) - used as a tumor marker and for monitoring
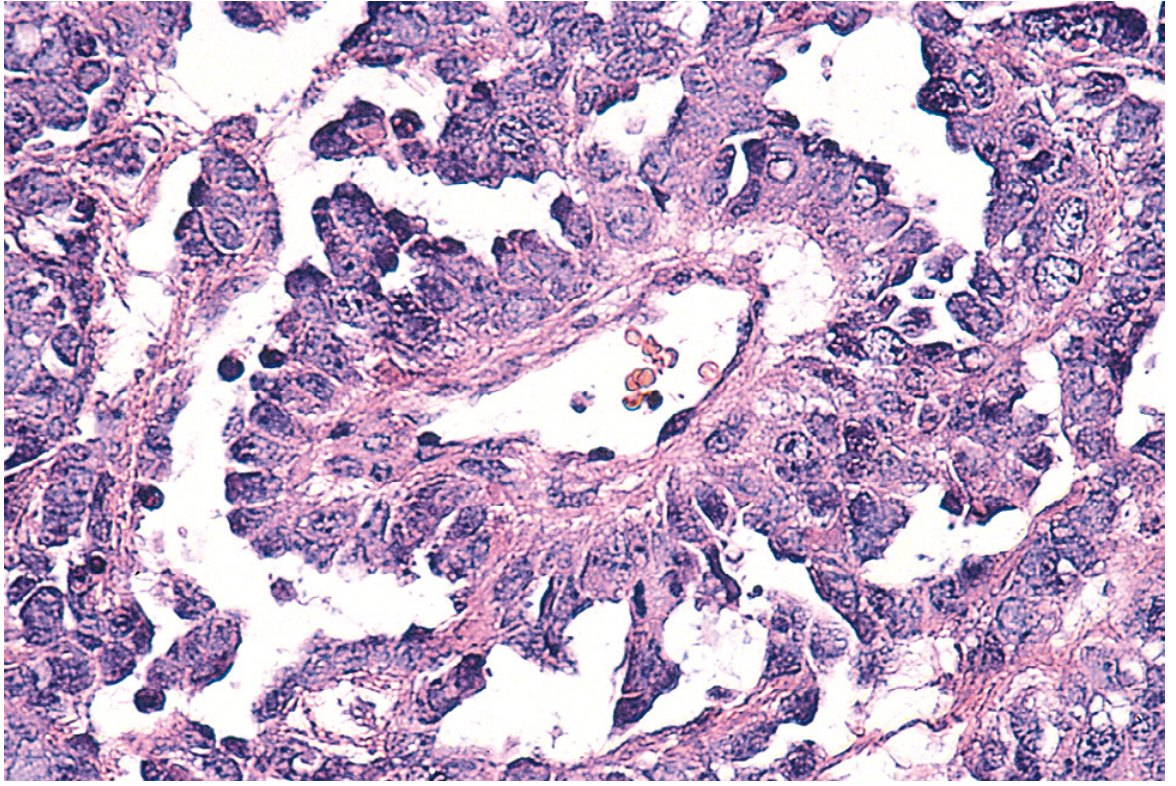
- Histological hallmark: Schiller-Duval body (glomerulus-like structure with central blood vessel enveloped by tumor cells)
- Intracellular/extracellular hyaline droplets stain for AFP by immunoperoxidase
- Most common in children and young females; presents with abdominal pain and rapid pelvic mass growth
- Stage I-II: >95% 5-year survival with combination chemotherapy
-
Also occurs in the testis (most common testicular GCT in children under 3) and other extragonadal sites
-
AFP is also elevated in hepatocellular carcinoma, neural tube defects, and normal fetal liver
-
Robbins, Cotran & Kumar Pathologic Basis of Disease, p. 947
Summary
| Feature | Detail |
|---|---|
| Origin | Hypoblast (primitive endoderm) |
| Type | Extraembryonic membrane |
| First appears | Day 8-9 (primary); Day 13 (secondary) |
| Connection to embryo | Vitelline duct (obliterates by week 5-6) |
| Key functions | Early nutrition, hematopoiesis, PGC origin, gut endoderm contribution, tissue macrophage origin |
| Fate | Incorporated into primitive gut; vestige at umbilical cord base |
| Pathological relevance | Yolk sac tumor (AFP+, Schiller-Duval bodies); Meckel's diverticulum (vitelline duct remnant) |
Amnion
amnion amniotic cavity embryo development diagram
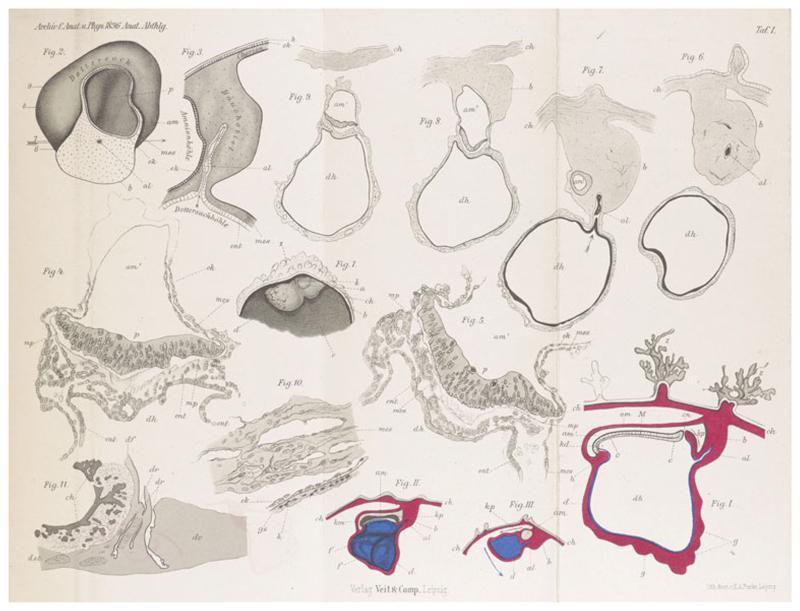
A historical anatomical plate comprising semi-schematic diagrams and illustrations of early human embryos, specifically the 'Gle' and 'v.H.' specimens, as documented by Graf v. Spee (1896). The layout includes profile views, median sections, and serial cross-sections organized to demonstrate early gestational development. Key features include the amnion (am), chorion (ch), and yolk sac/diencephalon (dh) structures. Figures I and II illustrate the 'Gle' embryo via semi-schematic median sections and profile views, highlighted with blue and red contrasting tones to show embryonic layers and blood vessel precursors. Figures III and 1-11 represent various sections of the 'v.H.' embryo, showing the morphology of the embryonic disc, allantois (al), and primitive streak area. The illustrations focus on the spatial relationships between the amniotic cavity, the embryonic body, and the surrounding extraembryonic membranes, providing foundational observations in human embryology and early morphogenesis.
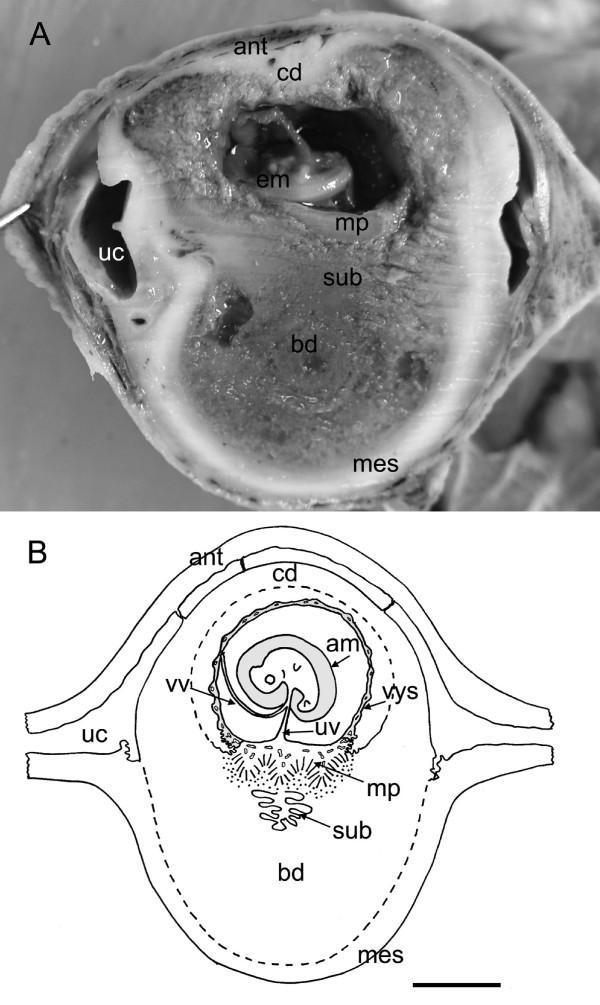
This educational composite presents a macro photograph (A) and a corresponding schematic diagram (B) of a mammalian implantation site during the late limb bud stage of embryonic development. The median sagittal section illustrates the spatial relationship between the embryo (em) and maternal-fetal structures. Key anatomical landmarks include the embryo enclosed within the amnion (am) and visceral yolk sac (vys), the latter supplied by vitelline vessels (vv). The placental complex is situated on the mesometrial side (mes), consisting of a main placenta (mp) and a specialized subplacenta (sub) anchored to the basal decidua (bd). Opposing this, a prominent thick capsular decidua (cd) faces the antimesometrial wall (ant) of the uterus. The uterine cavity (uc) is visible as a distinct space lateral to the conceptus. The image serves to demonstrate the inverted yolk sac placental arrangement and the relative positioning of chorioallantoic and vitelline vascular systems in hystricomorph development. Labels also highlight umbilical vessels (uv) supplying the placental disk.
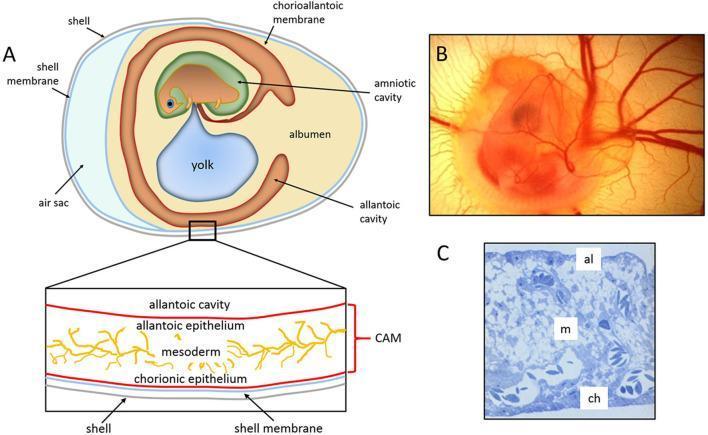
This composite educational graphic details the structure and development of the chick embryo chorioallantoic membrane (CAM), a common in vivo model for studying angiogenesis and inflammation. Panel A presents a schematic anatomical diagram of a 5-day-old embryo in ovo, labeling the shell, shell membrane, air sac, albumen, yolk, and amniotic cavity. A high-magnification cross-section illustrates the CAM's trilaminar structure: the allantoic epithelium (inner), the vascularized mesoderm, and the chorionic epithelium (outer, adjacent to the shell membrane). Panel B shows a clinical-style photograph of a 5-day-old chick embryo in ovo, demonstrating a dense radiating network of blood vessels consistent with early-stage angiography. Panel C provides a histological semithin section of a 12-day-old CAM, stained to highlight cellular morphology. The labels identify the allantoic epithelium (al), the thick stromal mesoderm (m) containing numerous cross-sections of blood vessels and capillaries, and the chorionic epithelium (ch). This content is relevant for researchers studying developmental biology, vascular pathologies, and wound healing models.
This composite educational graphic details first-trimester embryonic development and yolk sac (YS) anatomy. Panel (a) is a 3D ultrasound of a 10-week-old embryo, showing the echogenic fetus and its connection to the secondary yolk sac via the vitelline duct, set against hypoechoic amniotic fluid. Panel (b) provides a corresponding anatomical diagram illustrating the spatial relationship between the amniotic cavity containing the fetus and the extraembryonic coelom (exocoelomic cavity) housing the yolk sac. It highlights key structures including the placenta, umbilical cord, uterine vessels, and uterine glands. Labels indicate physiological processes like nutrient secretion from uterine glands and membranous re-uptake by the yolk sac. Panel (c) is a high-magnification 2D ultrasound demonstrating the clinical method for measuring yolk sac size using two perpendicular outer-to-outer diameters. The image serves as a reference for early obstetric imaging, fetal-maternal nutrient exchange mechanisms, and standard sonographic biometry during the first trimester.
The Amnion
Definition and Origin
- The epiblast forms the floor of the amniotic cavity and is continuous peripherally with the amnion
- The amnion is initially a small sac; it expands enormously throughout development
Development and Growth
| Stage | What happens |
|---|---|
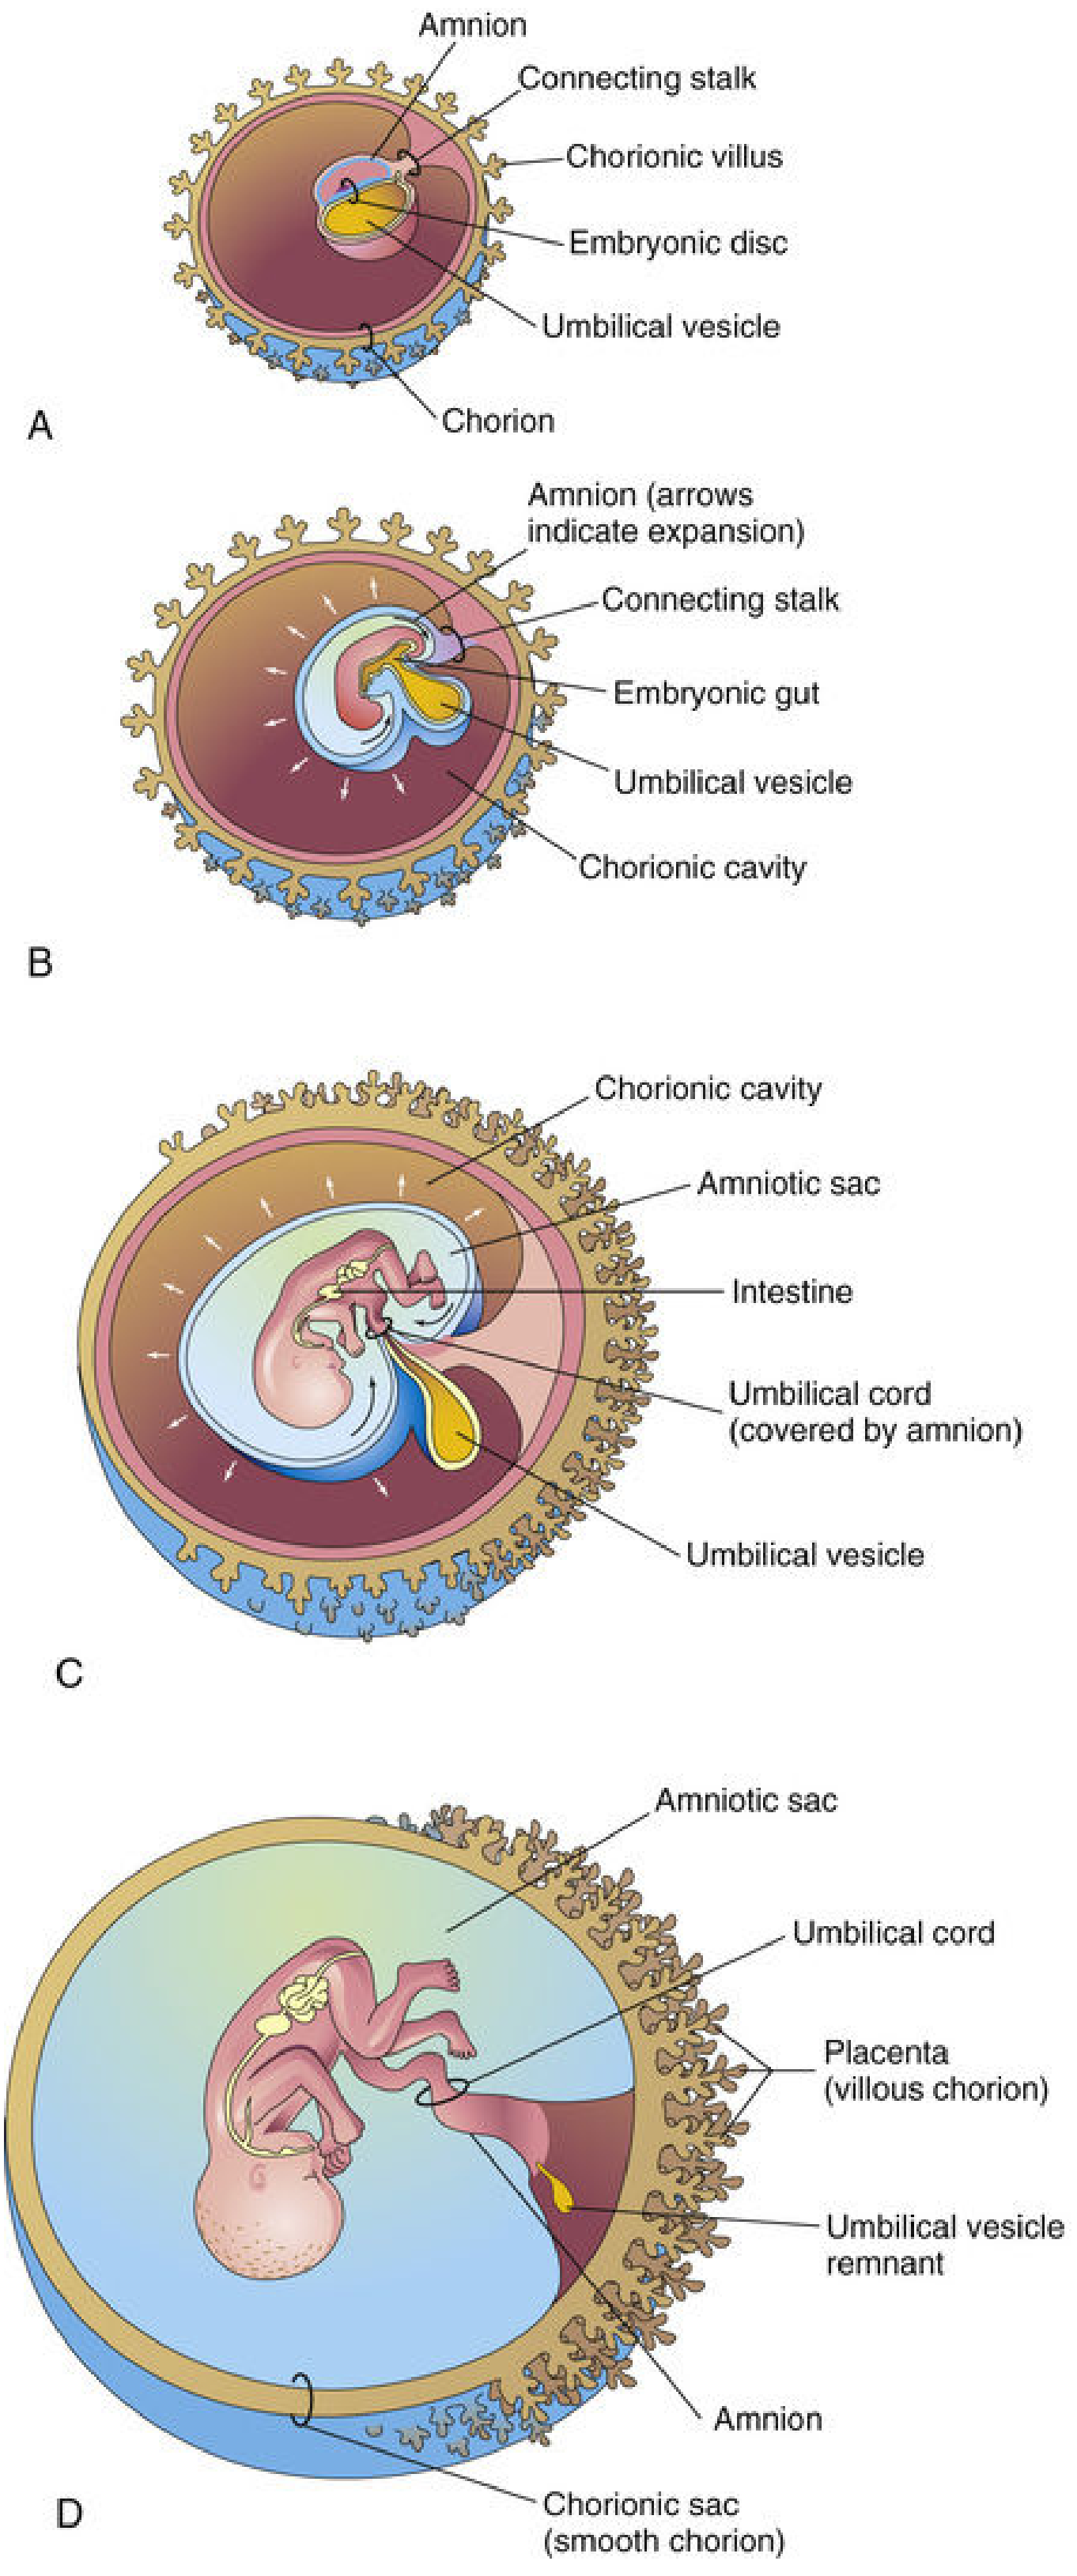
| Week 2 | Amnioblasts from epiblast create the tiny amniotic cavity; amnion forms as a thin membrane |
| Weeks 3-4 | Amnion expands as embryo folds; amniotic cavity enlarges |
| Weeks 8-10 | Expanding amnion contacts and fuses with the chorion, obliterating the chorionic (extraembryonic coelomic) cavity |
| Week 10+ | The fused amnion + chorion form the amniochorionic membrane |
| End of week 5 | Amnion covers the umbilical cord, providing its epithelial covering |
Structure of the Amnion
- Single layer of flat-to-cuboidal epithelial cells (amnioblasts/amnion epithelium)
- Backed by a thin layer of extraembryonic somatic mesoderm (connective tissue)
- Avascular - no blood vessels
- Tough yet flexible; resists tearing under normal pressures
Amniotic Fluid
Sources of Amniotic Fluid
| Source | Timing |
|---|---|
| Amnion secretion | Earliest stage |
| Diffusion from maternal tissue/interstitial fluid across amniochorionic membrane (from decidua parietalis) | Early weeks |
| Diffusion through chorionic plate from intervillous blood | Later |
| Fetal skin (before keratinization) - water and solutes diffuse through | Until ~19-20 weeks |
| Fetal respiratory tract | Contributes 300-400 mL/day |
| Fetal urine (begins week 11) | ~500 mL/day by late pregnancy |
Volume of Amniotic Fluid
| Gestational age | Volume |
|---|---|
| 10 weeks | ~30 mL |
| 20 weeks | ~350 mL |
| 37 weeks | 700-1000 mL (normal maximum) |
Circulation of Amniotic Fluid
- The water content changes every 3 hours
- Large amounts pass through the amniochorionic membrane into maternal tissue
- Fluid exchanges with fetal blood through the umbilical cord and where amnion adheres to the chorionic plate
- The fetus swallows up to 400 mL/day in late pregnancy; this fluid is absorbed by the respiratory and digestive tracts
- Waste products cross the placental membrane into maternal blood; water is re-excreted by fetal kidneys back into the sac
Composition
- Equal portions of organic compounds and inorganic salts
- Half of organic constituents = proteins; the other half = carbohydrates, fats, enzymes, hormones, pigments
- Desquamated fetal epithelial cells (used in amniocentesis)
- Fetal urine products (from week 11)
Functions of Amniotic Fluid
- Permits symmetric external growth of the embryo/fetus
- Acts as a barrier to infection
- Permits normal fetal lung development (fluid inhalation is needed for lung maturation)
- Prevents adhesion of the amnion to the embryo
- Cushions the fetus against trauma (distributes mechanical impacts)
- Thermal regulation - maintains relatively constant temperature
- Enables free fetal movement, aiding muscular development
- Assists in maintaining fluid and electrolyte homeostasis
Clinical Relevance
1. Amniocentesis
- Removal of amniotic fluid, typically at 16 weeks gestation
- Fetal cells cultured for karyotyping (chromosomal anomalies, e.g., trisomy 21/Down syndrome)
- AFP levels: elevated in neural tube defects; low in trisomy 21
- Studies of fetal enzyme systems, amino acids, and hormones
2. Oligohydramnios (low amniotic fluid)
- Preterm rupture of the amniochorionic membrane (~10% of pregnancies; most common cause)
- Renal agenesis - absent fetal urine contribution
- Obstructive uropathy - urinary tract obstruction
- Placental insufficiency with diminished blood flow
- Pulmonary hypoplasia (lungs need fluid to develop)
- Facial and limb defects from fetal compression by uterine wall
- Potter sequence (in renal agenesis): lethal pulmonary hypoplasia, characteristic facies, limb defects
- Umbilical cord compression
3. Polyhydramnios (excess amniotic fluid)
- Idiopathic in 60% of cases
- Maternal factors (20%)
- Fetal in origin (20%): esophageal atresia, other GI blockages (fluid cannot be swallowed/absorbed), anencephaly/meroencephaly (CNS defects impairing swallowing)
- Diagnosed by ultrasonography
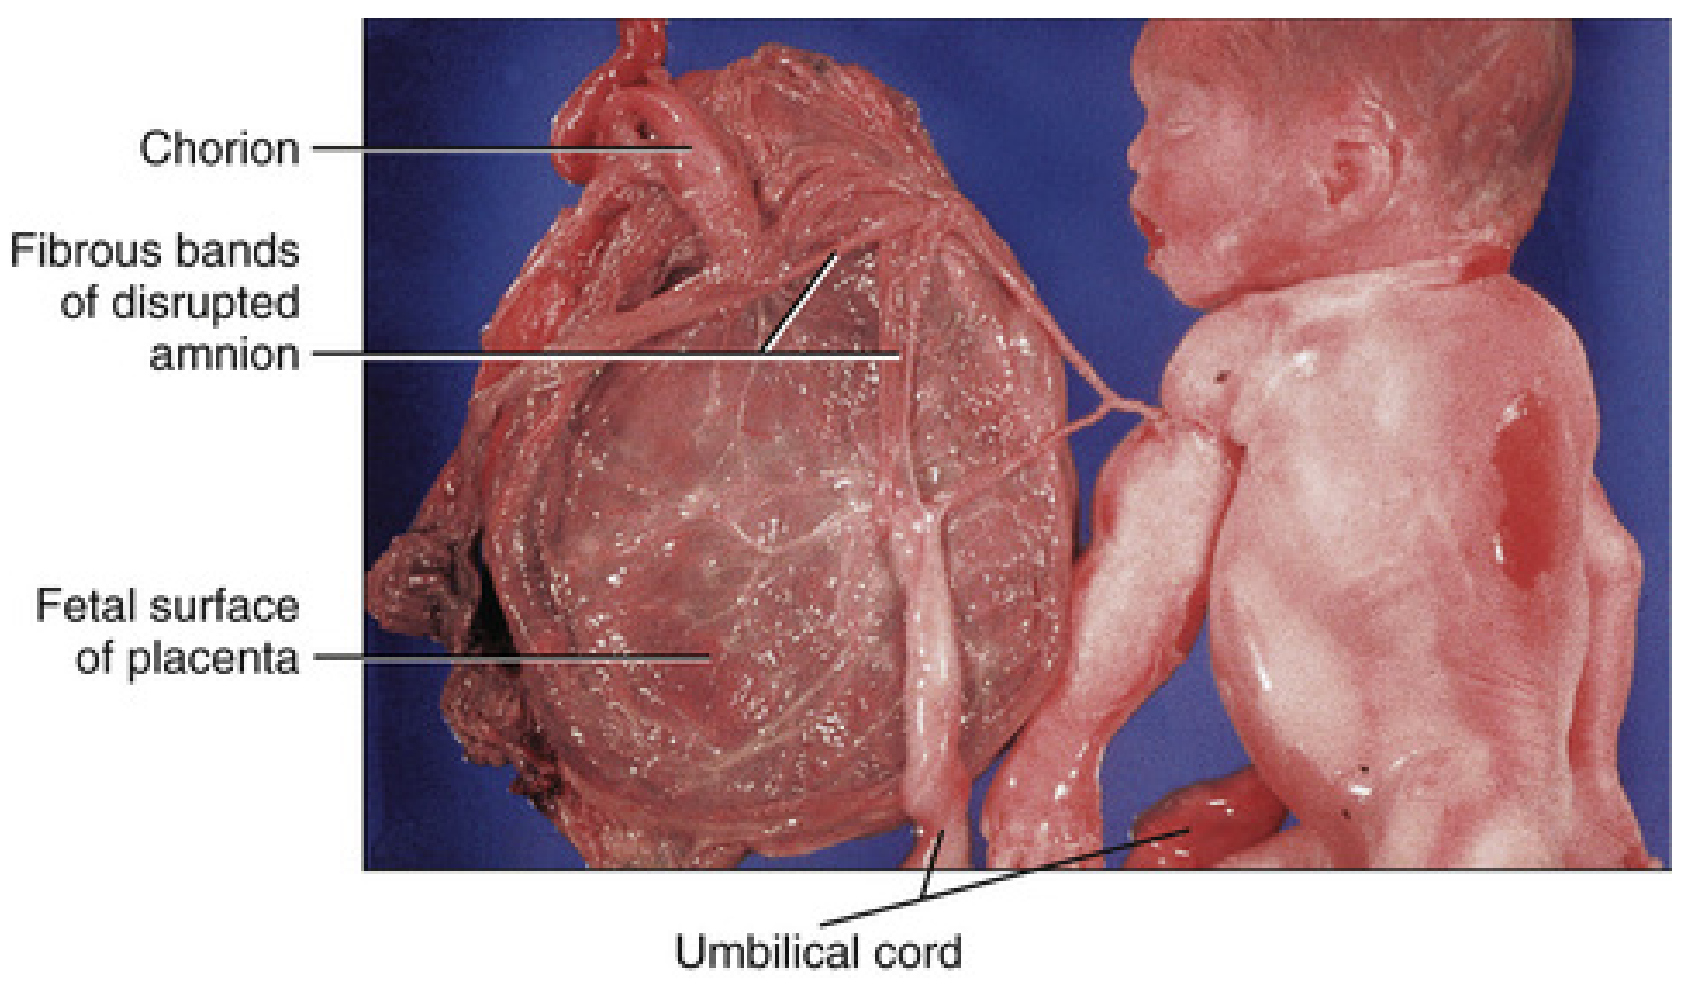
4. Amniotic Band Syndrome (ABS)
- Incidence: 1 in 1200 live births
- Defects range from simple digital constrictions to major craniofacial and visceral anomalies
- Two causes:
- Exogenous: delamination of amnion (rupture/tearing) creating encircling amniotic bands
- Endogenous: vascular disruption
- Prenatal ultrasound can diagnose ABS
5. Premature Rupture of Membranes (PROM/PPROM)
- Premature rupture of the amniochorionic membrane is the most common event leading to premature labor and delivery
- Loss of amniotic fluid removes the major protection against infection
Summary Table
| Feature | Detail |
|---|---|
| Origin | Epiblast (amnioblasts) |
| Forms | ~Day 8 |
| Structure | Single epithelial layer + extraembryonic somatic mesoderm; avascular |
| Fluid volume at term | 700-1000 mL |
| Fluid turnover | Every 3 hours |
| Fuses with chorion | ~Week 8-10 (forms amniochorionic membrane) |
| Covers | Umbilical cord (epithelial lining) |
| Key functions | Protection, lung development, fetal movement, thermal regulation, infection barrier |
| Too little fluid | Oligohydramnios → Potter sequence, pulmonary hypoplasia |
| Too much fluid | Polyhydramnios → esophageal atresia, CNS defects |
| Band disruption | Amniotic Band Syndrome (1/1200 births) |
- The Developing Human, Clinically Oriented Embryology, p. 382-390
Primitive streak
primitive streak gastrulation embryonic disc epiblast mesoderm
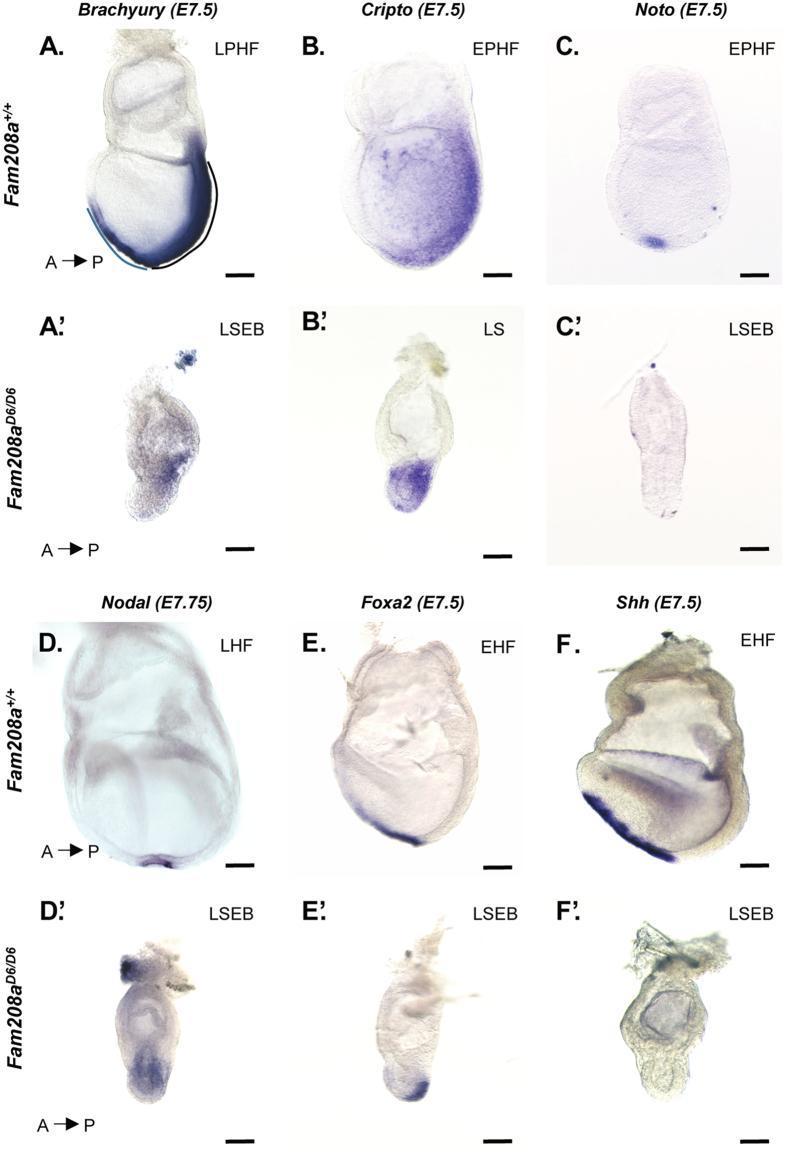
This composite panel presents whole-mount in situ hybridization (WISH) images of mouse embryos at embryonic days E7.5–E7.75, comparing wild-type (Fam208a+/+) and Fam208aD6/D6 mutant phenotypes during gastrulation. The series evaluates several key developmental markers: Brachyury (A-A'), Cripto (B-B'), Noto (C-C'), Nodal (D-D'), Foxa2 (E-E'), and Shh (F-F'). Wild-type embryos demonstrate normal gastrulation progression, characterized by elongated primitive streaks (PS) and established nodes. In contrast, mutant embryos exhibit severe developmental arrest and gastrulation failure. Visual evidence shows a significantly shortened Brachyury-positive primitive streak and a delayed, truncated Cripto expression domain. Notably, markers of the organizer (node) and anterior mesendoderm—including Noto, Nodal, and Shh—are absent or severely reduced in the mutant distal epiblast. Foxa2 expression in mutants is restricted to the posterior region, failing to migrate anteriorly. These findings illustrate that loss of Fam208a leads to failed primitive streak elongation and defective specification of the anterior-posterior axis, with mutant embryos arrested at the Late Streak/Early Allantoic Bud (LSEB) stage while controls reach Late Head Fold (LHF) stages.
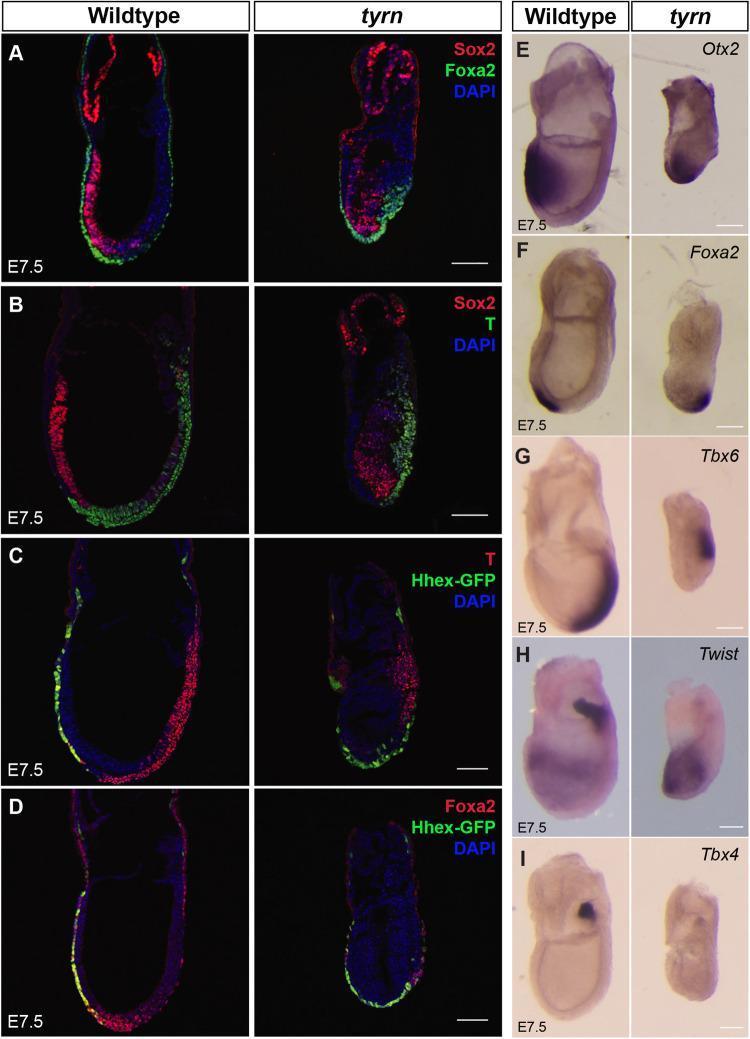
Educational developmental biology panel comparing wildtype and 'tyrn' (Pold1 hypomorph) mouse embryos at embryonic day E7.5. (A-D) Immunofluorescence (IF) images showing key gastrulation markers. Wildtype embryos display a well-extended primitive streak and organized anterior-posterior (A-P) axis, with Sox2 (red) marking the anterior neuroectoderm and Foxa2/T (Brachyury) labeling axial mesoderm and the primitive streak. In tyrn mutants, Sox2 is restricted to the distal tip, and T-staining reveals a significantly shortened primitive streak reaching only the posterior midpoint. (E-I) Whole-mount in situ hybridization (WISH) compares gene expression patterns. In mutants, Otx2 expression is shifted distally rather than anteriorly. Paraxial mesoderm marker Tbx6 is restricted to the posterior-proximal region in mutants, confirming defective primitive streak elongation. Twist and Tbx4 staining highlight a severe deficiency in extraembryonic mesoderm formation, particularly in the allantois, which is absent or drastically reduced in tyrn mutants. These visuals illustrate how impaired DNA synthesis due to Pold1 mutation disrupts cell proliferation, leading to failure in primitive streak extension and aberrant A-P axis orientation during mammalian gastrulation.
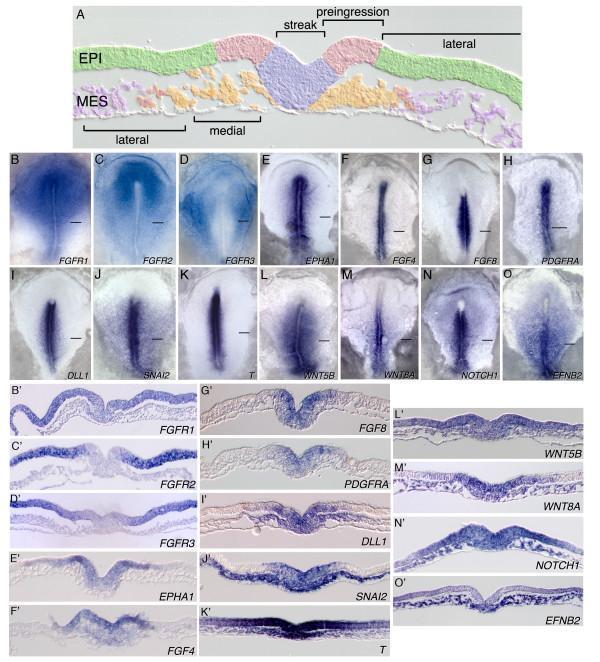
Educational developmental biology composite illustrating gene expression patterns during gastrulation in a stage 4 chicken embryo. Figure A: Schematic transverse section defining key morphological domains: lateral epiblast (green), preingression epiblast (pink), primitive streak (lavender), medial mesoderm (orange), and lateral mesoderm (purple). Panels B-O: Whole-mount in situ hybridization (ISH) images showing mRNA localization for 14 signaling molecules and receptors, including FGFR1-3, EPHA1, FGF4/8, PDGFRA, DLL1, SNAI2, T (Brachyury), WNT5B/8A, NOTCH1, and EFNB2. Panels B'-O': Corresponding transverse histological sections providing high-resolution visualization of spatial distribution across tissue layers. Distinctive staining patterns demonstrate differential expression: FGFR2/3 are localized to the lateral epiblast; EPHA1, FGF4/8, and DLL1 are concentrated in the preingression epiblast and primitive streak; while EFNB2 and WNT8A show broad expression in the mesoderm. This comparison illustrates the complex combinatorial gene regulation driving epithelial-to-mesenchymal transition (EMT) and mesodermal patterning during vertebrate development.
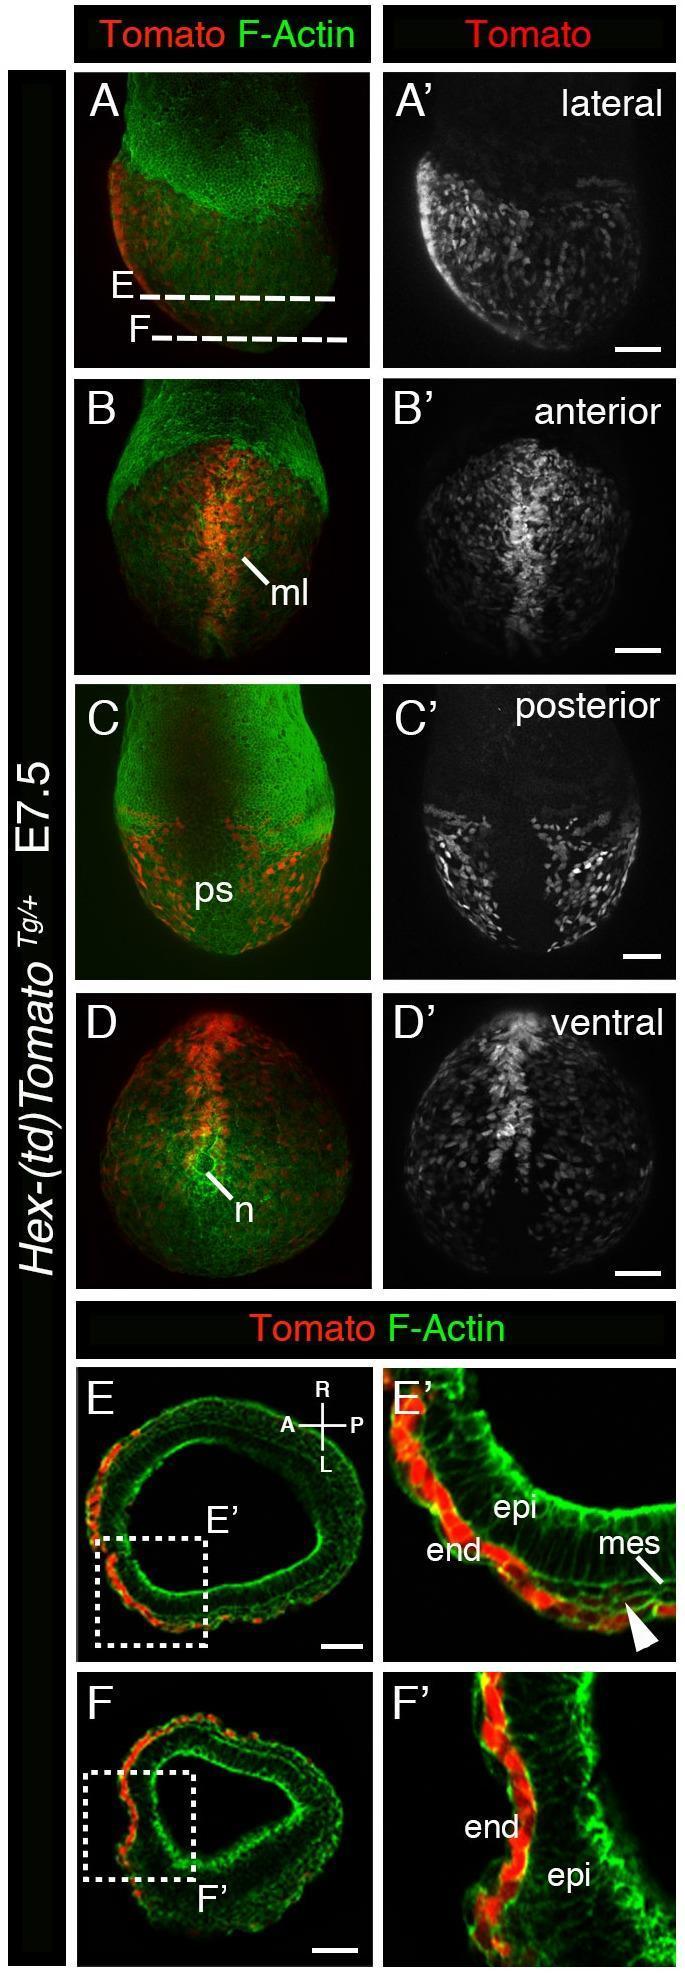
This diagnostic image set showcases laser scanning confocal microscopy of a mouse embryo at the mid-gastrulation stage (E7.5), utilizing a Hex-tdTomato reporter to track endoderm development. Panels A-D′ present whole-mount 3D renderings from lateral, anterior, posterior, and ventral perspectives. The Hex-tdTomato signal (red/white) is prominently localized to the midline (ml), the primitive streak (ps) region, and surrounding the node (n), while F-Actin (green) provides a general structural outline of the embryonic tissues. Panels E-F′ show transverse histological sections and high-magnification inserts (E′, F′) demonstrating the spatial relationship between the three primary germ layers. The Tomato reporter is specifically expressed within the outer endoderm (end) layer, including the definitive endoderm (arrowhead). The interior epiblast (epi) and developing mesoderm (mes) layers are largely devoid of the reporter signal. This visual resource is critical for understanding vertebrate embryology, specifically the genetic regulation of endodermal lineage specification and morphogenetic movements during gastrulation.
The Primitive Streak
Definition and First Appearance
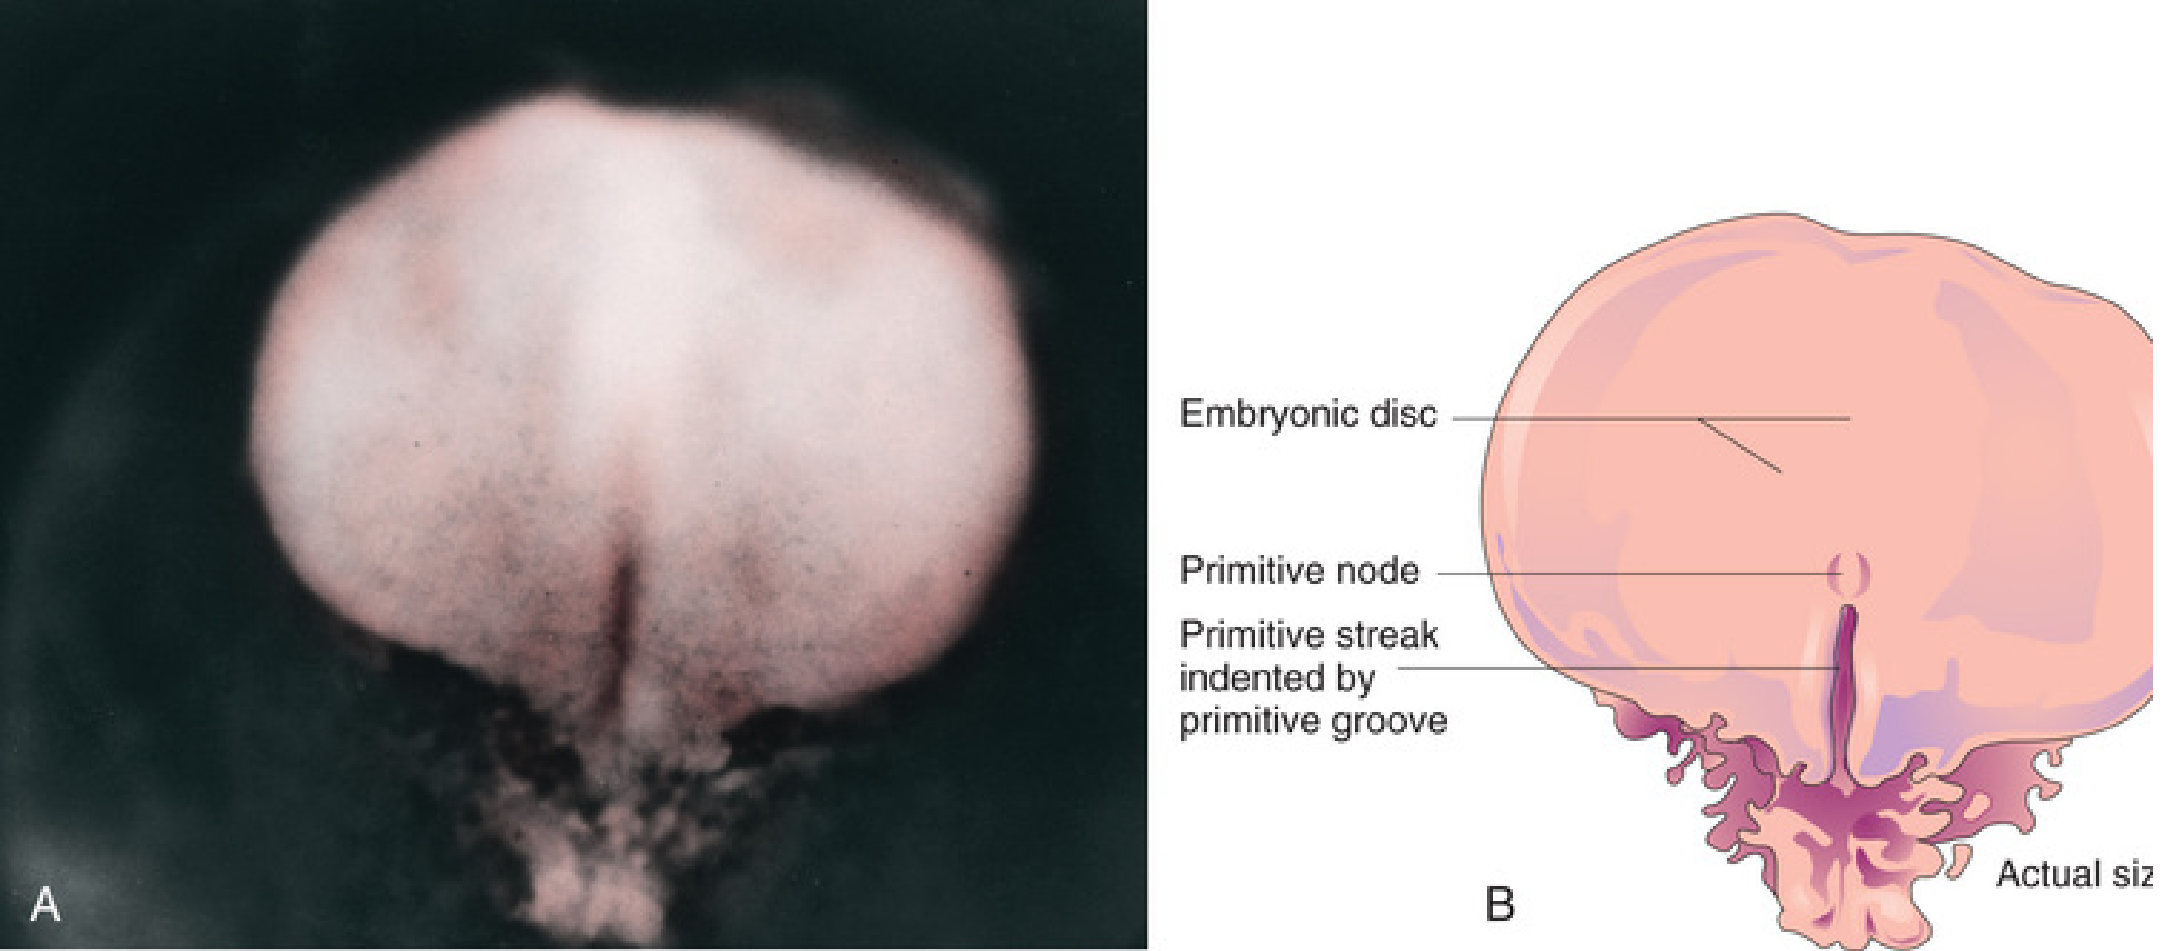
Formation and Structure
| Structure | Location | Description |
|---|---|---|
| Primitive streak | Caudal midline | Thickened rod of epiblast |
| Primitive groove | Along the streak | Midline depression formed by invagination of epiblast cells |
| Primitive node (Hensen's node) | Cranial end of streak | Proliferating cranial expansion; the organizer |
| Primitive pit | Centre of primitive node | Small depression continuous with primitive groove |
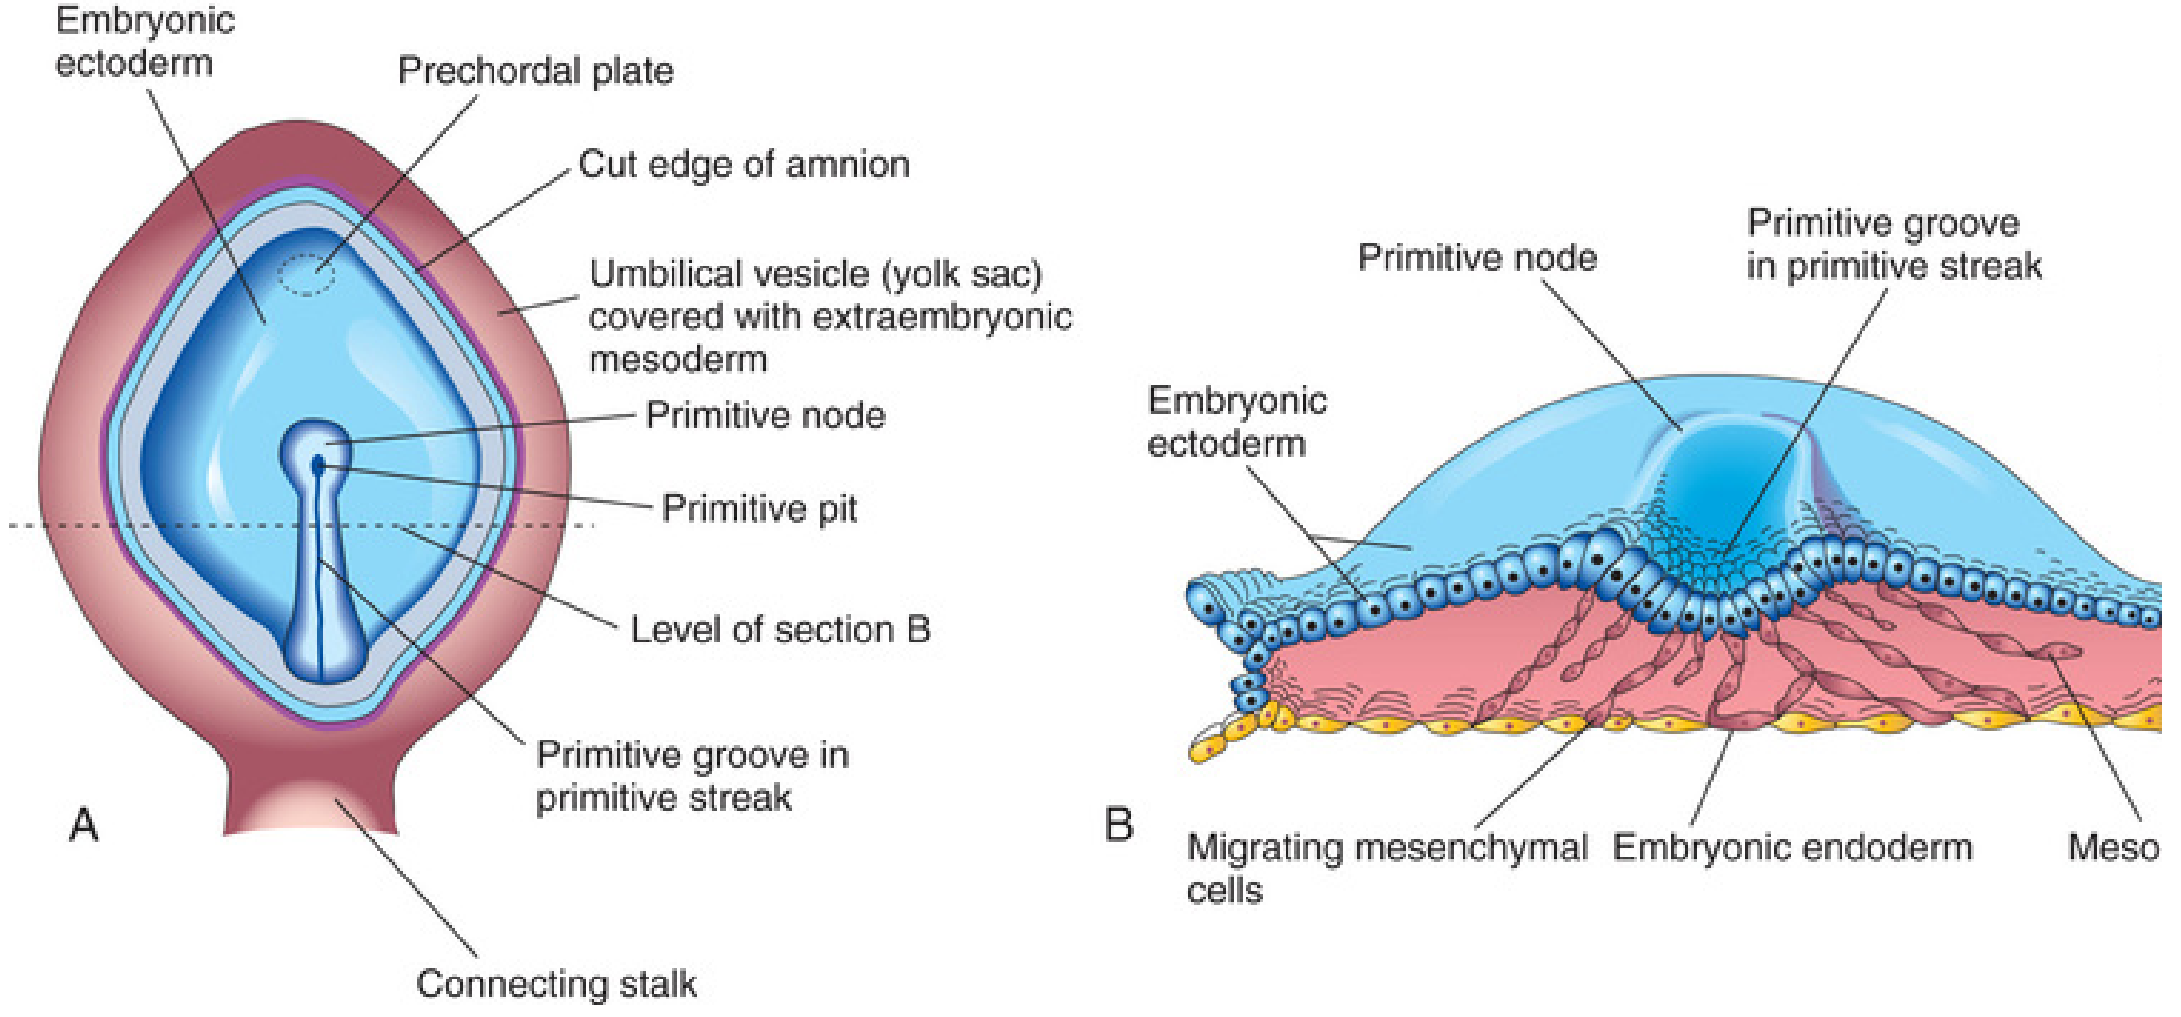
Role in Gastrulation: Establishing the Three Germ Layers
How ingression works:
- Epiblast cells migrate toward the primitive streak from both sides
- They enter the streak, change shape (EMT), and invaginate through the primitive groove and pit
- They emerge on the ventral side in successive waves - the timing of egress determines which tissue they form
Germ layers produced (by wave order):
| Wave (timing of egress) | What forms |
|---|---|
| Earliest / most posterior | Extraembryonic mesoderm - populates yolk sac blood islands, lines chorion |
| Early | Displaces hypoblast → definitive endoderm (roof of umbilical vesicle) |
| Later waves | Intraembryonic mesoderm - splits into paraxial, intermediate, lateral plate, and cardiac mesoderm |
| Most anterior migration | Notochord and midline axial structures |
| Epiblast cells remaining | Become embryonic ectoderm |
Axes Established by the Primitive Streak
| Axis | How it is set |
|---|---|
| Craniocaudal (A-P) | Primitive streak = caudal end; prechordal plate = cranial end |
| Dorsoventral | Hypoblast/primitive endoderm designates the ventral surface |
| Left-right | Node cilia beat a leftward current (see below) |
The Primitive Node: The Organizer
- Expresses GSC (goosecoid, homeobox transcription factor), CHORDIN (BMP antagonist), NODAL (TGF-β superfamily) - genes critical for midline and cranial structure formation
- Cells passing directly through the node → notochord and gut endoderm
- Regulates all three body axes
Molecular Regulation
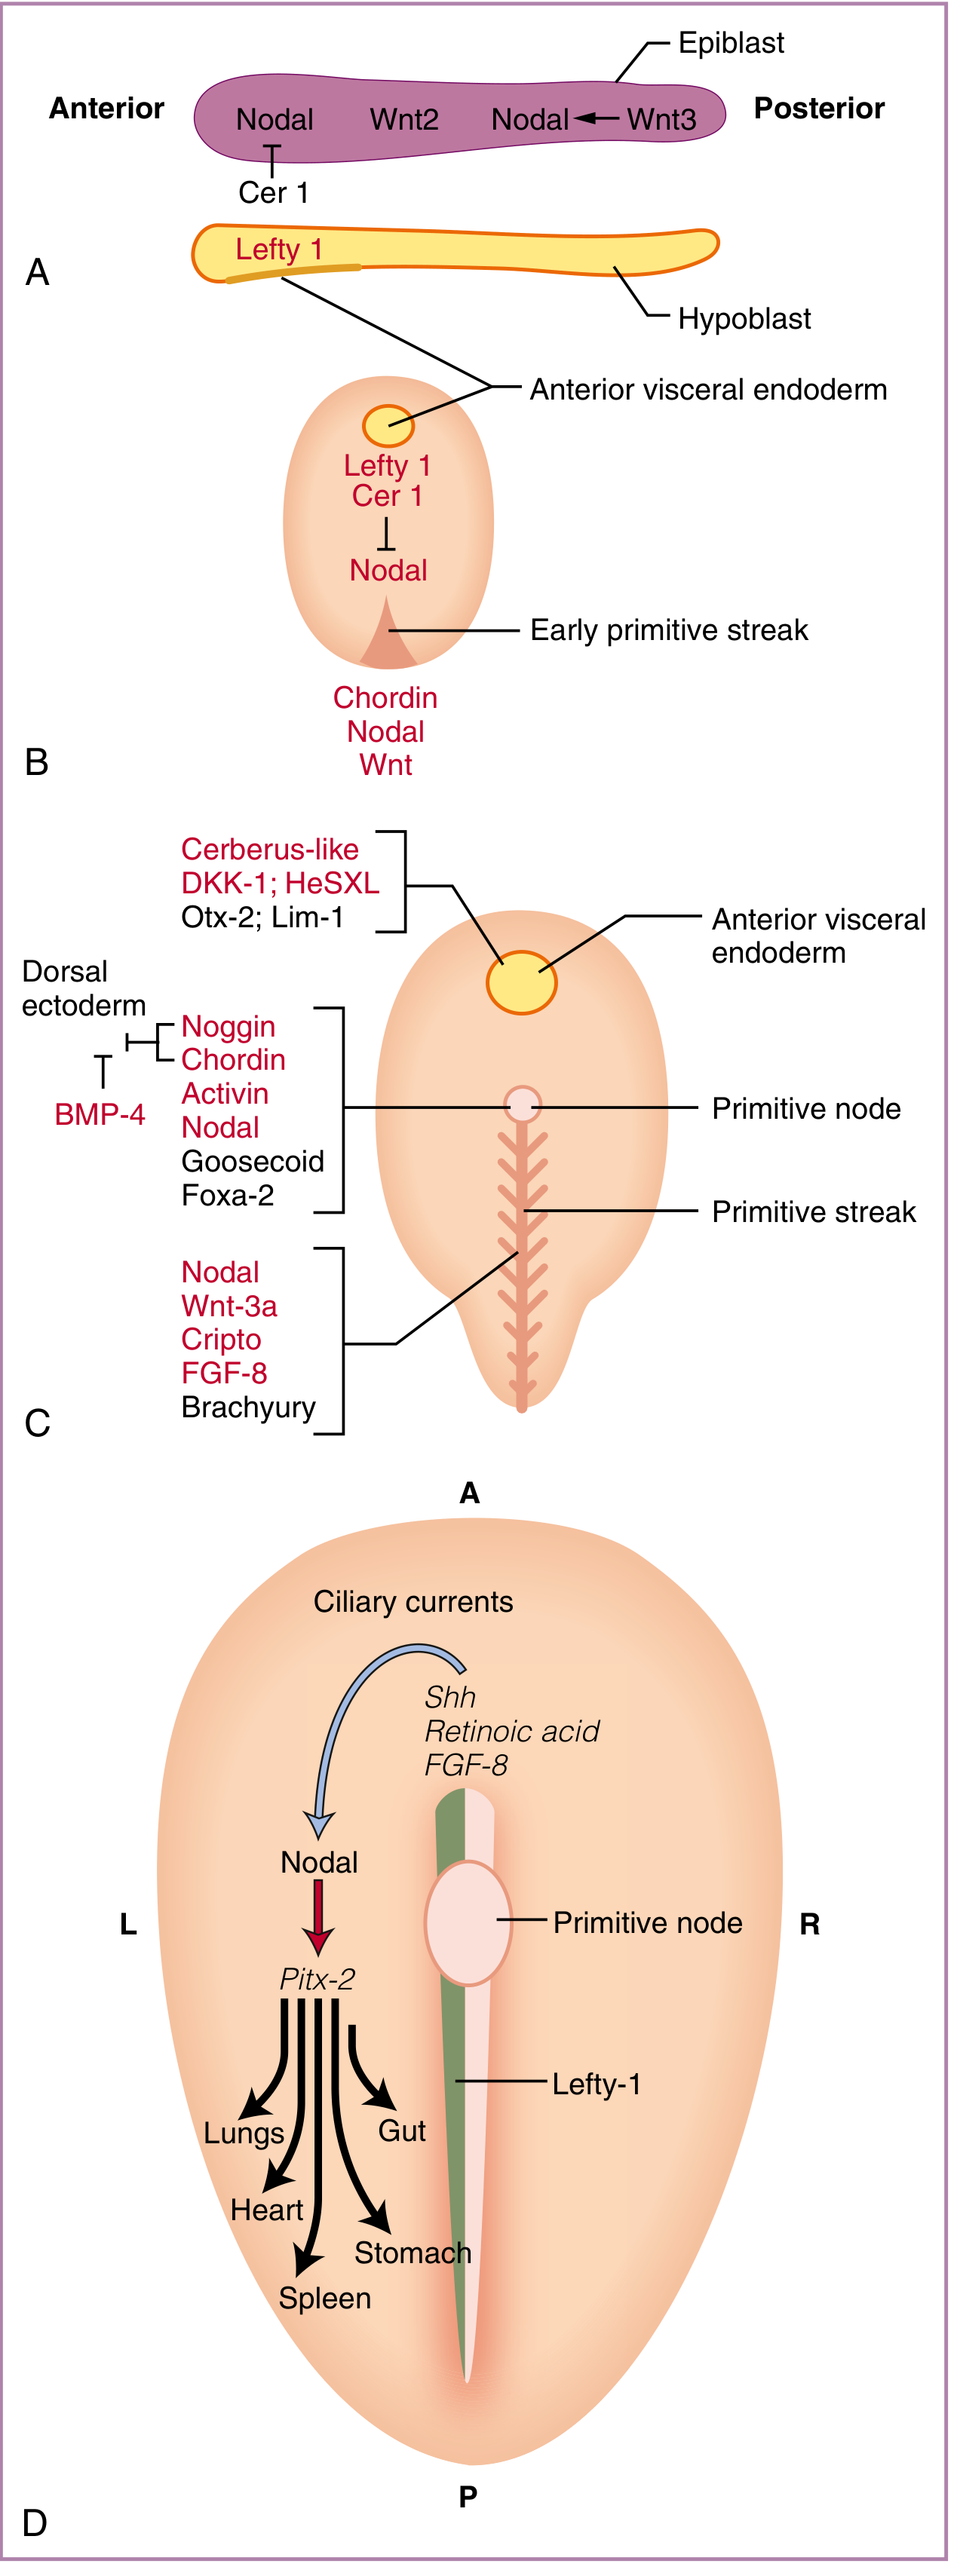
| Molecule | Source | Effect |
|---|---|---|
| Nodal (TGF-β) | Posterior epiblast | Drives primitive streak induction; required for its formation |
| WNT-3a (extraembryonic) | Extraembryonic ectoderm | Cooperates with Nodal to induce streak |
| FGF-8 + Cripto | Primitive streak | Drive ingression; mark streak cells |
| Brachyury (T) | Primitive streak | Transcription factor - key marker of mesoderm in the streak |
| Chordin, Noggin, Activin | Primitive node | Oppose BMP-4, pattern the organizer region |
| BMP-4 | Dorsal ectoderm lateral | Inhibits organizer gene expression |
| Lefty 1 / Cerberus-1 | Anterior visceral endoderm | Inhibit Nodal anteriorly - keep head-forming region free of streak induction |
Left-Right Axis: The Nodal/Cilia Model
- Node cilia beat in a leftward direction, generating a leftward fluid current
- This sweeps Nodal and Lefty (both TGF-β superfamily) to the left side of the primitive streak
- Restricted left-side expression activates PITX2 (pituitary homeobox 2) - a transcription factor driving left-sided organ development (heart, stomach, spleen)
- Lefty-1 on the left side prevents diffusion of signals to the right
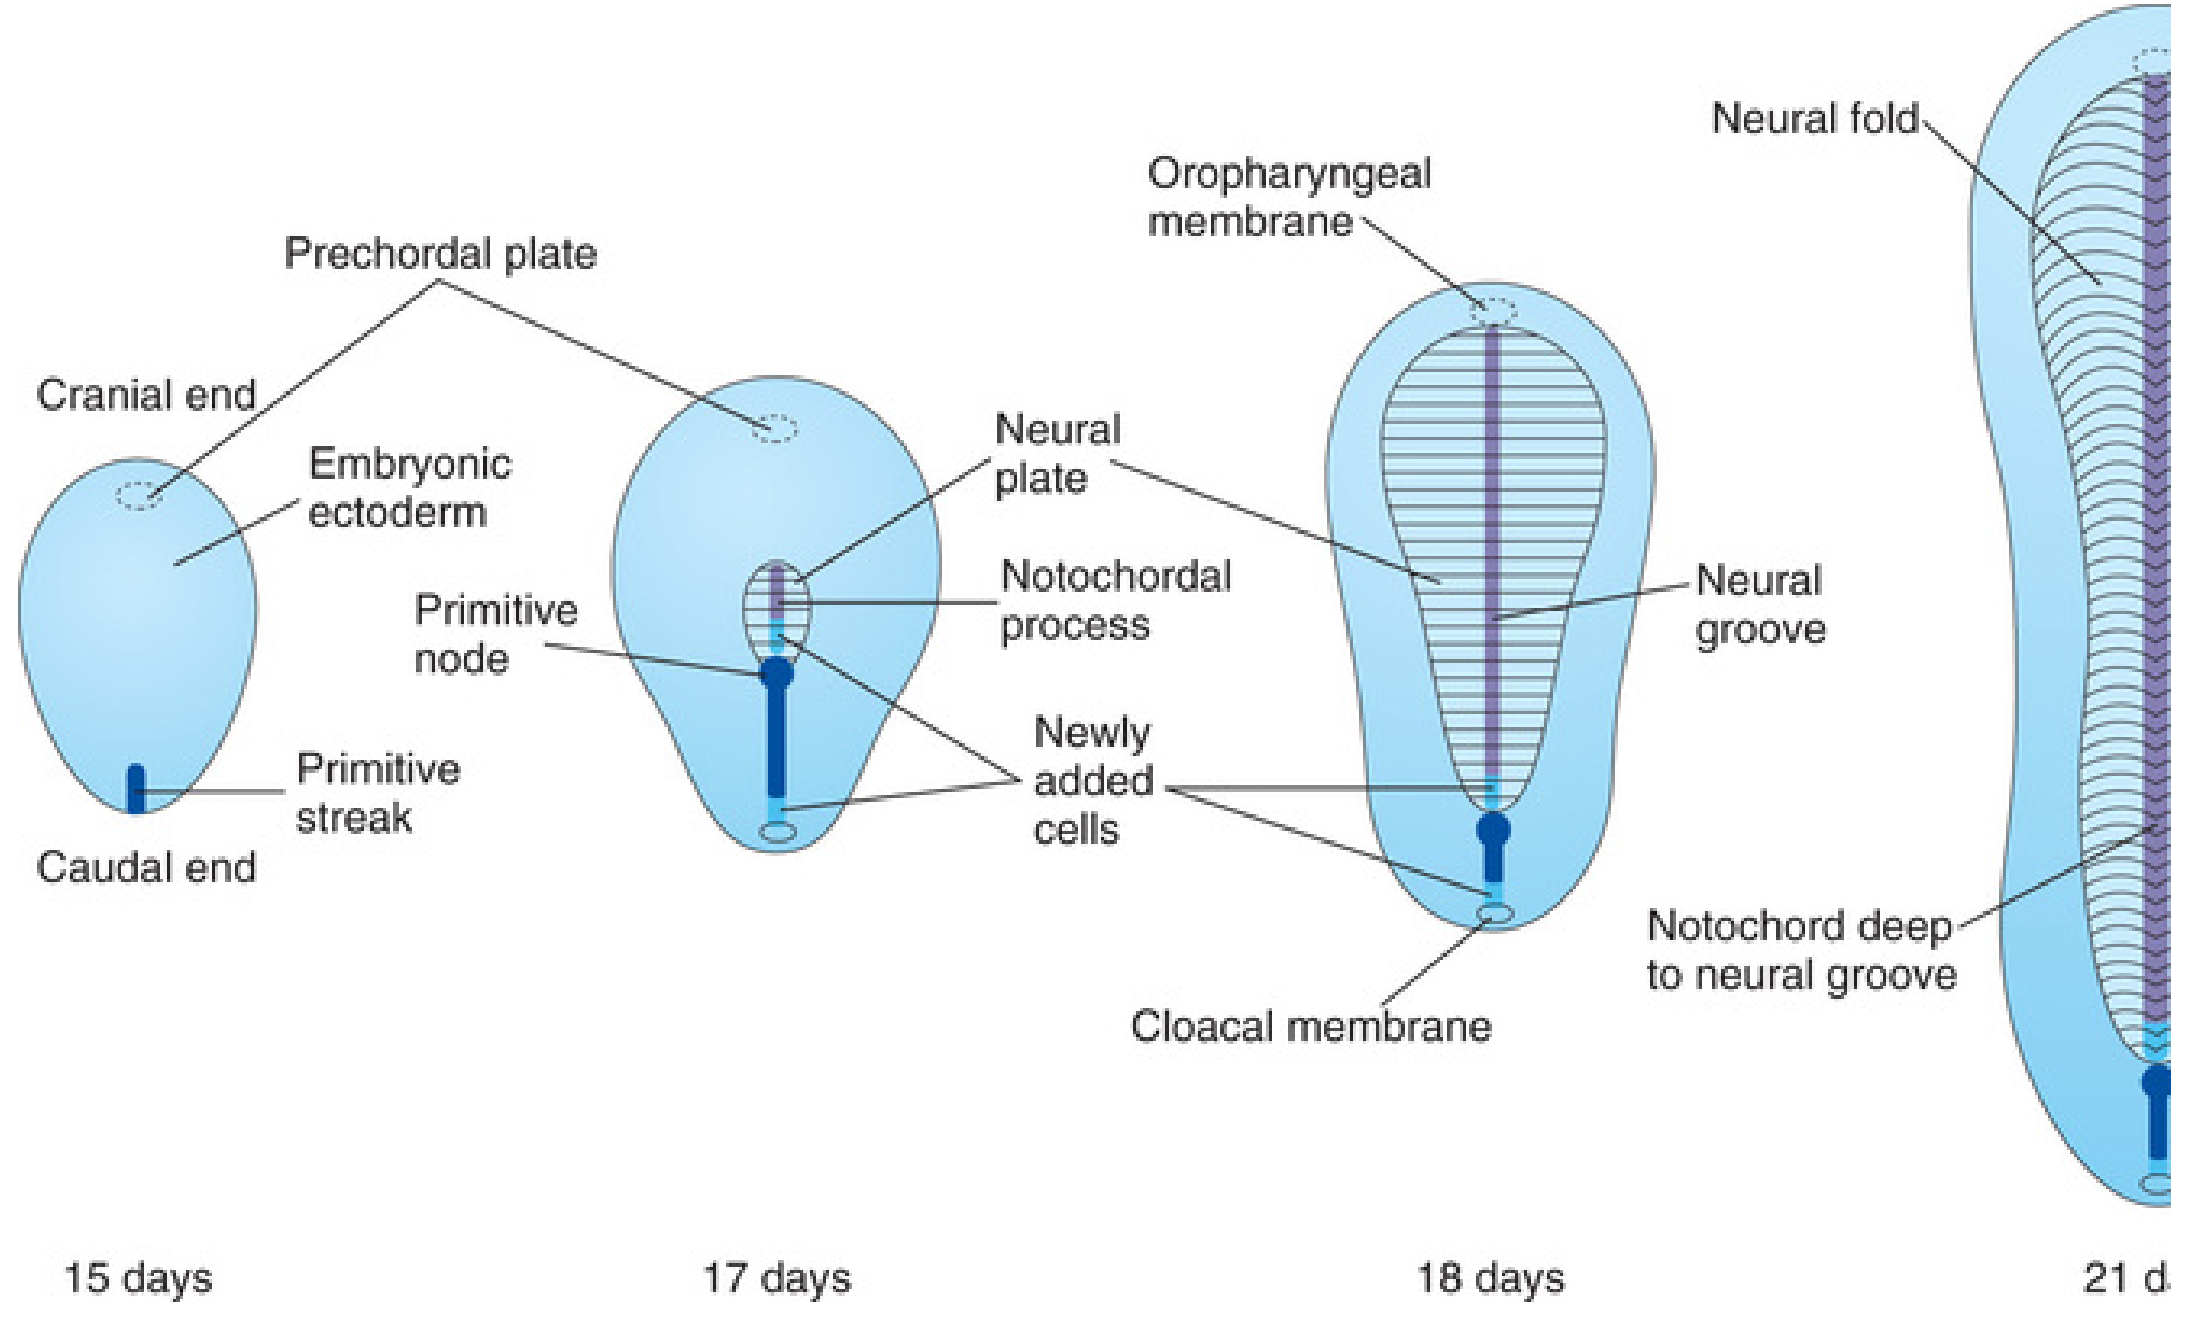
Fate of the Primitive Streak
- Actively produces mesoderm by ingression until early week 4
- As the notochordal process elongates cranially, the primitive streak shortens relatively
- The primitive streak diminishes in size and retreats to the sacrococcygeal region
- Normally disappears by end of week 4 through degenerative changes
Clinical Relevance: Sacrococcygeal Teratoma
-
Most common solid tumor in neonates
-
Incidence: ~1 in 35,000; 80% female
-
Because it derives from pluripotent primitive streak cells, it contains tissues from all three germ layers in varying stages of differentiation (hence "teratoma")
-
Usually detected on routine antenatal ultrasonography
-
Most are benign - promptly surgically excised
-
A presacral teratoma may cause bowel or urinary obstruction; surgical excision can have long-term sequelae on intestinal and urinary function
-
Malignant transformation is possible
-
The Developing Human, Clinically Oriented Embryology, p. 191-196
-
Creasy & Resnik's Maternal-Fetal Medicine, p. 81-83
Summary
| Feature | Detail |
|---|---|
| Appears | Beginning of week 3 (~day 15) |
| Location | Caudal midline of epiblast |
| Mechanism | EMT - epiblast cells ingress through groove/pit |
| Establishes | All 3 body axes + 3 germ layers |
| Key organizer | Primitive node (Hensen's node) |
| Key marker gene | Brachyury (T) |
| Left-right axis | Node monocilia → leftward Nodal/Lefty → PITX2 cascade |
| Fate | Regresses and disappears by end of week 4 |
| Failure to regress | Sacrococcygeal teratoma (1/35,000; 80% female; pluripotent, all 3 germ layers) |