
Generate PPT for topic ECG and leads of ECG with refrence to sembuligum
normal ECG waveform PQRST complex diagram
Einthoven triangle limb leads ECG diagram
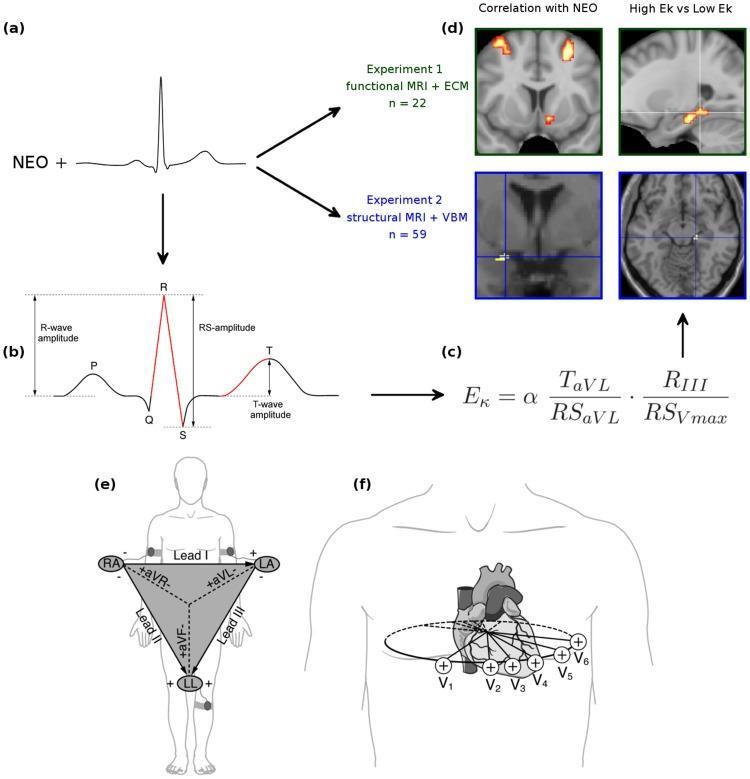
This composite educational infographic illustrates the methodology for correlating cardiac electrophysiology with neuroimaging. Panel (b) features a detailed ECG waveform diagram labeling the P-wave, QRS complex, and T-wave. It highlights measurement parameters including R-wave amplitude (baseline to peak), RS-amplitude (R-peak to S-nadir), and T-wave amplitude (plateau to peak). Panel (c) shows a mathematical formula for 'Ek', a cardiac amplitude signature derived from specific leads (aVL, III, and Vmax). Panels (e) and (f) depict standard 12-lead ECG electrode placement: the frontal plane limb leads (I, II, III, aVR, aVL, aVF) are arranged in Einthoven’s Triangle, while the horizontal plane precordial leads (V1-V6) are shown oriented across the chest wall. Panel (d) displays functional and structural neuroimaging results, specifically Eigenvector Centrality Maps and Voxel-Based Morphometry, showing significant activity and structural volume differences in the hippocampal subiculum correlated with the Ek cardiac index. The content integrates cardiology, neuroimaging (fMRI/MRI), and psychology to explore biomarkers for emotional personality.
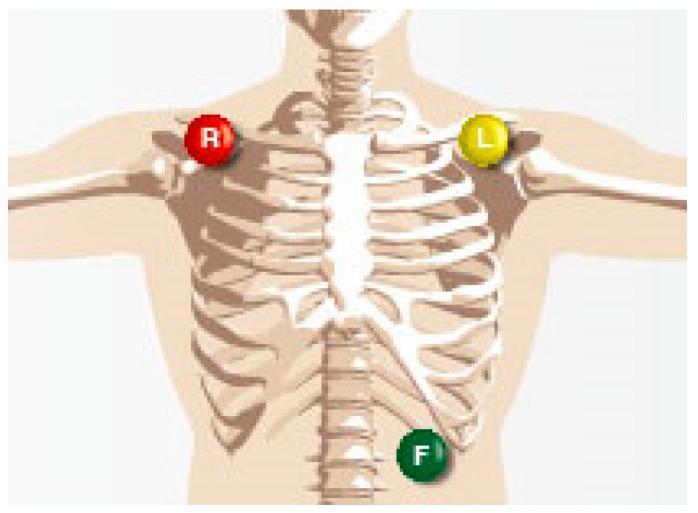
This anatomical diagram illustrates a standard 3-lead electrocardiogram (ECG) electrode placement configuration on a human torso. The visual focuses on the skeletal and surface anatomy to define precise lead locations. A red electrode, labeled 'R', is positioned on the right infraclavicular fossa near the right shoulder. A yellow electrode, labeled 'L', is placed in a mirroring position on the left infraclavicular fossa. A third green electrode, labeled 'F', is situated on the lower left abdomen, typically above the left iliac crest or inferior to the costal margin. This configuration represents the three primary limb leads (Leads I, II, and III) based on Einthoven's Triangle, used for monitoring cardiac electrical activity and heartbeat signals. The use of color-coding and alpha-labeling (Right, Left, Foot) serves as an educational guide for medical students and clinicians to ensure proper lead attachment in diagnostic and monitoring settings.
12 lead ECG chest electrode placement V1 V6 precordial leads
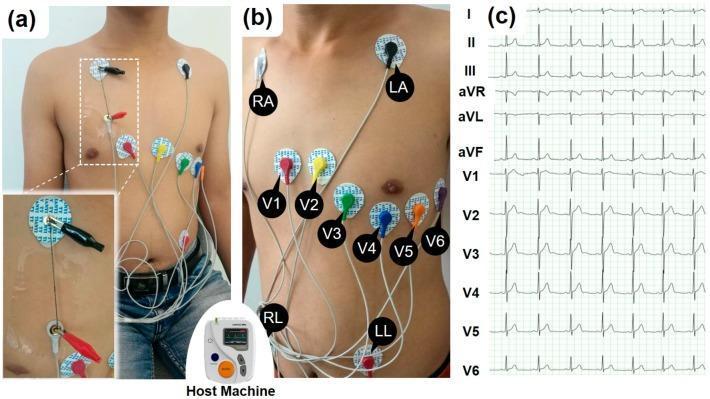
This composite educational graphic illustrates the procedural setup and resulting data for a standard 12-lead electrocardiogram (ECG/EKG). Panels (a) and (b) are clinical photographs demonstrating correct electrode placement on a male torso. The limb leads are positioned as RA (right arm/shoulder) and LA (left arm/shoulder) on the upper chest, with RL (right leg) and LL (left leg) on the lower abdomen. The precordial leads (V1-V6) follow the standard anatomical arc across the chest: V1 and V2 at the fourth intercostal space (right and left of the sternum), V4 at the fifth intercostal space (mid-clavicular line), and V3, V5, and V6 completing the transverse sequence toward the left axilla. Panel (a) includes an inset showing the experimental use of conductive carbon nanotube yarns (SWNT-CYs) connected via alligator clips to the electrodes. Panel (c) displays the resulting 12-lead ECG waveforms on a standard grid, labeled I, II, III, aVR, aVL, aVF, and V1-V6. Each lead shows distinct P-waves, QRS complexes, and T-waves, representing different electrical vectors of cardiac depolarization and repolarization.
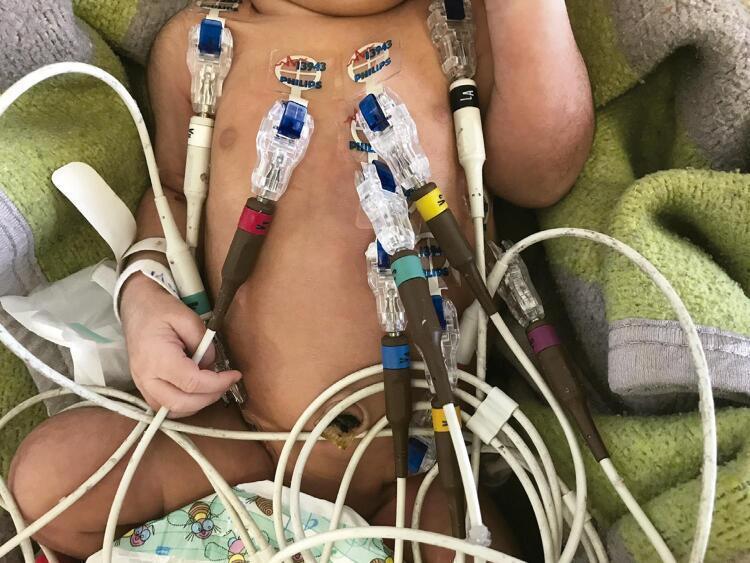
This clinical photograph demonstrates the specific electrode placement for a 12-lead electrocardiogram (ECG) on a neonate. To minimize motion artifact and signal noise common in newborns, the limb leads are repositioned: electrodes are placed on the right and left shoulders instead of the arms, and on the right and left iliac crests instead of the lower limbs. Precordial electrodes V1 through V6 are arranged across the anterior chest wall following standard anatomical landmarks. The image shows clear adhesive solid gel tab electrodes (Philips brand) connected via a system of color-coded brown 'grabber' style connectors (red, yellow, green, blue, and purple) to white insulated lead wires. This procedural setup illustrates specialized pediatric cardiovascular monitoring techniques designed to ensure high-quality diagnostic signals while accommodating neonatal anatomy and movement.
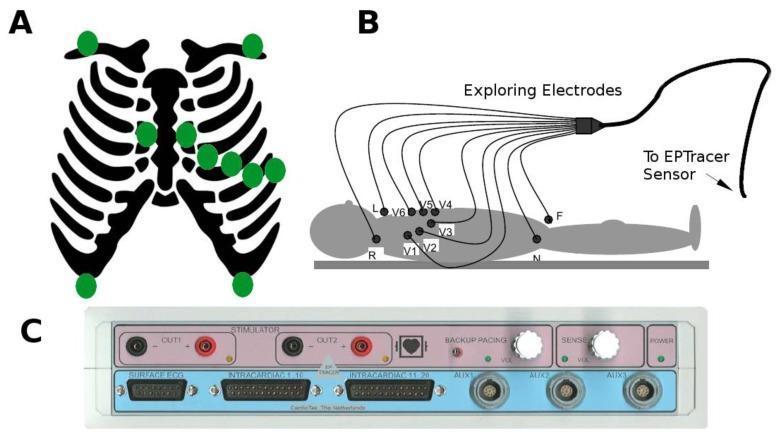
This composite educational graphic illustrates the configuration and hardware for electrocardiogram (ECG) recording. Panel A is an anatomical diagram showing the skeletal thorax with green markers indicating standard electrode placement sites, including the precordial and limb leads. Panel B presents a schematic of a human subject in the supine position, detailing the connection of exploring electrodes (labeled R, L, F, N, and V1–V6) to an EPTracer sensor system. This panel demonstrates the standardized 12-lead ECG nomenclature and the spatial distribution of chest and limb leads used to calculate potential differences against the Wilson central terminal. Panel C is a clinical photograph of the EPTracer sensor front panel, a specialized electrophysiological measurement device. The panel displays various interfaces including stimulator outputs (OUT1, OUT2), specialized ports for surface ECG and intracardiac signal acquisition, and auxiliary inputs. Control knobs for backup pacing and sensing parameters are also visible, highlighting the device's capability for both diagnostic recording and therapeutic cardiac pacing in clinical or experimental electrophysiology environments.
mkdir -p /tmp/workspace/ecg-ppt/assets && ls -la /tmp/workspace/
cd /tmp/workspace/ecg-ppt && python /tmp/skills/shared/scripts/fetch_images.py \ "https://cdn.orris.care/cdss_images/pmc_clinical_VQA_34a797b022e61427661838b24c1e2e836ad2421b2ffadbc34e20e7e7636cf97e.jpg" \ "https://cdn.orris.care/cdss_images/pmc_clinical_VQA_0a629dbada29113218c61c4059b132047ec48211f002e86cc40663684b2352f5.jpg" \ "https://cdn.orris.care/cdss_images/pmc_clinical_VQA_1e88b075f27ce3ba49cd487a109a06da14834c0aa3553e90f79f489d5eb82230.jpg" \ "https://cdn.orris.care/cdss_images/980d49638880f123e60f04d038c1af30751f3ad125962f137d98b37cf6e5d83e.png" \ "https://cdn.orris.care/cdss_images/3197a5b15521ca0442aea77966936d218e882e1be9dd3bf1ee41c83082d800a5.png" > fetch_out.json 2>fetch_err.log; echo EXIT:$?; wc -c fetch_out.json
~/ecg-ppt/build_ppt.py
import json, base64
from io import BytesIO
from pptx import Presentation
from pptx.util import Inches, Pt, Emu
from pptx.dml.color import RGBColor
from pptx.enum.text import PP_ALIGN, MSO_ANCHOR
from pptx.enum.shapes import MSO_SHAPE

# ---------- load fetched images ----------
with open("fetch_out.json") as f:
    imgs = json.load(f)

def img_stream(idx):
    b64 = imgs[idx]["base64"].split(",", 1)[-1]
    return BytesIO(base64.b64decode(b64))

EINTHOVEN_INFOGRAPHIC = 0
THREE_LEAD_PLACEMENT = 1
TWELVE_LEAD_PANEL = 2
GUYTON_LIMB_FIG = 3
GUYTON_CHEST_FIG = 4

# ---------- palette ----------
NAVY = RGBColor(0x0B, 0x2545, 0x8C)
BLUE = RGBColor(0x13, 0x4E, 0xC7)
RED = RGBColor(0xC0, 0x1B, 0x2E)
LIGHT = RGBColor(0xF2, 0xF6, 0xFC)
GRAY = RGBColor(0x4A, 0x4A, 0x4A)
WHITE = RGBColor(0xFF, 0xFF, 0xFF)
DARK = RGBColor(0x1B, 0x1B, 0x1B)

prs = Presentation()
prs.slide_width = Inches(13.333)
prs.slide_height = Inches(7.5)
BLANK = prs.slide_layouts[6]
SW, SH = prs.slide_width, prs.slide_height


def add_slide():
    return prs.slides.add_slide(BLANK)


def bg(slide, color=WHITE):
    slide.background.fill.solid()
    slide.background.fill.fore_color.rgb = color


def rect(slide, x, y, w, h, color, line=False):
    shp = slide.shapes.add_shape(MSO_SHAPE.RECTANGLE, x, y, w, h)
    shp.fill.solid()
    shp.fill.fore_color.rgb = color
    if line:
        shp.line.color.rgb = color
    else:
        shp.line.fill.background()
    shp.shadow.inherit = False
    return shp


def textbox(slide, x, y, w, h, text, size=18, color=DARK, bold=False, align=PP_ALIGN.LEFT,
            font="Calibri", anchor=MSO_ANCHOR.TOP, italic=False, line_spacing=1.0):
    tb = slide.shapes.add_textbox(x, y, w, h)
    tf = tb.text_frame
    tf.word_wrap = True
    tf.vertical_anchor = anchor
    tf.margin_left = 0
    tf.margin_right = 0
    tf.margin_top = 0
    tf.margin_bottom = 0
    lines = text if isinstance(text, list) else [text]
    for i, line in enumerate(lines):
        p = tf.paragraphs[0] if i == 0 else tf.add_paragraph()
        p.text = line
        p.alignment = align
        p.line_spacing = line_spacing
        for r in p.runs:
            r.font.size = Pt(size)
            r.font.color.rgb = color
            r.font.bold = bold
            r.font.italic = italic
            r.font.name = font
    return tb


def bullets(slide, x, y, w, h, items, size=16, color=DARK, bold_head=False, space_after=8, font="Calibri"):
    tb = slide.shapes.add_textbox(x, y, w, h)
    tf = tb.text_frame
    tf.word_wrap = True
    tf.margin_left = 0
    tf.margin_right = 0
    for i, item in enumerate(items):
        p = tf.paragraphs[0] if i == 0 else tf.add_paragraph()
        p.space_after = Pt(space_after)
        p.line_spacing = 1.05
        if isinstance(item, tuple):
            head, rest = item
            r1 = p.add_run(); r1.text = "\u25AA  " + head
            r1.font.bold = True; r1.font.size = Pt(size); r1.font.color.rgb = NAVY; r1.font.name = font
            if rest:
                r2 = p.add_run(); r2.text = "  " + rest
                r2.font.size = Pt(size); r2.font.color.rgb = color; r2.font.name = font
        else:
            r = p.add_run(); r.text = "\u25AA  " + item
            r.font.size = Pt(size); r.font.color.rgb = color; r.font.name = font
    return tb


def footer(slide, num):
    rect(slide, 0, SH - Inches(0.38), SW, Inches(0.38), NAVY)
    textbox(slide, Inches(0.4), SH - Inches(0.36), Inches(8), Inches(0.32),
            "ECG & Leads of ECG  |  Ref: Sembulingam's Essentials of Medical Physiology; Guyton & Hall",
            size=10, color=WHITE, anchor=MSO_ANCHOR.MIDDLE)
    textbox(slide, SW - Inches(1.0), SH - Inches(0.36), Inches(0.6), Inches(0.32),
            str(num), size=10, color=WHITE, align=PP_ALIGN.RIGHT, anchor=MSO_ANCHOR.MIDDLE)


def header(slide, kicker, title):
    rect(slide, 0, 0, SW, Inches(1.15), NAVY)
    rect(slide, 0, Inches(1.15), SW, Inches(0.07), RED)
    textbox(slide, Inches(0.55), Inches(0.14), Inches(11), Inches(0.32), kicker.upper(),
            size=13, color=RGBColor(0xAF, 0xC6, 0xFF), bold=True)
    textbox(slide, Inches(0.55), Inches(0.44), Inches(12), Inches(0.65), title,
            size=30, color=WHITE, bold=True)


def picture_framed(slide, path_stream, x, y, w, h, caption=None):
    pic = slide.shapes.add_picture(path_stream, x, y, height=h)
    if pic.width > w:
        ratio = w / pic.width
        pic.width = w
        pic.height = Emu(int(pic.height * ratio))
        pic.left = x
        pic.top = y
    frame = slide.shapes.add_shape(MSO_SHAPE.RECTANGLE, pic.left - Pt(2), pic.top - Pt(2),
                                    pic.width + Pt(4), pic.height + Pt(4))
    frame.fill.background()
    frame.line.color.rgb = NAVY
    frame.line.width = Pt(1.5)
    frame.shadow.inherit = False
    if caption:
        textbox(slide, pic.left, pic.top + pic.height + Pt(4), pic.width, Inches(0.4),
                caption, size=10.5, color=GRAY, italic=True, align=PP_ALIGN.CENTER)
    return pic


# =========================================================
# SLIDE 1 — TITLE
# =========================================================
s = add_slide(); bg(s, NAVY)
rect(s, 0, Inches(5.9), SW, Inches(1.6), RGBColor(0x08, 0x1B, 0x40))
rect(s, 0, Inches(5.85), SW, Inches(0.06), RED)
textbox(s, Inches(0.9), Inches(2.15), Inches(11.5), Inches(0.5), "CARDIOVASCULAR PHYSIOLOGY",
        size=18, color=RGBColor(0xAF, 0xC6, 0xFF), bold=True)
textbox(s, Inches(0.9), Inches(2.65), Inches(11.5), Inches(1.5), "ECG and Leads of ECG",
        size=54, color=WHITE, bold=True)
textbox(s, Inches(0.9), Inches(3.85), Inches(11), Inches(0.8),
        "Electrocardiogram: Genesis, Waveform and the Lead System",
        size=22, color=RGBColor(0xD8, 0xE3, 0xF7), italic=True)
textbox(s, Inches(0.9), Inches(6.15), Inches(11.5), Inches(1.0),
        "Reference: K. Sembulingam, \"Essentials of Medical Physiology\" (Cardiovascular System - ECG chapters)\n"
        "Cross-referenced with Guyton & Hall, Textbook of Medical Physiology",
        size=14, color=RGBColor(0xB9, 0xC7, 0xE8))

# =========================================================
# SLIDE 2 — What is ECG
# =========================================================
s = add_slide(); bg(s)
header(s, "Introduction", "What is an Electrocardiogram (ECG)?")
bullets(s, Inches(0.6), Inches(1.55), Inches(6.9), Inches(5),
        [("Definition:", "A graphic record of the electrical activity generated by the heart, recorded from the surface of the body."),
         ("Origin of signal:", "Depolarization and repolarization of atrial and ventricular muscle create current flow through the conducting tissue fluids of the body."),
         ("Recording device:", "Electrocardiograph - picks up potentials via skin electrodes and displays them as a time-voltage tracing."),
         ("Standard paper speed:", "25 mm/sec; standard calibration 1 mV = 10 mm deflection."),
         ("Clinical value:", "Used to assess heart rate and rhythm, chamber enlargement, conduction defects, ischemia/infarction, and electrolyte disturbances."),
         ], size=15.5)
picture_framed(s, img_stream(EINTHOVEN_INFOGRAPHIC), Inches(7.75), Inches(1.6), Inches(5.0), Inches(4.6),
               caption="P-QRS-T waveform and standard 12-lead frontal/horizontal plane arrangement")
footer(s, 2)

# =========================================================
# SLIDE 3 — Waveform (P QRS T)
# =========================================================
s = add_slide(); bg(s)
header(s, "Normal ECG", "The Normal ECG Waveform")
bullets(s, Inches(0.6), Inches(1.55), Inches(12.1), Inches(2.6),
        [("P wave:", "Small upward deflection produced by atrial depolarization (spread of impulse from SA node through both atria)."),
         ("QRS complex:", "Large, rapid deflection produced by ventricular depolarization; normal duration 0.06-0.10 second."),
         ("T wave:", "Rounded deflection caused by ventricular repolarization."),
         ("Intervals:", "P-R interval (0.12-0.20 sec) reflects AV conduction time; Q-T interval reflects total ventricular systole (depolarization + repolarization)."),
         ], size=16)
rect(s, Inches(0.6), Inches(4.35), Inches(12.1), Inches(2.55), LIGHT)
textbox(s, Inches(0.85), Inches(4.5), Inches(11.6), Inches(0.4), "Key point (Sembulingam):", size=15, bold=True, color=NAVY)
textbox(s, Inches(0.85), Inches(4.95), Inches(11.6), Inches(1.8),
        "There is no wave for atrial repolarization on the surface ECG - it is buried within the "
        "much larger QRS complex, since atrial repolarization occurs at the same time the ventricles depolarize.",
        size=15.5, color=DARK, line_spacing=1.2)
footer(s, 3)

# =========================================================
# SLIDE 4 — Genesis / current flow around heart
# =========================================================
s = add_slide(); bg(s)
header(s, "Electrophysiology", "Genesis of the ECG - Current Flow Around the Heart")
bullets(s, Inches(0.6), Inches(1.55), Inches(6.9), Inches(5.2),
        [("Volume conductor:", "The heart lies suspended within body fluids and tissues (including the lungs) which conduct electricity, forming a volume conductor around the heart."),
         ("Depolarization wave:", "When part of the ventricle depolarizes, that region becomes electronegative relative to the still-polarized region, driving current through the surrounding fluid in elliptical paths."),
         ("Net vector:", "Impulse first reaches the septum and endocardial surface, so current flows on average from the base toward the apex for most of depolarization."),
         ("Terminal reversal:", "Just before depolarization completes, current briefly reverses (apex to base) as the outer basal walls depolarize last."),
         ("Recording principle:", "Any two points on the body surface with a potential difference can be connected to a meter (lead) to record this changing current as the ECG."),
         ], size=15.5)
rect(s, Inches(7.75), Inches(1.6), Inches(5.0), Inches(5.15), LIGHT)
textbox(s, Inches(7.95), Inches(1.75), Inches(4.6), Inches(0.4), "Why leads matter", size=17, bold=True, color=NAVY)
textbox(s, Inches(7.95), Inches(2.25), Inches(4.6), Inches(4.3),
        "Because the depolarization wave travels as a 3-dimensional vector, its recorded shape and "
        "amplitude change depending on WHERE on the body the two recording electrodes are placed.\n\n"
        "This is why the ECG is recorded from several standard positions - called LEADS - each viewing "
        "the heart's electrical activity from a different angle.",
        size=15, color=DARK, line_spacing=1.25)
footer(s, 4)

# =========================================================
# SLIDE 5 — Leads overview
# =========================================================
s = add_slide(); bg(s)
header(s, "Lead System", "ECG Leads - Overview")
textbox(s, Inches(0.6), Inches(1.4), Inches(12), Inches(0.5),
        "A \"lead\" = a pair of electrodes (or an electrode + a reference point) connected to the electrocardiograph to record the potential difference between two points.",
        size=15.5, color=GRAY, italic=True)
cols = [
    ("Bipolar Limb Leads", "I, II, III", "Record potential difference between two limbs (Einthoven's triangle)."),
    ("Augmented Unipolar\nLimb Leads", "aVR, aVL, aVF", "One limb (positive) vs. the other two limbs combined (negative), electronically augmented."),
    ("Unipolar Chest\n(Precordial) Leads", "V1 - V6", "Chest electrode (positive) vs. Wilson's central terminal (average of all three limbs)."),
]
x0 = Inches(0.6); w = Inches(3.95); gap = Inches(0.2); y0 = Inches(2.15)
for i, (title, codes, desc) in enumerate(cols):
    x = x0 + i * (w + gap)
    rect(s, x, y0, w, Inches(3.9), LIGHT)
    rect(s, x, y0, w, Inches(0.08), RED)
    textbox(s, x + Inches(0.25), y0 + Inches(0.3), w - Inches(0.5), Inches(0.9), title,
            size=18, bold=True, color=NAVY, align=PP_ALIGN.CENTER)
    textbox(s, x + Inches(0.25), y0 + Inches(1.3), w - Inches(0.5), Inches(0.6), codes,
            size=22, bold=True, color=RED, align=PP_ALIGN.CENTER)
    textbox(s, x + Inches(0.3), y0 + Inches(2.15), w - Inches(0.6), Inches(1.6), desc,
            size=14.5, color=DARK, align=PP_ALIGN.CENTER, line_spacing=1.15)
textbox(s, Inches(0.6), Inches(6.35), Inches(12.1), Inches(0.5),
        "Together these 12 leads form the standard clinical 12-lead ECG, viewing the heart in the frontal plane (limb + augmented leads) and horizontal plane (chest leads).",
        size=14, color=GRAY)
footer(s, 5)

# =========================================================
# SLIDE 6 — Standard bipolar limb leads + Einthoven triangle
# =========================================================
s = add_slide(); bg(s)
header(s, "Frontal Plane Leads", "Standard Bipolar Limb Leads (Einthoven's Triangle)")
bullets(s, Inches(0.6), Inches(1.55), Inches(6.5), Inches(4.6),
        [("Lead I:", "RA (-) to LA (+). Positive when left arm is electropositive relative to right arm."),
         ("Lead II:", "RA (-) to LL (+). Most commonly used for rhythm monitoring; largest amplitude in normal hearts."),
         ("Lead III:", "LA (-) to LL (+)."),
         ("Einthoven's Triangle:", "The right arm, left arm and left leg form an (approximately) equilateral triangle around the heart, with the heart at its electrical center."),
         ], size=15.5)
rect(s, Inches(0.6), Inches(5.15), Inches(6.5), Inches(1.75), LIGHT)
textbox(s, Inches(0.85), Inches(5.3), Inches(6.0), Inches(0.4), "Einthoven's Law", size=15, bold=True, color=NAVY)
textbox(s, Inches(0.85), Inches(5.7), Inches(6.0), Inches(1.1),
        "Lead I + Lead III = Lead II\n(sum of potentials in leads I and III equals the potential in lead II)",
        size=15.5, color=DARK, line_spacing=1.2)
picture_framed(s, img_stream(THREE_LEAD_PLACEMENT), Inches(7.55), Inches(1.55), Inches(5.2), Inches(4.6),
               caption="Electrode placement: RA, LA and LL forming Einthoven's triangle")
footer(s, 6)

# =========================================================
# SLIDE 7 — Augmented limb leads
# =========================================================
s = add_slide(); bg(s)
header(s, "Frontal Plane Leads", "Augmented Unipolar Limb Leads (aVR, aVL, aVF)")
bullets(s, Inches(0.6), Inches(1.55), Inches(6.9), Inches(4.8),
        [("Principle:", "One limb electrode is the positive (exploring) terminal; the other two limbs are joined through resistances to form the negative terminal."),
         ("aVR:", "Positive electrode on the RIGHT arm - normally records an inverted (mostly negative) deflection."),
         ("aVL:", "Positive electrode on the LEFT arm."),
         ("aVF:", "Positive electrode on the LEFT foot/leg."),
         ("\"Augmented\":", "Electronic augmentation increases the recorded voltage by about 50% compared to the unaugmented unipolar limb leads, making the deflections comparable in size to the standard limb leads."),
         ], size=15.5)
rect(s, Inches(7.75), Inches(1.6), Inches(5.0), Inches(4.9), LIGHT)
textbox(s, Inches(7.95), Inches(1.8), Inches(4.6), Inches(0.5), "Frontal Plane Hexaxial View", size=16, bold=True, color=NAVY)
textbox(s, Inches(7.95), Inches(2.35), Inches(4.6), Inches(3.9),
        "Together, leads I, II, III, aVR, aVL and aVF sample the heart's electrical activity at six "
        "different angles within the frontal (coronal) plane - used clinically to determine the heart's "
        "mean electrical axis and to localize inferior/lateral wall changes.",
        size=15, color=DARK, line_spacing=1.25)
footer(s, 7)

# =========================================================
# SLIDE 8 — Precordial / chest leads
# =========================================================
s = add_slide(); bg(s)
header(s, "Horizontal Plane Leads", "Precordial (Chest) Leads - V1 to V6")
bullets(s, Inches(0.6), Inches(1.55), Inches(6.9), Inches(3.4),
        [("Setup:", "One exploring electrode is placed sequentially at six positions on the anterior/lateral chest wall; the indifferent electrode is Wilson's central terminal (average of RA, LA, LL)."),
         ("V1, V2:", "Over the right side of the heart (near the base) - normally record a predominantly negative QRS."),
         ("V4, V5, V6:", "Closer to the cardiac apex - normally record a predominantly positive QRS."),
         ("V3:", "Transitional zone between the negative and positive QRS pattern."),
         ], size=15.5)
rows = [("V1", "4th intercostal space, right sternal border"),
        ("V2", "4th intercostal space, left sternal border"),
        ("V3", "Midway between V2 and V4"),
        ("V4", "5th intercostal space, mid-clavicular line"),
        ("V5", "Same level as V4, anterior axillary line"),
        ("V6", "Same level as V4, mid-axillary line")]
ty = Inches(5.05)
rect(s, Inches(0.6), ty, Inches(6.9), Inches(0.42), NAVY)
textbox(s, Inches(0.75), ty + Inches(0.03), Inches(1.0), Inches(0.36), "Lead", size=13, bold=True, color=WHITE, anchor=MSO_ANCHOR.MIDDLE)
textbox(s, Inches(1.9), ty + Inches(0.03), Inches(5.4), Inches(0.36), "Anatomical Position", size=13, bold=True, color=WHITE, anchor=MSO_ANCHOR.MIDDLE)
for i, (lead, pos) in enumerate(rows):
    ry = ty + Inches(0.42) + i * Inches(0.32)
    if i % 2 == 0:
        rect(s, Inches(0.6), ry, Inches(6.9), Inches(0.32), LIGHT)
    textbox(s, Inches(0.75), ry + Inches(0.02), Inches(1.0), Inches(0.28), lead, size=12.5, bold=True, color=RED, anchor=MSO_ANCHOR.MIDDLE)
    textbox(s, Inches(1.9), ry + Inches(0.02), Inches(5.4), Inches(0.28), pos, size=12.5, color=DARK, anchor=MSO_ANCHOR.MIDDLE)
picture_framed(s, img_stream(GUYTON_CHEST_FIG), Inches(7.75), Inches(1.55), Inches(5.0), Inches(4.9),
               caption="Wilson's central terminal connection for recording chest leads (Guyton & Hall)")
footer(s, 8)

# =========================================================
# SLIDE 9 — 12-lead summary
# =========================================================
s = add_slide(); bg(s)
header(s, "Summary", "The Standard Clinical 12-Lead ECG")
picture_framed(s, img_stream(TWELVE_LEAD_PANEL), Inches(0.6), Inches(1.5), Inches(6.8), Inches(5.1),
               caption="Standard 12-lead electrode placement and resulting waveforms")
rect(s, Inches(7.7), Inches(1.55), Inches(5.05), Inches(5.05), LIGHT)
textbox(s, Inches(7.9), Inches(1.7), Inches(4.7), Inches(0.4), "12 Leads at a glance", size=17, bold=True, color=NAVY)
bullets(s, Inches(7.9), Inches(2.2), Inches(4.7), Inches(4.3),
        [("Bipolar limb (3):", "I, II, III"),
         ("Augmented limb (3):", "aVR, aVL, aVF"),
         ("Chest / precordial (6):", "V1, V2, V3, V4, V5, V6"),
         ("Frontal plane:", "I, II, III, aVR, aVL, aVF - cardiac axis"),
         ("Horizontal plane:", "V1-V6 - anterior/lateral wall detail"),
         ], size=15)
footer(s, 9)

# =========================================================
# SLIDE 10 — Clinical significance
# =========================================================
s = add_slide(); bg(s)
header(s, "Clinical Correlation", "Why Multiple Leads? - Clinical Significance")
bullets(s, Inches(0.6), Inches(1.55), Inches(12.1), Inches(5.2),
        [("Localization:", "Different leads view the heart from different angles, so a lesion (e.g., ischemia/infarct) affecting one wall changes the tracing predominantly in the leads that \"face\" that wall."),
         ("Cardiac axis:", "The six frontal-plane leads (I, II, III, aVR, aVL, aVF) allow calculation of the mean electrical axis of the heart, useful in detecting ventricular hypertrophy or conduction abnormalities."),
         ("Rhythm analysis:", "Lead II, running roughly parallel to the heart's electrical axis, gives the clearest P wave and is the standard lead for rhythm monitoring."),
         ("Right vs. left heart:", "V1-V2 reflect the right ventricle/septum; V5-V6 reflect the left ventricle - useful in hypertrophy and bundle branch block patterns."),
         ("Redundancy and confirmation:", "Recording the same electrical event from 12 different perspectives increases diagnostic accuracy and helps confirm artifacts versus true abnormalities."),
         ], size=16)
footer(s, 10)

# =========================================================
# SLIDE 11 — References
# =========================================================
s = add_slide(); bg(s, NAVY)
textbox(s, Inches(0.9), Inches(1.0), Inches(11), Inches(0.7), "References", size=34, bold=True, color=WHITE)
rect(s, Inches(0.9), Inches(1.7), Inches(3), Inches(0.05), RED)
bullets(s, Inches(0.9), Inches(2.1), Inches(11.3), Inches(4.5),
        ["Sembulingam, K. & Sembulingam, P. Essentials of Medical Physiology - Section on Cardiovascular System: Electrocardiogram, Genesis of ECG and ECG Leads.",
         "Hall, J.E. & Hall, M.E. Guyton and Hall Textbook of Medical Physiology - Chapter 11: The Normal Electrocardiogram (Electrocardiographic Leads).",
         "Standard 12-lead placement and waveform figures adapted from indexed medical image sources for educational illustration."],
        size=17, color=WHITE, space_after=16)
textbox(s, Inches(0.9), Inches(6.6), Inches(11), Inches(0.5),
        "Prepared for educational use - always correlate with current clinical guidelines and primary textbook figures.",
        size=13, color=RGBColor(0xB9, 0xC7, 0xE8), italic=True)

prs.save("ECG_and_Leads_of_ECG.pptx")
print("Saved.")
cd /tmp/workspace/ecg-ppt && python build_ppt.py
~/ecg-ppt/build_ppt.py
Successfully replaced 1 instance(s) of the string in '/tmp/workspace/ecg-ppt/build_ppt.py'
cd /tmp/workspace/ecg-ppt && python build_ppt.py
cd /tmp/workspace/ecg-ppt && python -c " from pptx import Presentation prs = Presentation('ECG_and_Leads_of_ECG.pptx') print('slides:', len(prs.slides)) " && ls -la ECG_and_Leads_of_ECG.pptx
ECG and Leads of ECG
Presentation · PPTX
- Title slide
- Introduction - What is an ECG
- Normal ECG waveform (P, QRS, T waves, intervals)
- Genesis of the ECG - current flow around the heart
- ECG leads overview (bipolar / augmented / precordial)
- Standard bipolar limb leads (I, II, III) + Einthoven's triangle & law
- Augmented unipolar limb leads (aVR, aVL, aVF)
- Precordial/chest leads (V1-V6) with anatomical placement table
- Summary of the standard 12-lead ECG
- Clinical significance of multiple leads
- References