
St depression and t wave inversion diagram
Reading File
Searching sources...
Finding Sources
Searching the Web
ST depression T wave inversion ECG diagram labeled
Finding Sources
Loading Image
Loading Image
Loading Image
Reading File
Finding Sources
Loading Image
Finding Sources
Reading File
Reading File
Loading Image
Loading Image
Here are the key diagrams for ST depression and T wave inversion, sourced from authoritative medical textbooks and clinical resources:
ST Depression vs ST Elevation - Basic Morphology
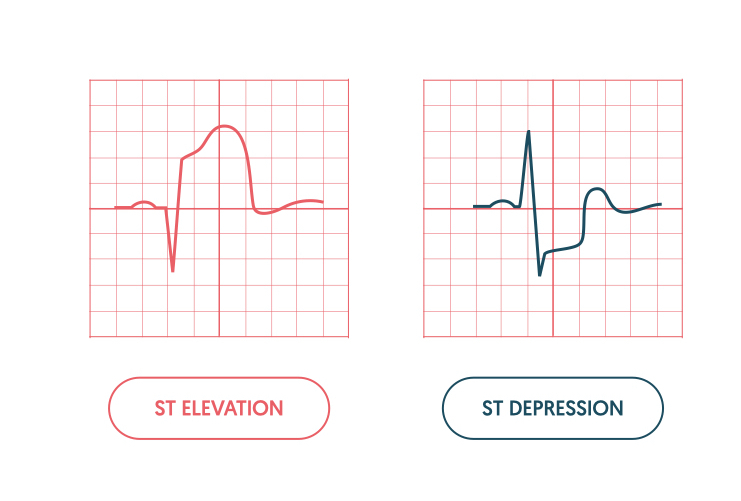
The ST segment sits between the end of the QRS complex and the beginning of the T wave. In ST depression, the segment drops below the isoelectric (baseline) line rather than staying flat or rising above it.
ECG Abnormalities in UA/NSTEMI (T-wave Inversion + ST Depression)
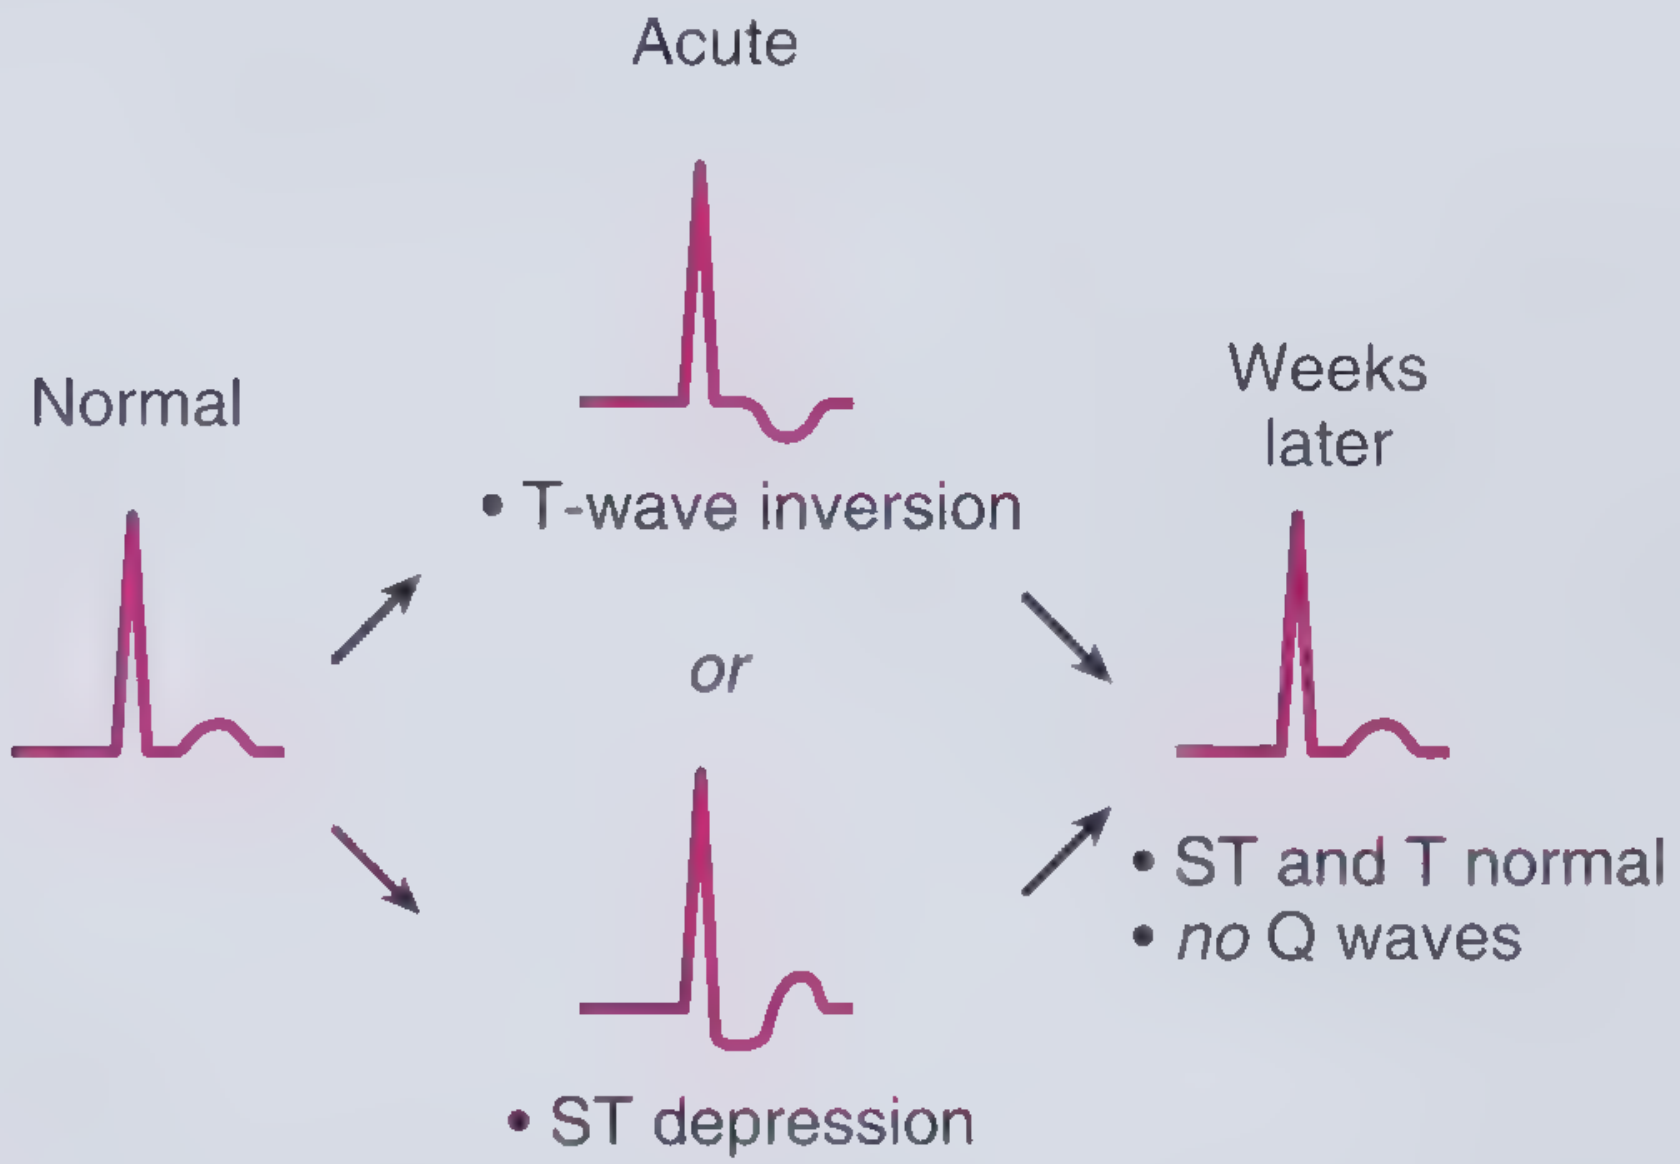
This diagram (from Frameworks for Internal Medicine, based on Lilly's Pathophysiology of Heart Disease) shows the two hallmark ECG findings of UA/NSTEMI:
- T-wave inversion - the T wave flips below the baseline
- ST depression - the ST segment sags below the isoelectric line
- Both are transient and may normalize over weeks
Ischemia Patterns - Endocardial vs Epicardial
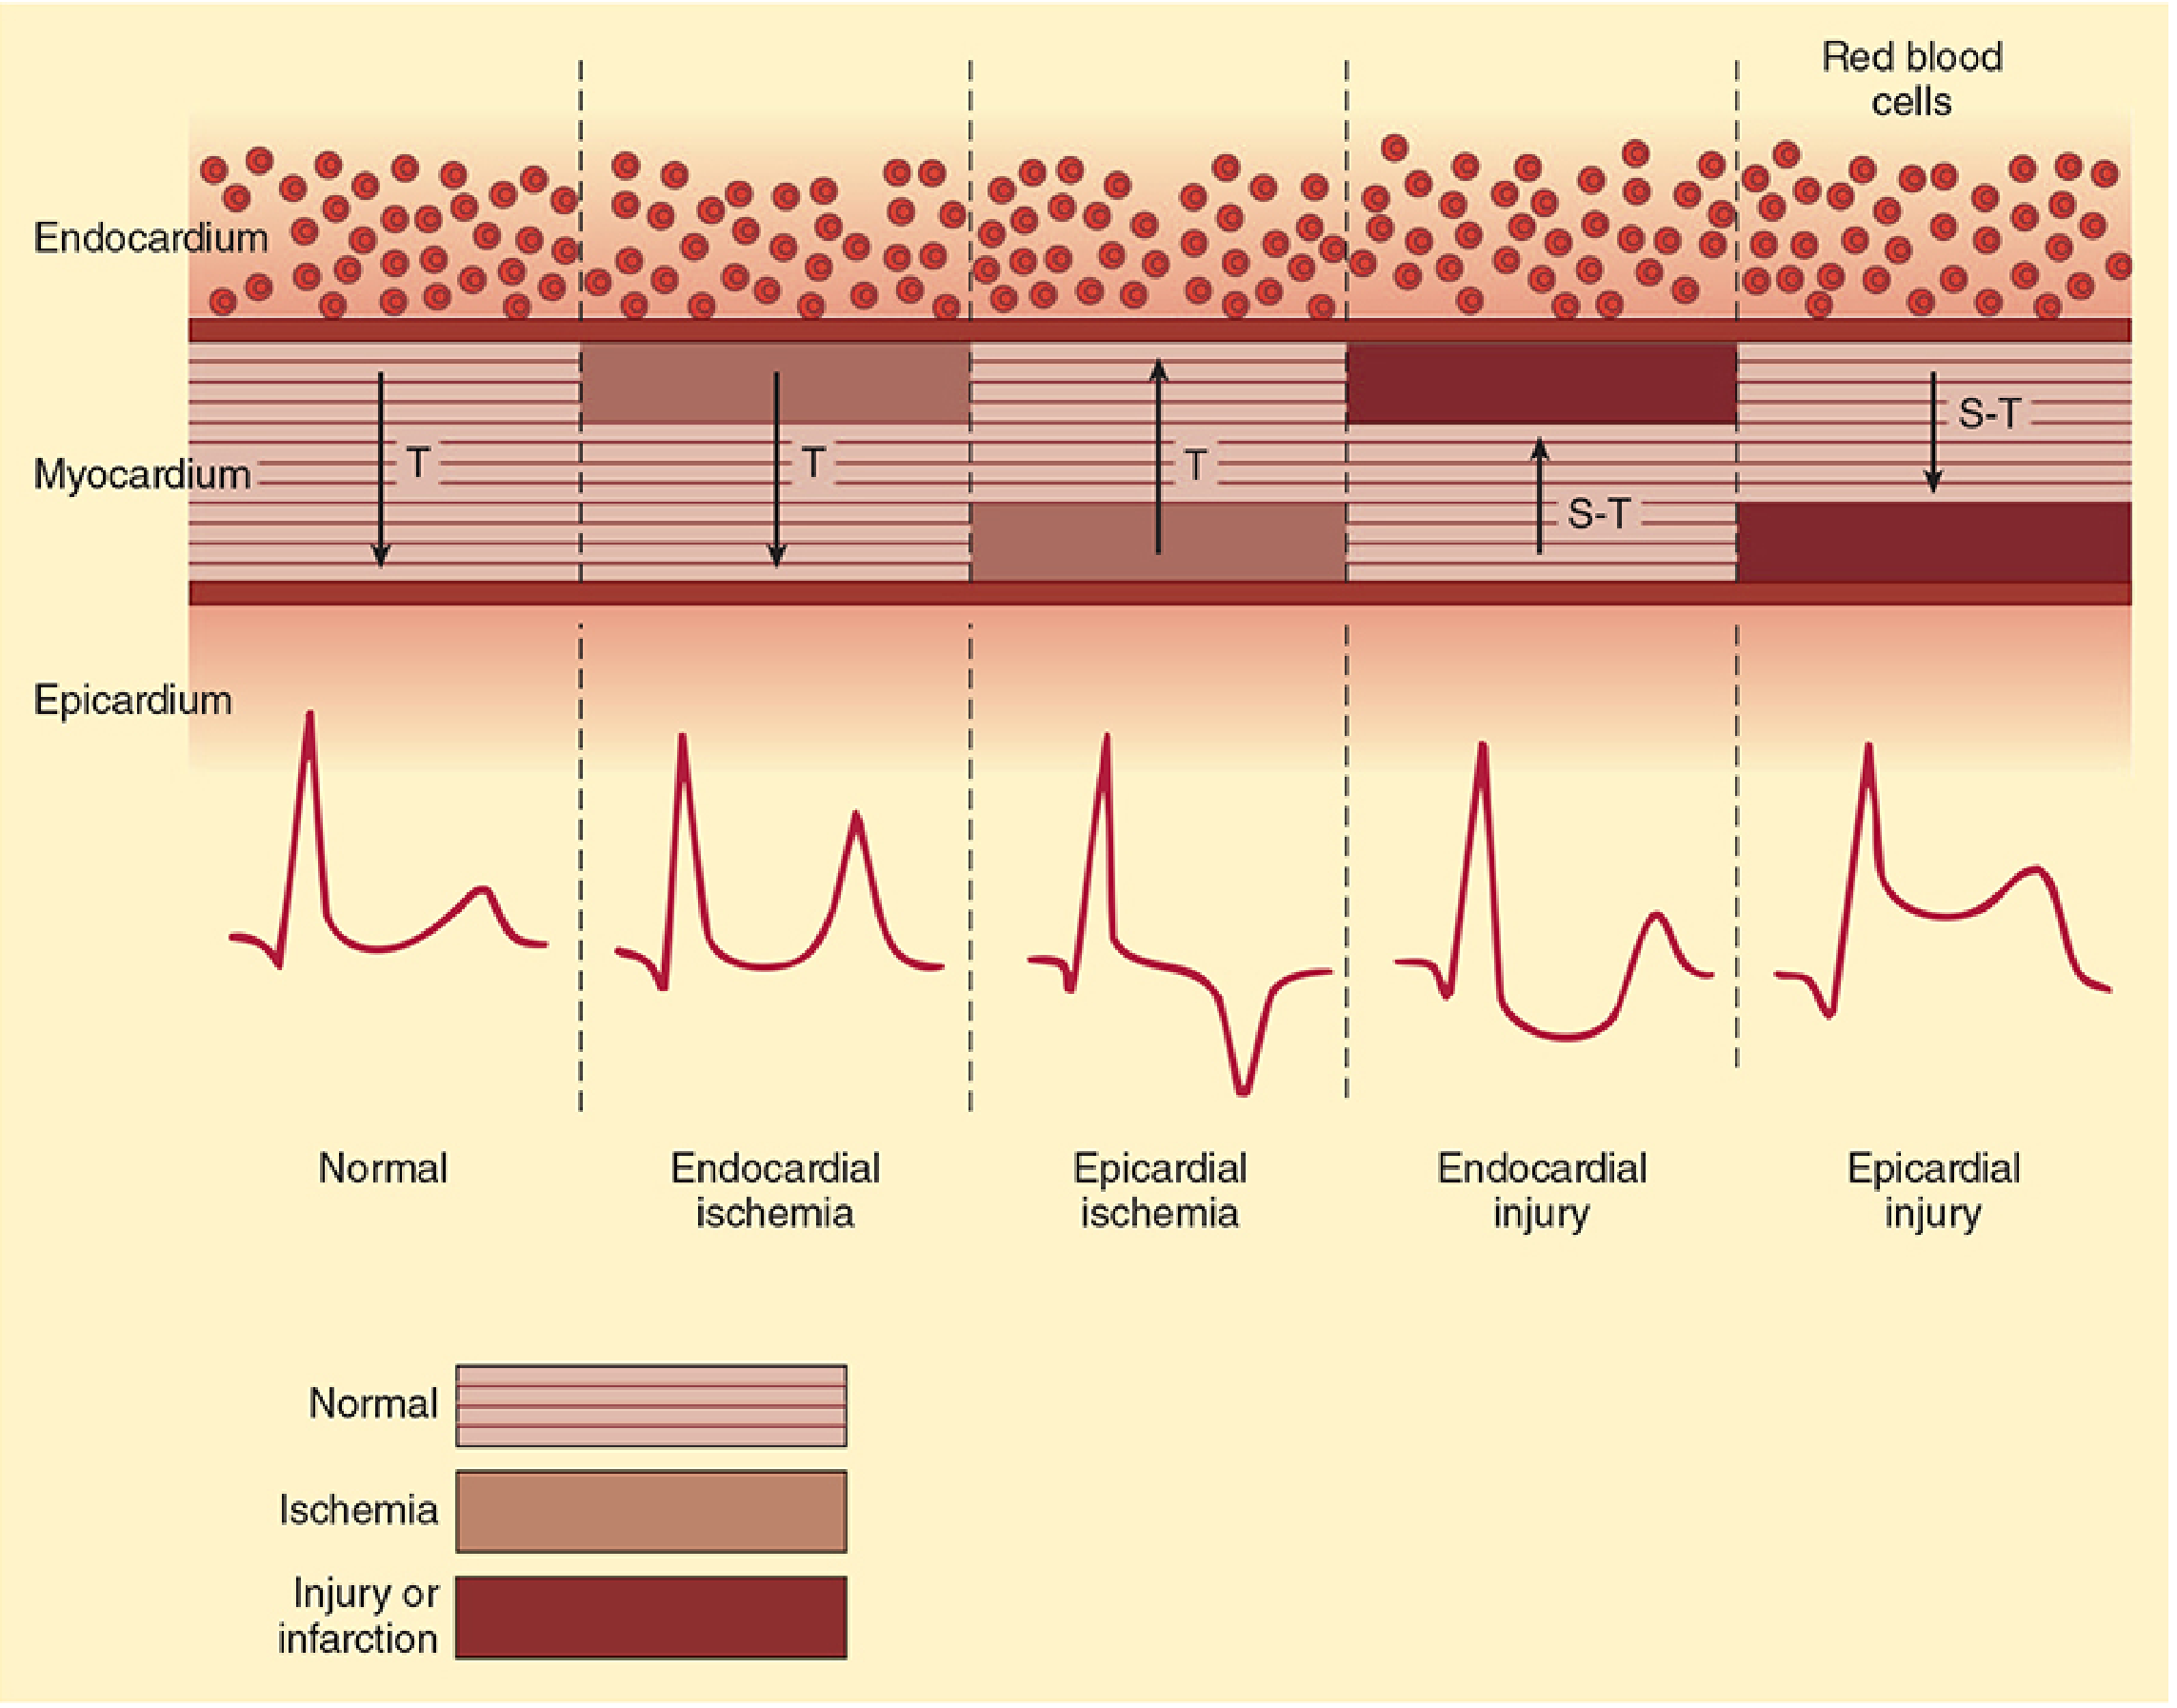
From Morgan and Mikhail's Clinical Anesthesiology. This diagram correlates the myocardial layer affected with the ECG pattern:
| Pattern | Layer Affected | ECG Finding |
|---|---|---|
| Endocardial ischemia | Subendocardium | T-wave inversion (T flips down) |
| Epicardial ischemia | Full thickness | Deep T-wave inversion (inverted in overlying lead) |
| Endocardial injury | Subendocardium | ST depression |
| Epicardial injury | Transmural | ST elevation |
Causes by Lead Location

This reference chart (The ECG Educator) maps the causes of ST depression and T-wave inversion by the leads in which they appear:
| Leads | Cause |
|---|---|
| I, aVL, V4-6 | LVH with strain |
| V1-3 | RVH or Posterior STEMI (mirror image) |
| V2-3 | Ischemia (T-wave inversion) |
| Any lead with upright QRS | Ischemia (ST depression) |
| V4-6 | Digitalis effect |
| V1-2 | RBBB |
| I, V4-5 | LBBB |
| Precordial leads | Subarachnoid hemorrhage / CVA |
| Any lead | WPW with pre-excitation |
Key Clinical Points (Harrison's & Frameworks for IM)
- T-wave inversion - reflects nontransmural, intramyocardial ischemia. Diagnostic criterion: ≥0.1 mV inversion in 2 contiguous leads with prominent R wave or R/S ratio >1
- ST depression - reflects patchy subendocardial ischemia. Diagnostic criterion: new horizontal or downsloping ST depression ≥0.05 mV in 2 contiguous leads
- Downsloping and horizontal ST depressions are more specific for ischemia than upsloping depression
- In the context of ACS without ST elevation, these findings indicate NSTEMI or unstable angina - troponin elevation distinguishes the two
For a thorough video walkthrough of these ECG changes in the clinical context of NSTEMI:
This is a shared conversation. Sign in to Orris to start your own chat.