
Explain absorption of monosaccharide
monosaccharide absorption intestinal enterocyte glucose transport
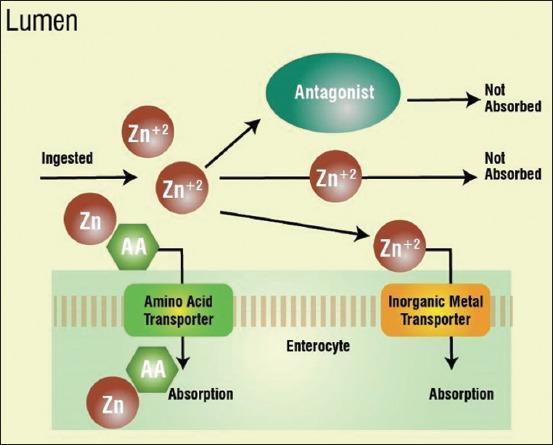
A pathophysiology diagram illustrating the mineral absorption mechanisms within the intestinal lumen and enterocyte, specifically focusing on zinc (Zn/Zn+2). The diagram delineates three primary pathways for ingested minerals. 1) Organic absorption: Zinc (Zn) complexed with amino acids (AA) utilizes a specific Amino Acid Transporter on the enterocyte membrane, leading to successful absorption. 2) Inorganic absorption: Free ionic zinc (Zn+2) utilizes a dedicated Inorganic Metal Transporter to enter the enterocyte. 3) Non-absorption: Ionic zinc (Zn+2) that remains free or interacts with dietary antagonists (e.g., phytates or oxalates, labeled as 'Antagonist') fails to be transported, resulting in a 'Not Absorbed' outcome. The visual contrasts the efficiency of chelated organic minerals versus inorganic forms and highlights the role of competitive inhibition by antagonists. Key anatomical landmarks include the lumen and the apical membrane of the enterocyte. This illustration serves educational purposes in gastroenterology and clinical nutrition regarding bioavailability and trace element metabolism.
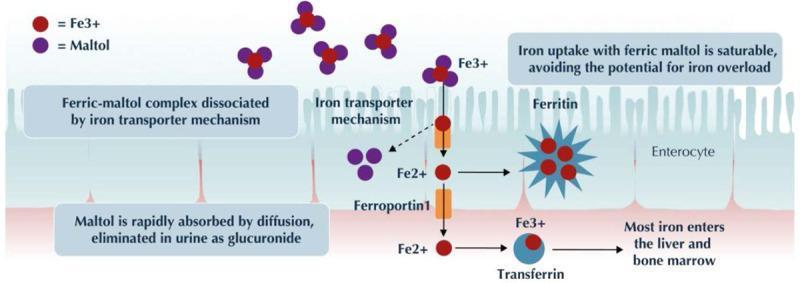
This pathophysiology diagram illustrates the mechanism of action for ferric maltol, an oral iron-replacement therapy. The visual depicts the intestinal lumen containing ferric maltol complexes, shown as clusters of one red ferric iron (Fe3+) sphere bound to three purple maltol spheres. The diagram outlines the transport process across an enterocyte, characterized by its brush border. At the apical membrane, the 'iron transporter mechanism' dissociates the complex, allowing Fe3+ to enter the cell while maltol is released. Once inside the enterocyte, iron is either stored in a star-shaped ferritin complex or exported via ferroportin 1 into the basolateral space. In the systemic circulation, iron (depicted as Fe2+) binds to transferrin for transport to the liver and bone marrow. Key annotations emphasize that the uptake is saturable, which helps avoid iron overload, and that the maltol component is eliminated via the kidneys. This educational illustration is designed for medical students and clinicians to understand iron pharmacokinetics and gastrointestinal absorption pathways.
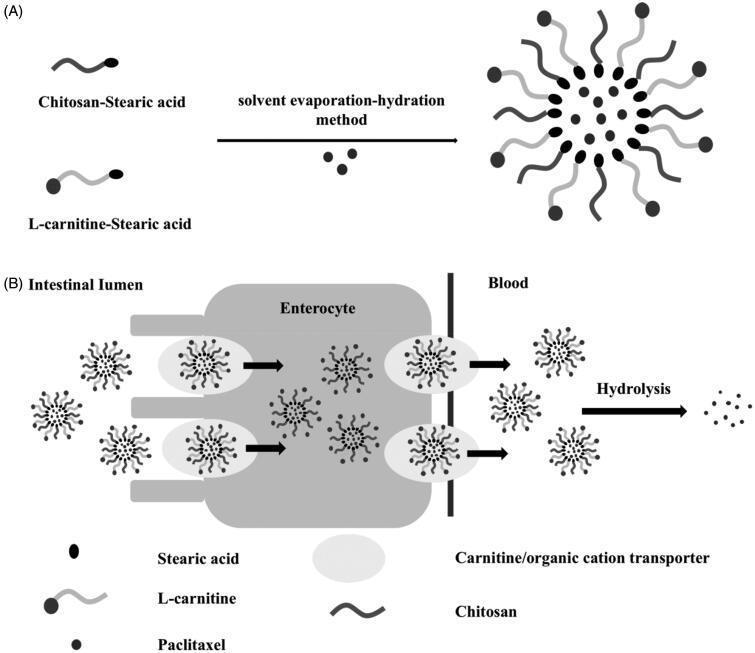
A two-part schematic diagram detailing the preparation and absorption mechanism of paclitaxel-loaded polymeric micelles for oral delivery. (A) Preparation phase: Illustrates the synthesis of PTX-loaded LC-SA/CS-SA micelles using the solvent evaporation-hydration method. Individual components including Chitosan-Stearic acid (CS-SA), L-carnitine-Stearic acid (LC-SA), and paclitaxel molecules are shown self-assembling into a spherical micelle structure with a hydrophobic core and a functionalized outer shell. (B) Absorption mechanism: Depicts the intestinal transport of intact micelles from the intestinal lumen across the enterocyte membrane. The process is facilitated by carnitine/organic cation transporters (OCTN2), represented by oval docking sites on the brush border. Following transepithelial transport, the micelles enter the bloodstream where they undergo hydrolysis, releasing the encapsulated paclitaxel along with stearic acid, L-carnitine, and chitosan components. This illustration demonstrates a targeted drug delivery strategy to improve the bioavailability of lipophilic drugs like paclitaxel via the carnitine transporter pathway.
![This diagnostic image displays comparative microPET scans showing the distribution of 2-deoxy-2-[18F]fluoro-D-glucose (2-FDG) in wild-type and Glut2–/– mouse models. Coronal (c) and sagittal (s) sections are presented for each genotype 60 minutes after orogastric gavage. Tracer activity is visualized using a pseudocolor intensity scale where red represents maximum activity and purple represents minimum activity. Key anatomical volumes of interest (VOIs) are delineated and labeled: brain (br), heart (h), stomach (st), intestine (in), and urinary bladder (bl). In both models, high activity is visible in the bladder (bl) and brain (br). A significant comparative finding is the high 2-FDG retention in the stomach (st) of the Glut2–/– mice (indicated by intense red/orange coloration) compared to the wild-type, suggesting impaired gastric emptying or altered glucose transport. The scans illustrate the physiological processes of gastric emptying and intestinal absorption, emphasizing the role of GLUT2 in glucose pharmacokinetics and metabolic distribution.](https://cdn.orris.care/cdss_images/pmc_clinical_VQA_798c14e2460242ed1996ae958fe494fdb35feebcde70caff9c7171962ac3f2fe.jpg)
This diagnostic image displays comparative microPET scans showing the distribution of 2-deoxy-2-[18F]fluoro-D-glucose (2-FDG) in wild-type and Glut2–/– mouse models. Coronal (c) and sagittal (s) sections are presented for each genotype 60 minutes after orogastric gavage. Tracer activity is visualized using a pseudocolor intensity scale where red represents maximum activity and purple represents minimum activity. Key anatomical volumes of interest (VOIs) are delineated and labeled: brain (br), heart (h), stomach (st), intestine (in), and urinary bladder (bl). In both models, high activity is visible in the bladder (bl) and brain (br). A significant comparative finding is the high 2-FDG retention in the stomach (st) of the Glut2–/– mice (indicated by intense red/orange coloration) compared to the wild-type, suggesting impaired gastric emptying or altered glucose transport. The scans illustrate the physiological processes of gastric emptying and intestinal absorption, emphasizing the role of GLUT2 in glucose pharmacokinetics and metabolic distribution.
Absorption of Monosaccharides
Overview
Step 1: Digestion to Monosaccharides (Prerequisites)
| Disaccharide | Enzyme | Products |
|---|---|---|
| Maltose / maltotriose | Maltase-glucamylase | Glucose + Glucose |
| Sucrose | Sucrase | Glucose + Fructose |
| Lactose | Lactase | Glucose + Galactose |
| Trehalose | Trehalase | Glucose + Glucose |
| alpha-limit dextrins | Isomaltase | Glucose units |
Step 2: Entry into the Enterocyte (Apical/Brush Border Membrane)
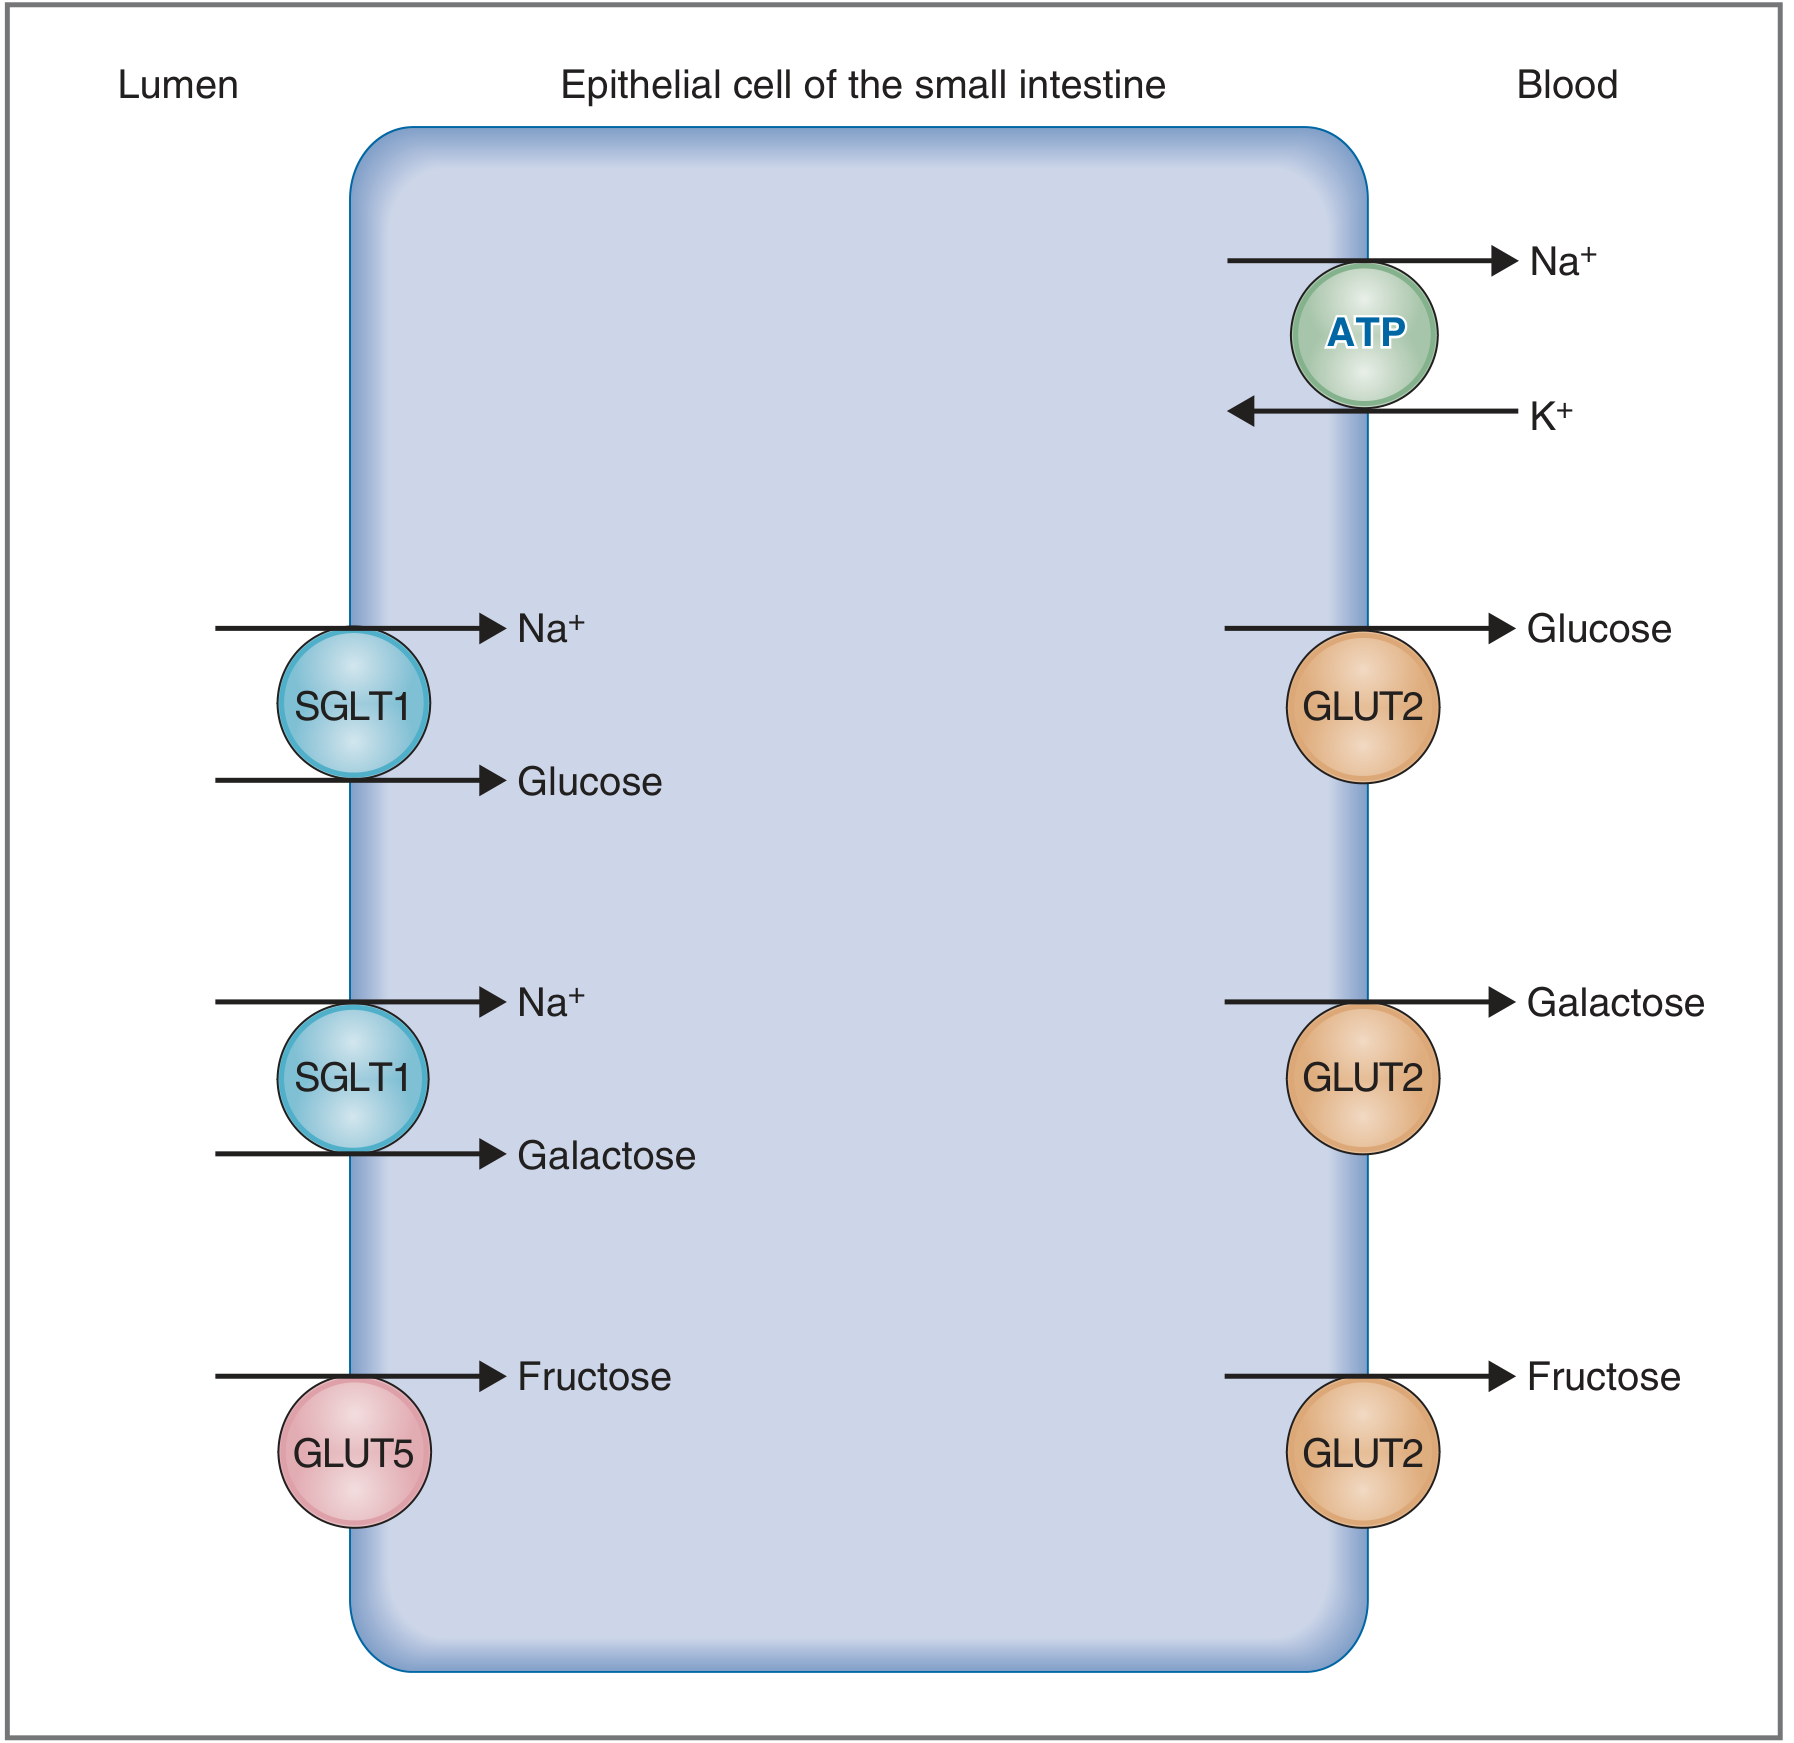
Glucose and Galactose - Secondary Active Transport via SGLT1
- Transported by SGLT1 (Sodium-Glucose Linked Transporter 1, also SLC5A1) on the apical/brush-border membrane (BBM).
- SGLT1 is a Na+-dependent cotransporter - each transport cycle moves 1 monosaccharide + 2 Na+ ions into the cell simultaneously.
- This is secondary active transport: the energy does not come directly from ATP but from the inwardly directed Na+ electrochemical gradient across the BBM. That gradient is generated and maintained by the Na+/K+-ATPase on the basolateral membrane (BLM).
- Because 2 positive charges enter the cell per cycle (both Na+ ions), the process is electrogenic - it depolarizes the membrane. Both the Na+ concentration gradient and the inside-negative membrane potential drive this transport.
- SGLT1 accepts either glucose or galactose as substrate but not both simultaneously.
- This mechanism allows glucose and galactose to be absorbed against their own concentration gradients (true uphill transport).
Fructose - Facilitated Diffusion via GLUT5
- Transported by GLUT5 (SLC2A5) on the apical membrane.
- This is passive, energy-independent facilitated diffusion with no involvement of Na+.
- Fructose cannot be absorbed against its concentration gradient - it moves only down its concentration gradient.
- SGLT1 plays no role in fructose transport.
Step 3: Exit from Enterocyte to Portal Blood (Basolateral Membrane)
- GLUT2 is a low-affinity facilitated sugar transporter.
- It accepts glucose, galactose, and fructose as substrates.
- Net release of sugars from the cell occurs only when intracellular sugar concentrations exceed those in portal blood (down-gradient release).
- The low affinity is physiologically appropriate - it ensures sugars accumulate inside the cell first before being released into the circulation.
GLUT2 Recruitment to the Apical Membrane Under High Sugar Load
- Under normal/low luminal sugar loads, GLUT2 is expressed only at the BLM.
- When the intestinal lumen faces a high sugar load, SGLT1-mediated glucose entry acts as a signal for GLUT2 to traffic to the BBM as well.
- Since SGLT1 is high-affinity but low-capacity, it becomes inefficient at high concentrations. GLUT2 at the BBM (low-affinity, high-capacity) supplements absorption.
- This also enhances fructose absorption, since GLUT5 has limited capacity but GLUT2 at the BBM can absorb fructose when luminal concentrations are high.
Summary Diagram
Summary Table
| Monosaccharide | Apical Transporter | Mechanism | Basolateral Transporter |
|---|---|---|---|
| Glucose | SGLT1 | Secondary active (Na+-coupled) | GLUT2 |
| Galactose | SGLT1 | Secondary active (Na+-coupled) | GLUT2 |
| Fructose | GLUT5 | Facilitated diffusion | GLUT2 |
Clinical Relevance
- Glucose-Galactose Malabsorption: A rare autosomal recessive disorder caused by mutations in SGLT1. Results in severe osmotic diarrhea in neonates. The unabsorbed sugars remain in the lumen, causing osmotic water secretion.
- Lactase Deficiency (Lactose Intolerance): Failure to hydrolyze lactose to glucose + galactose means the disaccharide cannot be absorbed (SGLT1/GLUT5 only accept monosaccharides). Undigested lactose is fermented by colonic bacteria causing gas, bloating, and diarrhea.
- Alpha-glucosidase inhibitors (acarbose, miglitol): Delay intestinal monosaccharide absorption by preventing complex carbohydrate breakdown. Used in Type 2 diabetes management.
- Fructose malabsorption: Since fructose relies solely on facilitated diffusion (GLUT5), high fructose intake (e.g., HFCS in foods) can overwhelm the capacity of GLUT5, leading to osmotic diarrhea and bloating.
In ors why salt is added and whats the role os water in this absorp on monosaccharide
Why Salt is Added to ORS - and the Role of Water in Monosaccharide Absorption
The Core Principle: Na+-Glucose Cotransport (SGLT1)
SGLT1 on the enterocyte brush-border membrane cotransports 1 glucose (or galactose) molecule together with 2 Na+ ions simultaneously into the cell.
Why Salt (NaCl) is Added to ORS
The Driving Force Relationship
Na+/K+-ATPase (basolateral)
        ↓ pumps Na+ OUT of cell
        ↓ creates low intracellular Na+
        ↓ creates Na+ electrochemical gradient across apical membrane
        ↓
SGLT1 uses this gradient to pull Na+ INTO the cell
        ↓ glucose is dragged along with it (cotransport)
- The gut is secreting massive amounts of Na+, Cl-, and water into the lumen.
- The normal Na+-dependent absorption mechanisms are disrupted.
- However - SGLT1 remains functional even during secretory diarrhea. This is the crucial discovery that made ORS possible.
- Supply Na+ to drive SGLT1.
- SGLT1 cotransports both Na+ and glucose into the enterocyte.
- Na+ is then pumped out basolaterally by Na+/K+-ATPase into the bloodstream.
- Chloride follows Na+ passively (electrochemical attraction) - so chloride is also absorbed.
- Water follows osmotically - this is the rescue mechanism.
The Role of Water in Monosaccharide Absorption
1. Water as a "Passenger" - Cotransported with SGLT1
Each monosaccharide molecule transported by SGLT1 brings along approximately 264 molecules of water.
- Yamada's Textbook of Gastroenterology states: "SGLT1 also has a major role in the absorption of luminal water. Each monosaccharide molecule is transported with ~264 molecules of water, resulting in the net absorption of 5-6 L of water per day, and thus the rationale for adding glucose to oral rehydration solutions."
2. Water as a "Follower" - Osmotic/Solvent Drag
- The blood becomes slightly hypertonic relative to the lumen.
- Water moves osmotically from lumen → enterocyte → blood to re-establish equilibrium.
- This is called osmotic coupling or solvent drag.
Why the Glucose:Na+ Ratio Matters (ORS Composition)
| Component | Reduced-Osmolarity ORS (WHO 2004) | Role |
|---|---|---|
| Glucose (anhydrous) | 13.5 g/L (75 mmol/L) | Drives SGLT1, carries water |
| Sodium chloride | 2.6 g/L → Na+ 75 mmol/L | Provides Na+ for cotransport |
| Potassium chloride | 1.5 g/L → K+ 20 mmol/L | Replaces K+ lost in diarrhea |
| Trisodium citrate | 2.9 g/L → citrate 10 mmol/L | Corrects acidosis |
| Total osmolarity | 245 mOsm/L | Slightly hypotonic to plasma |
- Glucose:Na+ ratio is approximately 1:1 (both at 75 mmol/L) - this optimally loads SGLT1.
- Reduced osmolarity (245 vs old 311 mOsm/L) - a hypotonic solution is better absorbed; hyperosmolar fluids draw water INTO the lumen, worsening diarrhea.
- Na+ concentration at least 75-90 mmol/L is required to meaningfully drive cotransport.
- Sports drinks like Gatorade (~20 mmol/L Na+) are NOT adequate replacements - they have far too little sodium.
Summary: The "Glucose-Na+ Pump" Concept
Lumen                  Enterocyte              Blood
  |                        |                     |
  | Glucose + 2Na+  →  SGLT1  → glucose+Na+ in   |
  |  + ~264 H2O  ─────────────────────────────►  |
  |                        |    Na+/K+-ATPase     |
  |                        |    pumps Na+ out  ──►|
  |                        |    GLUT2: glucose ──►|
  |                        |    H2O follows  ────►|