
Explain ecg in detail with diagram
Reading File
Now let me search the medical library for ECG content, including diagrams.
Finding Sources
Searching the Web
ECG electrocardiogram detailed explanation waves intervals diagram
Reading File
Loading Image
Loading Image
Loading Image
Finding Sources
Excellent! Now let me read the detailed ECG content from Guyton and Harrison's, which are the most authoritative sources.
Reading File
Reading File
Loading Image
Reading File
Loading Image
Reading File
I now have excellent textbook content and diagrams. Let me fetch the Guyton action potential + ECG diagram for completeness.
Loading Image
I now have all the material needed to write a comprehensive, diagram-rich ECG explanation. Here is the full response:
Electrocardiogram (ECG) - A Detailed Explanation
What Is an ECG?
An ECG is a surface recording of the electrical activity of the heart. When a cardiac impulse passes through the myocardium, electrical currents spread into surrounding tissues and reach the body surface. Electrodes placed on the skin detect tiny voltage differences produced by these currents, and the recording device plots them over time as a continuous waveform.
- Guyton and Hall Textbook of Medical Physiology, p. 142
The Cardiac Conduction System - The Origin of the ECG Signal
Before reading an ECG, you need to understand where the electricity comes from.
Cardiac conduction pathway (SA node → AV node → His bundle → Bundle branches → Purkinje fibers → Ventricular myocardium):
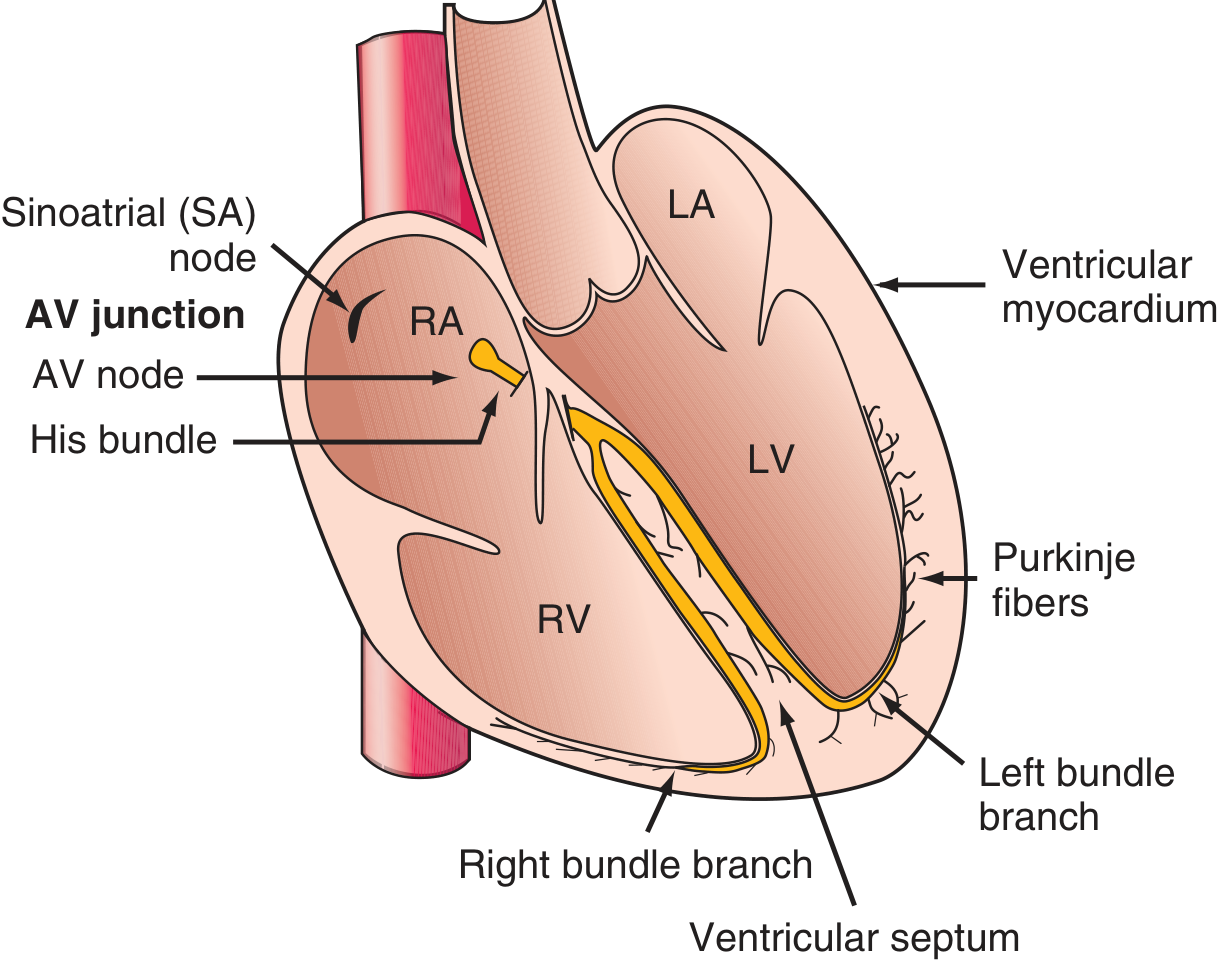
The sequence:
- SA node (right atrium, near SVC junction) - the natural pacemaker, fires spontaneously at 60-100 bpm
- Depolarization spreads across both atria → atrial contraction → produces the P wave
- Impulse reaches the AV node - conduction deliberately slows here (physiologic delay ~100-200 ms), allowing ventricles to fill before contracting → produces the PR interval
- Impulse passes through the Bundle of His → splits into right and left bundle branches
- Left bundle branch fans into left anterior and left posterior fascicles
- Signal reaches Purkinje fibers → rapidly activates ventricular myocardium endocardium-to-epicardium → produces the QRS complex
- Ventricular muscle then repolarizes → produces the T wave
- Harrison's Principles of Internal Medicine 22E, p. 1911
The Normal ECG Waveform - All Waves and Intervals
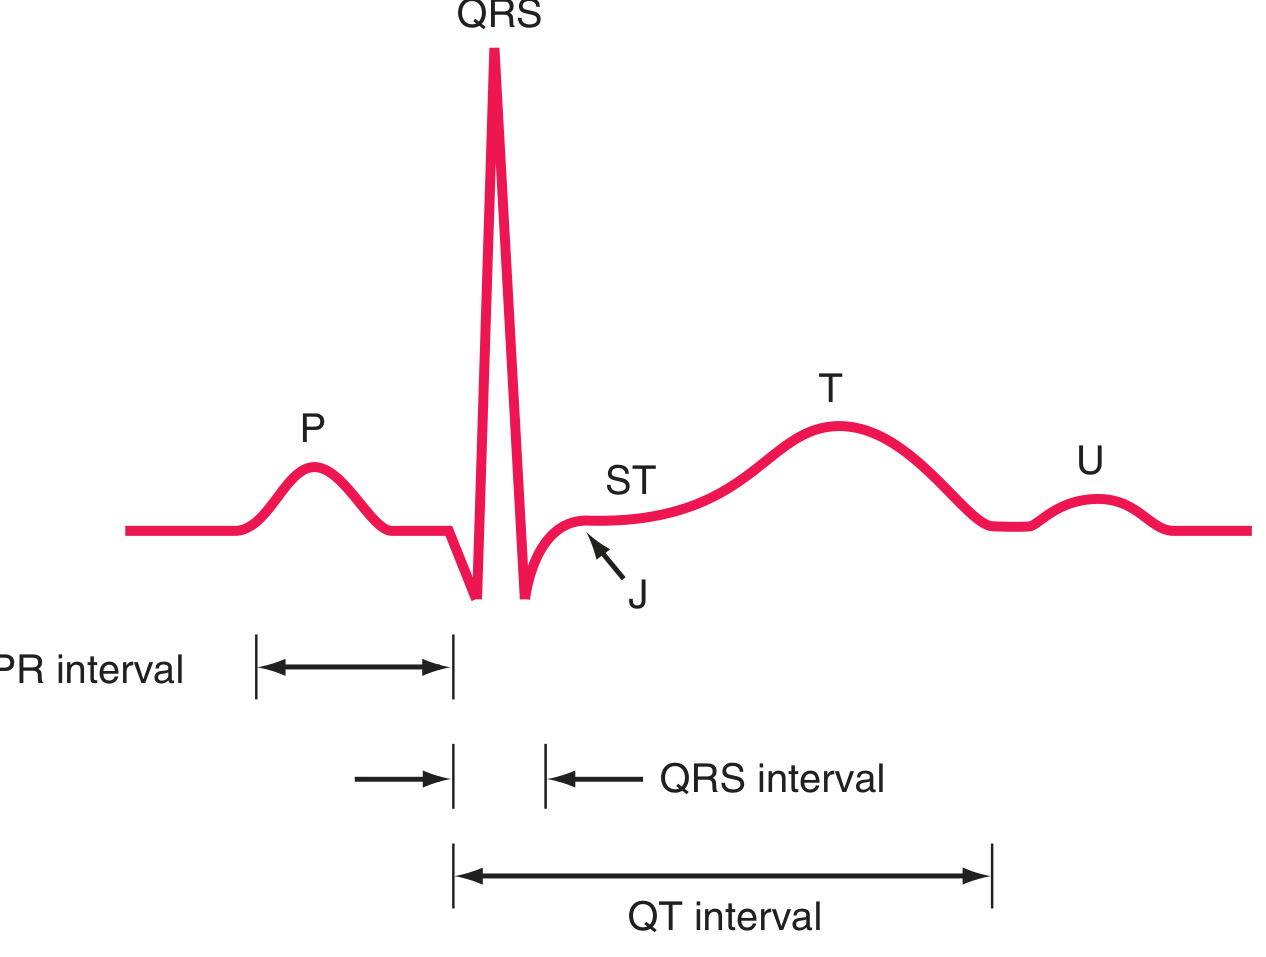
The Complete ECG Diagram with Labeled Intervals:
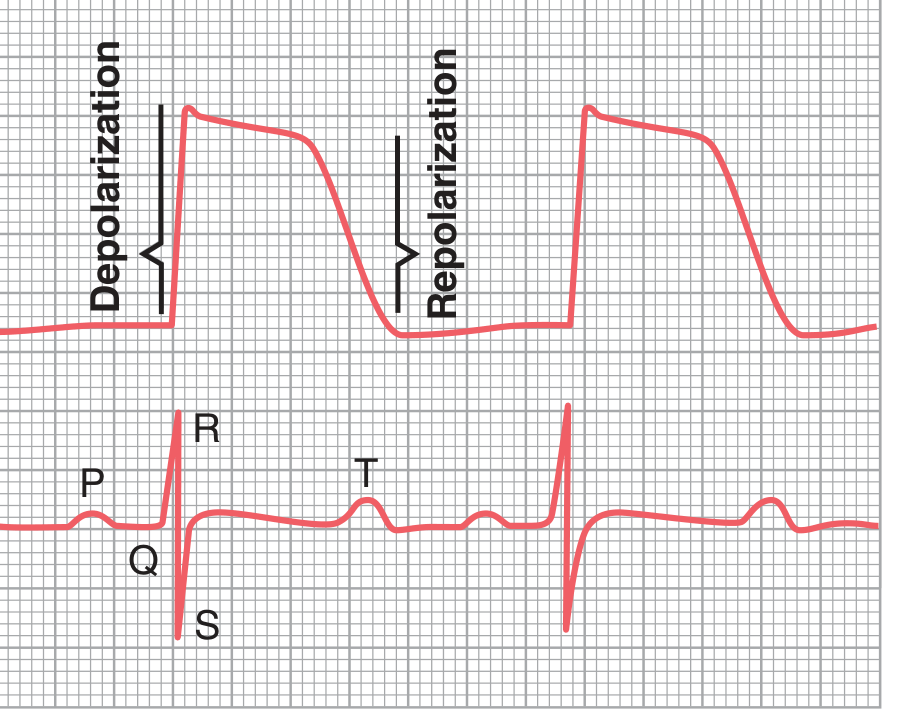
Relationship of ECG to the Action Potential:
Each Wave Explained in Detail
1. P Wave
- Represents: Atrial depolarization
- Duration: 80-100 ms (0.08-0.10 s)
- Amplitude: Up to 2.5 mm in height; up to 120 ms in width
- Morphology: Small, rounded, positive in leads I, II, aVF, V4-V6
- Physiology: SA node fires → depolarization spreads across right then left atrium → atrial contraction begins at the onset of P wave
- Note: Atrial repolarization (atrial T wave) also occurs, but it is buried under the large QRS complex and is not normally visible
2. PR Interval
- Measured: From start of P wave to start of QRS complex
- Normal: 120-200 ms (3-5 small squares on ECG paper)
- Represents: Time from start of atrial depolarization to start of ventricular depolarization - essentially the AV nodal delay
- Clinical significance:
- Short PR (<120 ms) → Pre-excitation (e.g., WPW syndrome) or junctional rhythm
- Long PR (>200 ms) → First-degree AV block
3. PR Segment
- The flat (isoelectric) line between the end of the P wave and the start of QRS
- Represents electrical silence while the impulse creeps through the AV node and His bundle
- Used as the baseline reference for measuring ST deviation
4. QRS Complex
- Represents: Ventricular depolarization
- Normal duration: 80-100 ms (up to 110 ms is acceptable); if >120 ms → bundle branch block
- Components:
- Q wave - first negative deflection; represents initial septal depolarization (left to right)
- R wave - first positive deflection after Q; tall R in lateral leads means good left ventricular function
- S wave - negative deflection after R; represents basal depolarization
- Physiology: Rapid phase 0 upstroke of the ventricular action potential corresponds to QRS onset; impulse travels endocardium → epicardium via Purkinje system
- Clinical significance: Wide QRS (>120 ms) = LBBB, RBBB, hyperkalemia, ventricular tachycardia, or sodium channel blockers
5. ST Segment
- From: J point (junction of QRS end and ST start) to start of T wave
- Normal: Isoelectric (on the baseline); corresponds to phase 2 (plateau) of action potential when all ventricular cells are equally depolarized so no net current flows
- J point - the junction between QRS and ST segment
- Clinical significance:
- ST elevation → STEMI (transmural ischemia), pericarditis, Brugada syndrome
- ST depression → NSTEMI, subendocardial ischemia, digoxin effect
6. T Wave
- Represents: Ventricular repolarization
- Duration: 0.10-0.25 s (prolonged because repolarization is not simultaneous - different fibers repolarize at different times, from epicardium to endocardium, opposite to depolarization)
- Normal morphology: Upright and asymmetric; ascending limb is gradual, descending limb is steeper; positive in I, II, V3-V6
- Clinical significance:
- Peaked T waves → Hyperkalemia (earliest change), hyperacute STEMI
- Flat/inverted T waves → Ischemia, LVH, bundle branch block, electrolyte disturbance
7. QT Interval
- Measured: From start of QRS to end of T wave
- Represents: Total ventricular depolarization + repolarization time
- Normal: Rate-dependent; corrected QT (QTc) should be <450 ms in men, <460 ms in women (Framingham formula: QTc = QT + 0.154 × (1000 - RR) in ms)
- Physiology: Corresponds to phases 0, 1, 2, and 3 of ventricular action potential
- Clinical significance: Prolonged QTc → risk of Torsades de Pointes and sudden death; caused by drugs (amiodarone, antipsychotics, macrolides), hypocalcemia, hypokalemia, hypomagnesemia, congenital long QT syndromes
8. U Wave
-
Small, positive deflection after T wave (not always visible)
-
Origin: Likely late repolarization of Purkinje fibers or mid-myocardial M cells
-
More prominent in: Hypokalemia, bradycardia, hypothermia
-
Inverted U wave → may indicate ischemia or LVH
-
Guyton and Hall Textbook of Medical Physiology, p. 143-144
-
Harrison's Principles of Internal Medicine 22E, pp. 1911-1912
ECG Grid Paper - How to Read the Paper
| Division | Time | Voltage |
|---|---|---|
| 1 small square (1 mm) | 40 ms (0.04 s) | 0.1 mV |
| 1 large square (5 mm) | 200 ms (0.20 s) | 0.5 mV |
| 5 large squares | 1000 ms (1 s) | 2.5 mV |
| Standard calibration | - | 1 mV = 10 mm |
Paper speed: Standard = 25 mm/s
Heart rate calculation:
- Count RR interval in large squares → Rate = 300 ÷ (number of large squares between R waves)
- Or: Rate = 1500 ÷ (number of small squares between R waves)
The 12-Lead ECG - Viewing the Heart from Multiple Angles
The standard ECG uses 12 leads - each is like a different camera angle looking at the same electrical events:
Limb Leads (Frontal Plane):
| Lead | View |
|---|---|
| Lead I | Lateral (left) |
| Lead II | Inferior |
| Lead III | Inferior |
| aVR | Right shoulder (cavity) |
| aVL | Lateral (high left) |
| aVF | Inferior |
Precordial (Chest) Leads (Horizontal Plane):
| Lead | Position | View |
|---|---|---|
| V1 | 4th ICS, right sternal border | Septal |
| V2 | 4th ICS, left sternal border | Septal |
| V3 | Between V2 and V4 | Anterior |
| V4 | 5th ICS, midclavicular line | Anterior |
| V5 | 5th ICS, anterior axillary line | Lateral |
| V6 | 5th ICS, midaxillary line | Lateral |
- Harrison's Principles of Internal Medicine 22E, p. 1912
ECG in Context of the Cardiac Cycle
The diagram below correlates the ECG with ventricular pressure, aortic blood flow, heart sounds, and ventricular volume across a single cardiac cycle:
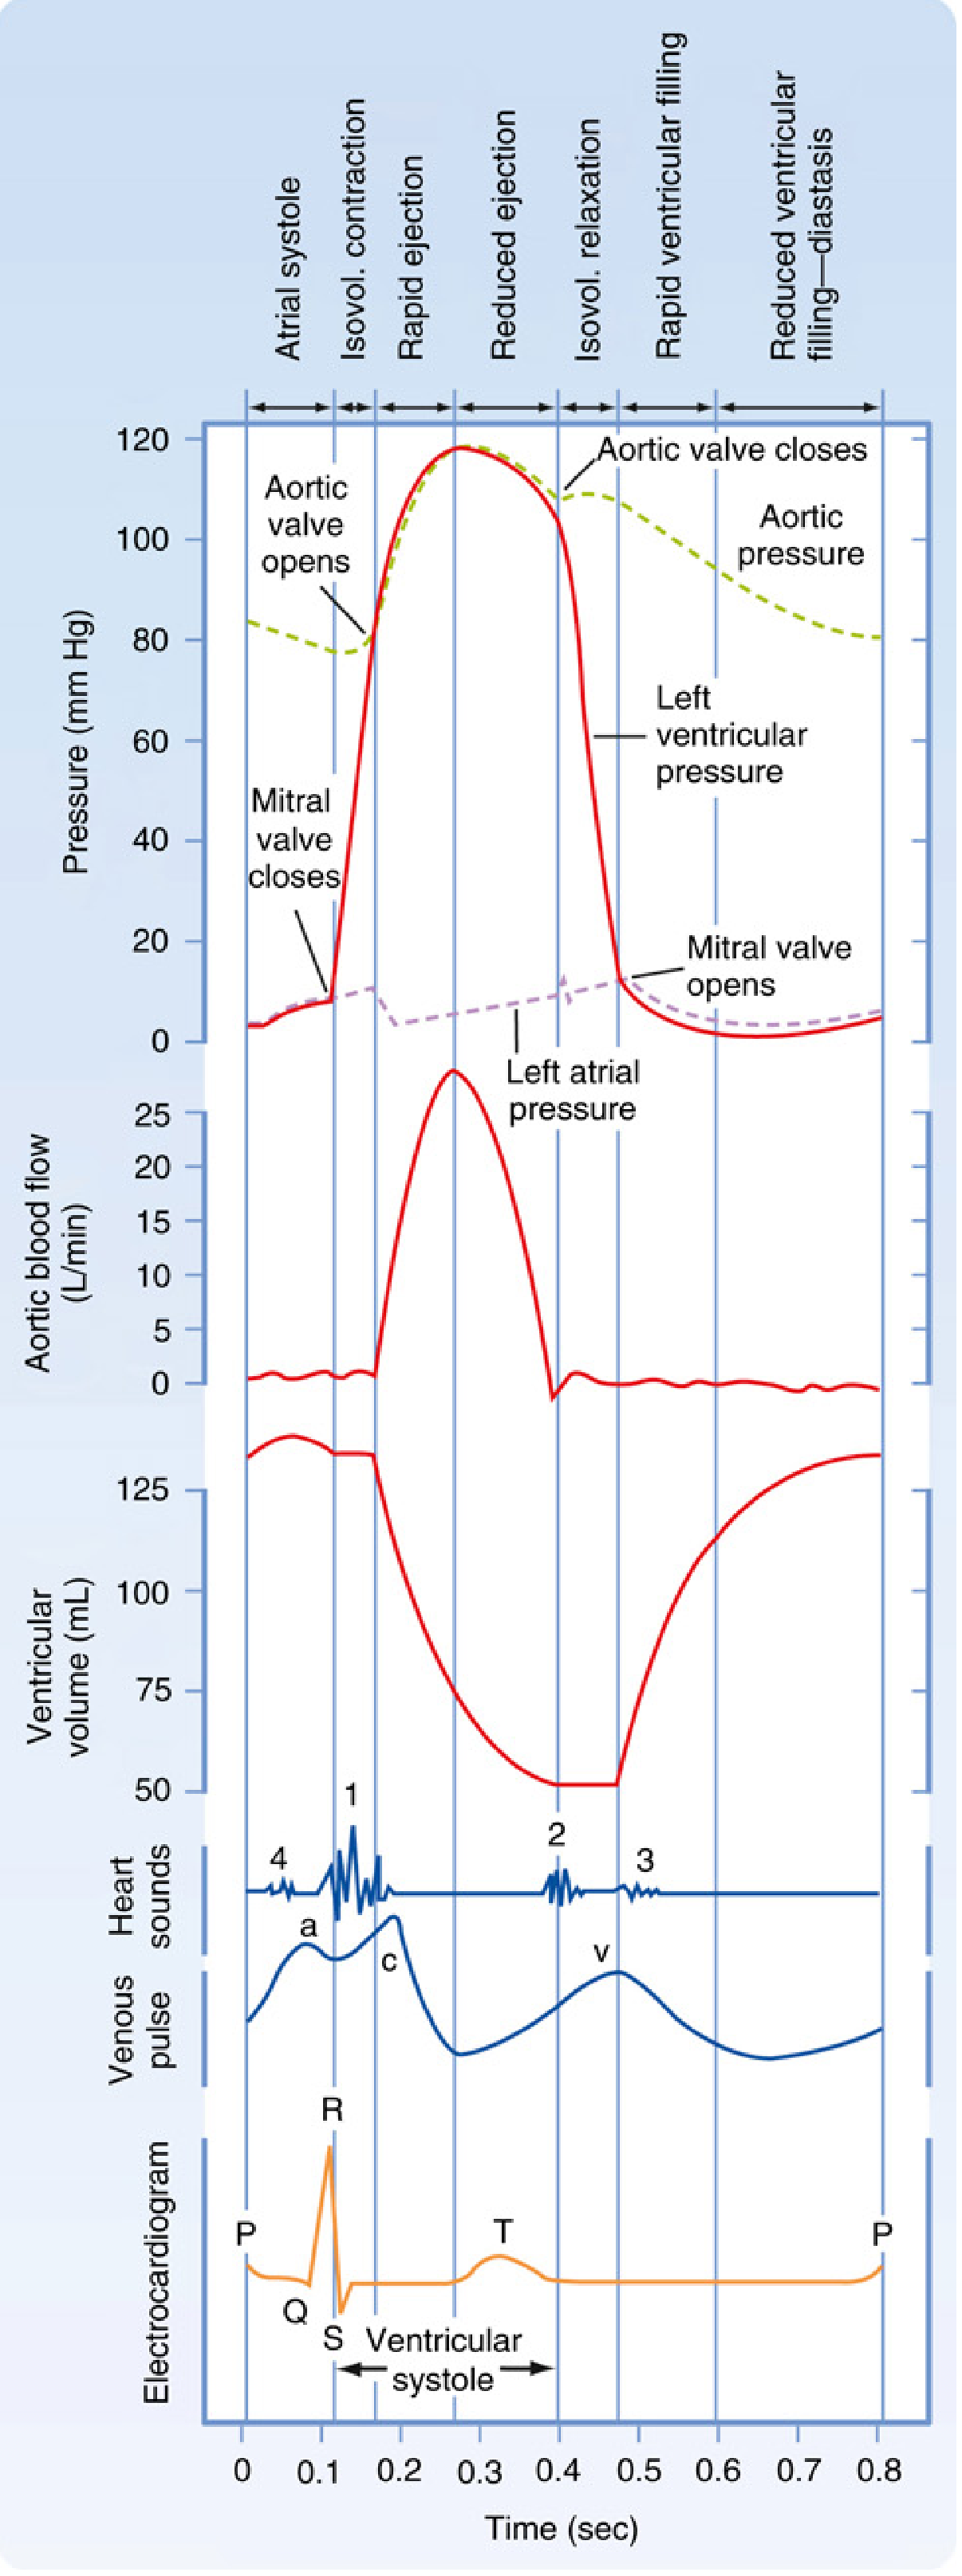
Key correlations from this diagram:
- P wave → Atrial systole ("atrial kick")
- End of R wave → Mitral/tricuspid valve closure (S1 heart sound); beginning of isovolumic contraction
- QRS complex → Start of ventricular systole; ventricular pressure rises rapidly
- ST segment → Isovolumic contraction → then rapid ejection → aortic valve opens
- T wave → Ventricular repolarization; corresponds to end of systole and start of isovolumic relaxation
- After T wave → AV valves open; ventricular filling begins (diastole)
Quick Summary Table of Normal Intervals
| Interval/Wave | Normal Value | Represents |
|---|---|---|
| P wave duration | 80-100 ms | Atrial depolarization |
| PR interval | 120-200 ms | AV conduction time |
| QRS duration | <110 ms | Ventricular depolarization |
| ST segment | Isoelectric | Ventricular plateau |
| QT interval | <450 ms (men), <460 ms (women) | Total ventricular activity |
| QTc | <450 ms | Rate-corrected QT |
| RR interval | 600-1000 ms (60-100 bpm) | Time between beats |
Clinical Uses of the ECG
- Myocardial infarction - ST elevation, Q waves, T wave changes
- Arrhythmias - Rate, rhythm, P wave morphology, RR regularity
- Bundle branch blocks - Wide QRS (>120 ms), characteristic morphology
- Electrolyte disturbances - Hyperkalemia (tall peaked T → wide QRS → sine wave), hypokalemia (U waves, flat T), hypercalcemia (short QT)
- Drug toxicity - Digoxin (downsloping ST, short QT), quinidine/amiodarone (long QT)
- Chamber hypertrophy - Voltage criteria for LVH, RVH, atrial enlargement
- Pericarditis - Diffuse saddle-shaped ST elevation, PR depression
- Harrison's Principles of Internal Medicine 22E, pp. 1911-1916
- Guyton and Hall Textbook of Medical Physiology, p. 142-145
- Miller's Anesthesia, 10e, pp. 1364-1368
This is a shared conversation. Sign in to Orris to start your own chat.