
Explain me 10 common heart diseases with ECG changes and ECG images of those diseases
Reading File
Finding Sources
Searching Images
ECG electrocardiogram myocardial infarction ST elevation
Finding Sources
Searching Images
atrial fibrillation ECG irregularly irregular rhythm
Searching Images
heart block complete AV block ECG third degree
Searching Images
ventricular tachycardia ECG wide complex tachycardia
Searching Images
left ventricular hypertrophy ECG high voltage
Searching Images
Wolff-Parkinson-White syndrome ECG delta wave short PR
Searching Images
pericarditis ECG saddle-shaped ST elevation diffuse
Searching Images
pulmonary embolism ECG S1Q3T3 right heart strain
Searching Images
long QT syndrome ECG prolonged QT interval Torsades de Pointes
Searching Images
hypertrophic cardiomyopathy ECG deep Q waves ST changes
Here is a comprehensive guide to 10 common heart diseases with their characteristic ECG changes and illustrative ECG images.
10 Common Heart Diseases with ECG Changes
1. 🫀 ST-Elevation Myocardial Infarction (STEMI)
Pathophysiology
Complete occlusion of a coronary artery (most commonly the LAD) leads to transmural ischemia and myocyte death. The injury current creates measurable ST changes on ECG.
ECG Changes
- Hyperacute T-waves (earliest sign — tall, peaked, symmetric)
- ST elevation ≥1 mm in ≥2 contiguous leads (convex/tombstone morphology)
- Reciprocal ST depression in anatomically opposite leads
- Pathological Q waves (>40 ms wide, >25% R wave height) — sign of completed infarction
- T-wave inversions in the evolutionary phase
| Territory | Culprit Vessel | Leads with ST Elevation |
|---|---|---|
| Anterior | LAD | V1–V4 |
| Inferior | RCA | II, III, aVF |
| Lateral | LCx | I, aVL, V5–V6 |
| Posterior | RCA/LCx | ST depression V1–V3 (mirror image) |
ECG Image — Anterior STEMI (LAD Occlusion)
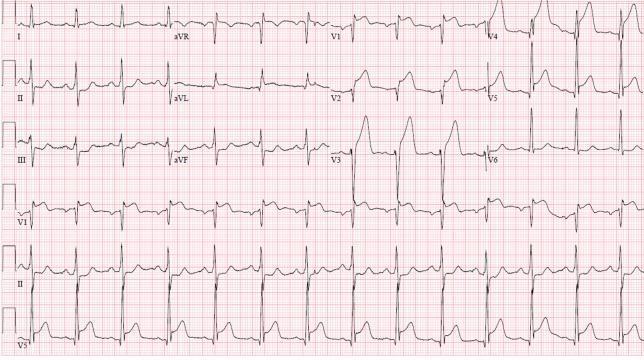
Classic anterolateral STEMI: prominent convex ST elevation in V1–V6, hyperacute T-waves in V2–V4, reciprocal depression in II, III, aVF — indicates proximal LAD occlusion.
2. ❤️ Inferior STEMI
ECG Changes
- ST elevation in II, III, aVF (inferior leads)
- ST depression in I, aVL (reciprocal high lateral changes)
- ST elevation III > II suggests RCA occlusion
- ST elevation II > III with lateral involvement suggests LCx
ECG Image — Inferolateral STEMI
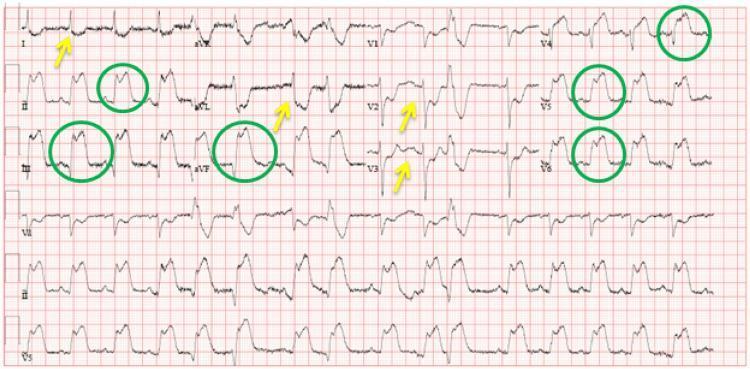
Green circles mark ST elevation in inferior and lateral leads; yellow arrows indicate reciprocal depression in high lateral leads (I, aVL) and anterior precordials.
3. 🔥 Acute Pericarditis
Pathophysiology
Inflammation of the pericardium causes diffuse epicardial irritation. The inflamed myocardium generates a broad "injury current" not confined to one vascular territory.
ECG Changes (4 Stages)
- Stage 1: Diffuse concave ("saddle-shaped") ST elevation in almost all leads (except aVR and V1); PR depression (pathognomonic); PR elevation in aVR
- Stage 2: ST returns to baseline; T-waves flatten
- Stage 3: Diffuse T-wave inversions
- Stage 4: ECG normalizes
Key differentiator from STEMI: Pericarditis ST elevation is diffuse, concave, and accompanied by PR depression. STEMI ST elevation is regional, convex, with reciprocal changes.
Spodick's sign: Downsloping TP segment (present in ~80%)
ECG Image — Acute Pericarditis
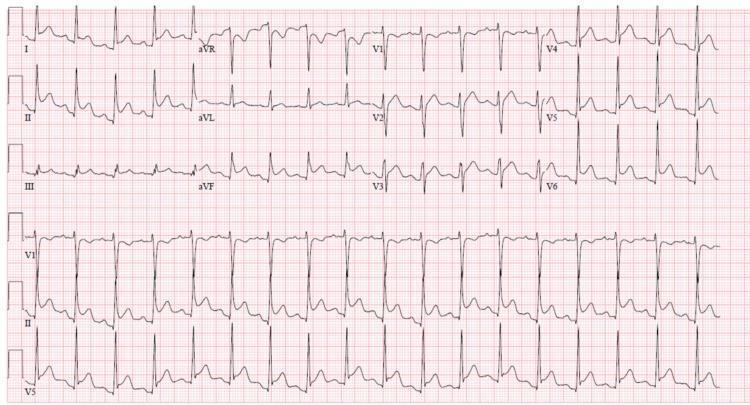
Diffuse concave ST elevation across I, II, III, aVF, V2–V6 with PR depression in II and reciprocal PR elevation in aVR — classic acute pericarditis pattern.
4. 💔 Atrial Fibrillation (AF)
Pathophysiology
Chaotic, disorganized electrical activity in the atria (firing at 350–600 bpm) with irregular AV node conduction producing an irregularly irregular ventricular response.
ECG Changes
- Absent P waves — replaced by irregular fibrillatory (f) waves, best seen in V1 and lead II
- Irregularly irregular R-R intervals (the hallmark)
- Narrow QRS (unless aberrant conduction or accessory pathway)
- Variable ventricular rate (60–180 bpm depending on AV node)
- No consistent PR interval
ECG Image — Atrial Fibrillation with Rapid Ventricular Response
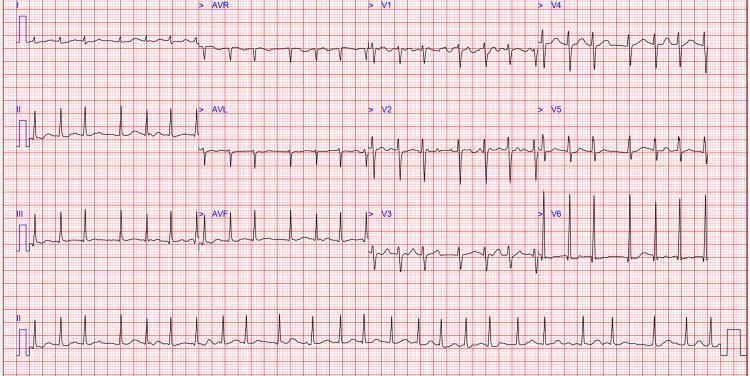
Classic AF: no organized P waves, fine fibrillatory waves at baseline (best seen in V1), completely irregular R-R intervals with narrow QRS complexes — sinus rhythm is entirely absent.
5. 🚫 Complete (Third-Degree) AV Block
Pathophysiology
Complete failure of conduction through the AV node. Atria and ventricles beat independently — the atria at the sinus rate and the ventricles at a slow escape rate (junctional 40–60 bpm or ventricular 20–40 bpm).
ECG Changes
- Complete AV dissociation — P waves and QRS complexes march independently
- Regular P-P intervals (atrial rate ~70–90 bpm)
- Slow, regular R-R intervals (escape rate 20–60 bpm)
- Wide QRS if ventricular escape (≥120 ms); narrow QRS if junctional escape (above the His bundle)
- P waves may appear before, within, or after QRS complexes — no fixed PR interval
ECG Image — Complete AV Block
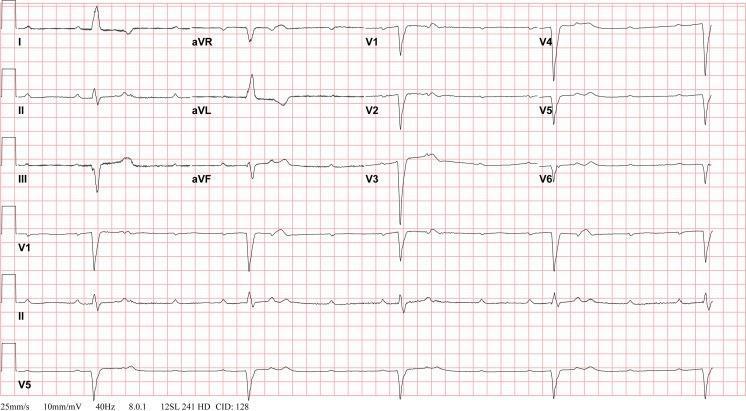
Total AV dissociation: P waves occur at a faster independent atrial rate while wide QRS escape complexes occur slowly and independently — the "P waves marching through" pattern is the defining feature.
6. ⚡ Ventricular Tachycardia (VT)
Pathophysiology
A rapid ectopic ventricular focus or re-entry circuit within the ventricular myocardium generates a fast, life-threatening tachyarrhythmia. Most commonly seen with structural heart disease (post-MI scar, cardiomyopathy).
ECG Changes
- Wide complex tachycardia — QRS ≥120 ms (often 140–200 ms)
- Rate 100–250 bpm, regular
- AV dissociation (P waves independent — definitive for VT)
- Fusion beats and capture beats (pathognomonic when present)
- Concordance in precordial leads (all positive = positive concordance; all negative = negative concordance) — strongly suggests VT
- Extreme axis deviation ("no-man's land" — NW axis)
Brugada criteria: If LBBB morphology, any of the above features = VT.
ECG Image — Monomorphic Ventricular Tachycardia
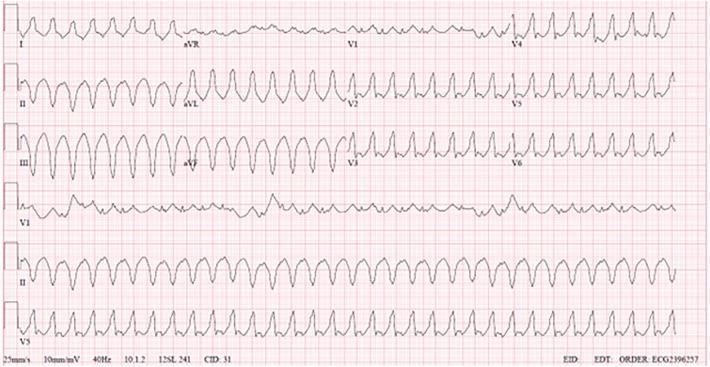
Monomorphic VT: high-amplitude wide QRS complexes at rapid rate with positive concordance across precordial leads and superior axis — ectopic ventricular origin, often associated with structural heart disease.
7. 🌊 Wolff-Parkinson-White (WPW) Syndrome
Pathophysiology
An accessory pathway (Bundle of Kent) bypasses the AV node, pre-exciting part of the ventricle before the normal conduction system. This creates a characteristic delta wave and shortens the PR interval.
ECG Changes (Classic Triad)
- Short PR interval (<120 ms) — conduction bypasses the AV node
- Delta wave — slurred, slow upstroke at the start of QRS
- Widened QRS (>120 ms total) — due to ventricular pre-excitation
- Secondary ST-T changes — discordant to delta wave
- Pseudo-infarction pattern — negative delta waves can mimic Q waves
Risk: During AF, impulses can conduct rapidly via the accessory pathway → very fast ventricular rates → ventricular fibrillation
ECG Image — WPW Syndrome
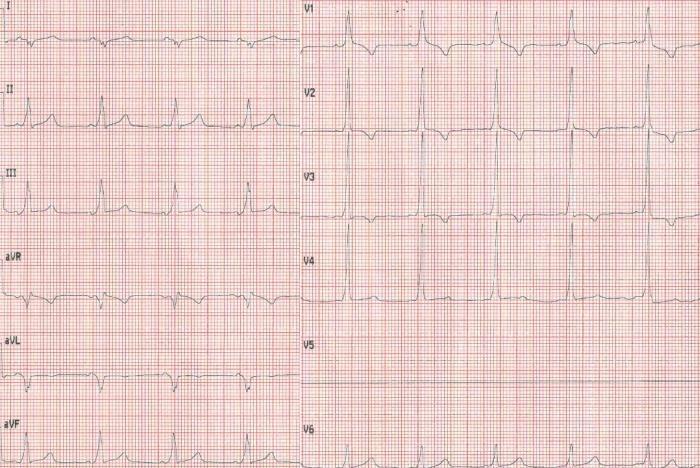
Classic WPW triad: shortened PR interval (<120 ms), visible delta wave (slurred QRS upstroke), and widened QRS — prominent in II, III, aVF and V2–V6.
8. 💪 Left Ventricular Hypertrophy (LVH)
Pathophysiology
Chronic pressure overload (hypertension, aortic stenosis) or volume overload causes concentric or eccentric hypertrophy of the LV. Increased muscle mass generates higher voltage and delayed repolarization.
ECG Changes
- High QRS voltage — Sokolow-Lyon criteria: S(V1) + R(V5 or V6) ≥35 mm; or Cornell criteria: R(aVL) + S(V3) >28 mm (men), >20 mm (women)
- "Strain pattern" — ST depression + asymmetric T-wave inversion in I, aVL, V5–V6 (lateral leads)
- Left axis deviation
- Prolonged QRS/intrinsicoid deflection
- Broad, notched P wave (P mitrale) — if associated left atrial enlargement
- QRS complexes may overlap between adjacent leads on paper (Seamens sign)
ECG Image — LVH with Strain Pattern
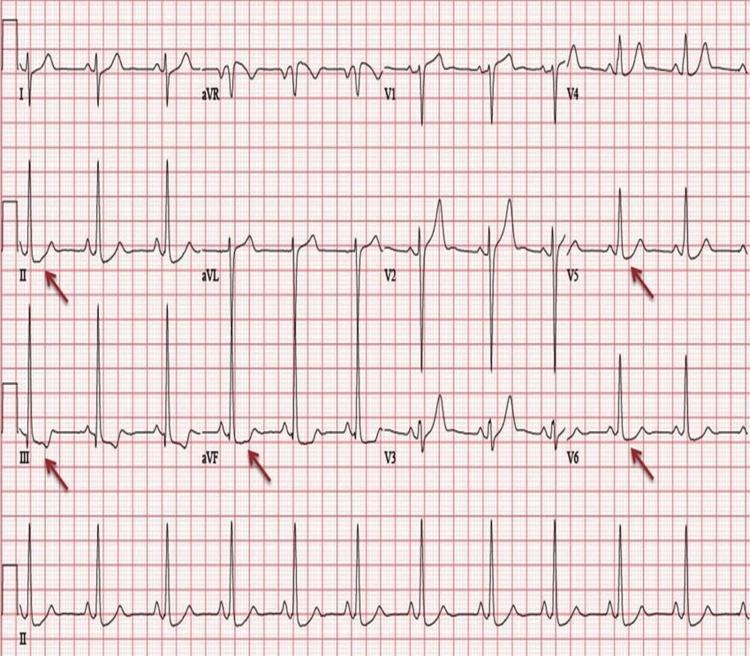
LVH with strain: tall R-waves in V5–V6 meeting Sokolow-Lyon criteria, with ST depression and asymmetric T-wave inversions in I, II, III, aVF, V5–V6 — typical of chronic hypertensive heart disease.
9. 🫁 Pulmonary Embolism (PE)
Pathophysiology
Massive PE causes acute right ventricular pressure overload (acute cor pulmonale). The RV dilates, shifts the interventricular septum, and creates characteristic but non-specific ECG changes.
ECG Changes
- Sinus tachycardia (most common finding, ~70% of cases)
- S1Q3T3 pattern — deep S in lead I, Q wave in III, inverted T in III (present in ~20%)
- Right bundle branch block (complete or incomplete)
- T-wave inversions in V1–V4 (right precordial leads) — right heart strain
- Right axis deviation
- P pulmonale (peaked P in II ≥2.5 mm) — right atrial enlargement
- New AF may occur
ECG Image — Pulmonary Embolism with S1Q3T3
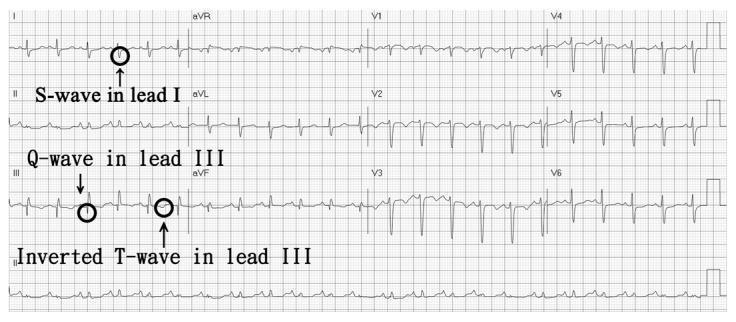
Classic acute PE pattern: annotated S1Q3T3 — prominent S wave in I, pathological Q wave in III, inverted T in III — with sinus tachycardia reflecting right ventricular strain.
10. ⏱️ Long QT Syndrome (LQTS) + Torsades de Pointes
Pathophysiology
Prolonged ventricular repolarization (congenital ion channel mutations or acquired: drugs, electrolyte disturbances) extends the QT interval, creating a vulnerable window for re-entrant arrhythmias — specifically the polymorphic VT called Torsades de Pointes (TdP).
ECG Changes
- Prolonged QTc — corrected QT interval: >440 ms (men), >460 ms (women); dangerous at >500 ms
- Abnormal T-wave morphology — broad, notched, bifid, or biphasic T-waves
- T-wave alternans — beat-to-beat variation in T-wave amplitude/polarity (high-risk marker)
- Torsades de Pointes — polymorphic VT with characteristic twisting of QRS complexes around the isoelectric line, triggered by a short-long-short sequence or R-on-T phenomenon
- Bradycardia — often present in congenital forms (LQTS types 1 and 2)
QTc Correction (Bazett): QTc = QT / √RR (in seconds)
ECG Image — Long QT Syndrome with Torsades de Pointes
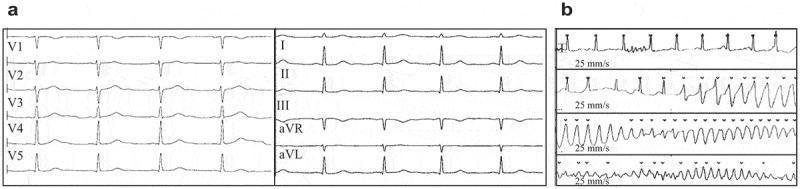
Panel (a) shows baseline sinus rhythm with prolonged QTc (478 ms). Panel (b) shows the transition into Torsades de Pointes — polymorphic VT with the characteristic "twisting" of QRS complexes around the isoelectric baseline.
Quick Reference Summary Table
| # | Disease | Key ECG Feature | Rate/Rhythm |
|---|---|---|---|
| 1 | Anterior STEMI | Convex ST elevation V1–V4 + reciprocal changes | Sinus |
| 2 | Inferior STEMI | ST elevation II, III, aVF + ST depression I, aVL | Sinus |
| 3 | Acute Pericarditis | Diffuse concave ST elevation + PR depression | Sinus (tachy) |
| 4 | Atrial Fibrillation | No P waves, fine f-waves, irregularly irregular | Irregular |
| 5 | Complete AV Block | AV dissociation, P-rate > QRS-rate | Bradycardia |
| 6 | Ventricular Tachycardia | Wide QRS ≥120 ms, AV dissociation | 100–250 bpm |
| 7 | WPW Syndrome | Short PR, delta wave, widened QRS | Sinus |
| 8 | LVH | High voltage, lateral strain pattern | Sinus |
| 9 | Pulmonary Embolism | Sinus tachy, S1Q3T3, right precordial TWI | Sinus (tachy) |
| 10 | Long QT / Torsades | Prolonged QTc >500 ms, twisting polymorphic VT | Variable |
Clinical Note: ECG interpretation must always be correlated with clinical presentation, symptoms, and other investigations. These ECG patterns are teaching examples — real-world tracings may show incomplete or atypical features.Here's a complete breakdown of 10 common heart diseases with their ECG changes and real ECG images:
What's Covered:
| # | Disease | Hallmark ECG Finding |
|---|---|---|
| 1 | Anterior STEMI | Convex ST elevation V1–V4, reciprocal depression, tombstone morphology |
| 2 | Inferior STEMI | ST elevation II, III, aVF; reciprocal changes in I, aVL |
| 3 | Acute Pericarditis | Diffuse concave (saddle-shaped) ST elevation + PR depression (differentiates from STEMI) |
| 4 | Atrial Fibrillation | No P waves → fine fibrillatory baseline, irregularly irregular R-R intervals |
| 5 | Complete AV Block | P waves and QRS march independently (AV dissociation), slow ventricular escape |
| 6 | Ventricular Tachycardia | Wide QRS ≥120 ms, AV dissociation, concordance in precordial leads |
| 7 | WPW Syndrome | Short PR + delta wave + widened QRS — the classic triad |
| 8 | LVH | High voltage (Sokolow-Lyon ≥35 mm) + lateral strain pattern (ST depression + T inversion) |
| 9 | Pulmonary Embolism | Sinus tachycardia + S1Q3T3 + right precordial T-wave inversions |
| 10 | Long QT / Torsades | QTc >500 ms + polymorphic VT with twisting QRS morphology |
Each section includes the underlying mechanism, specific lead-by-lead ECG changes, a summary table, and an annotated real ECG image sourced from peer-reviewed medical literature. Let me know if you'd like a deeper dive into any specific condition, treatment implications, or ACLS algorithms!
This is a shared conversation. Sign in to Orris to start your own chat.