
Pleural effusion
COPD
pleural effusion chest X-ray diagram
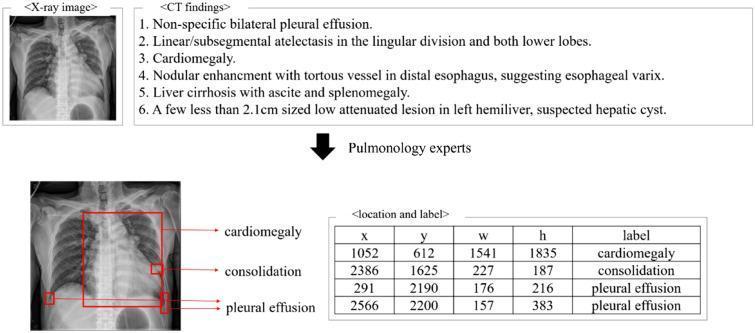
This infographic illustrates a data preprocessing workflow for medical imaging, specifically focusing on the annotation of chest X-rays (CXRs) using chest CT findings as a reference. The top of the diagram displays an initial X-ray image paired with a detailed list of CT findings, including pleural effusion, atelectasis, cardiomegaly, esophageal varix, liver cirrhosis, and hepatic cysts. A downward arrow points to the 'Pulmonology experts' stage, which transitions to the annotated output. The bottom section shows an annotated posterior-anterior (PA) chest X-ray with red bounding boxes identifying specific pathologies: cardiomegaly (central chest), consolidation (left lower lung zone), and bilateral pleural effusion (costophrenic angles). Accompanying the annotated image is a structured data table titled 'location and label,' which quantifies each bounding box using five attributes: x-coordinate, y-coordinate, width (w), height (h), and the diagnostic lesion class. This illustrates a ground-truth labeling process necessary for training machine learning models in thoracic radiology.
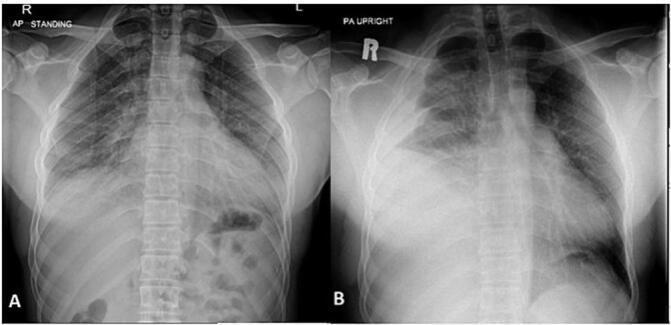
This diagnostic comparison contains two frontal chest X-rays (A and B) illustrating the development of a large pleural effusion. X-ray A, taken on initial admission, shows a relatively normal chest with clear lung fields, sharp costophrenic angles, and a centrally positioned mediastinum. X-ray B, a subsequent study, demonstrates a significant dense opacity in the right lower and middle zones of the hemithorax. This opacity exhibits a classic meniscus sign, curving upward along the lateral chest wall, which is highly characteristic of a large pleural effusion (later confirmed as a hemothorax). The right hemidiaphragm and costophrenic angle are completely obscured by the fluid. There is a subtle mass effect resulting in a slight shift of the mediastinal structures towards the left. The left lung remains clear. These images are used in medical education to demonstrate the radiographic progression of pleural pathology and the visual criteria for identifying fluid accumulation in the pleural space.
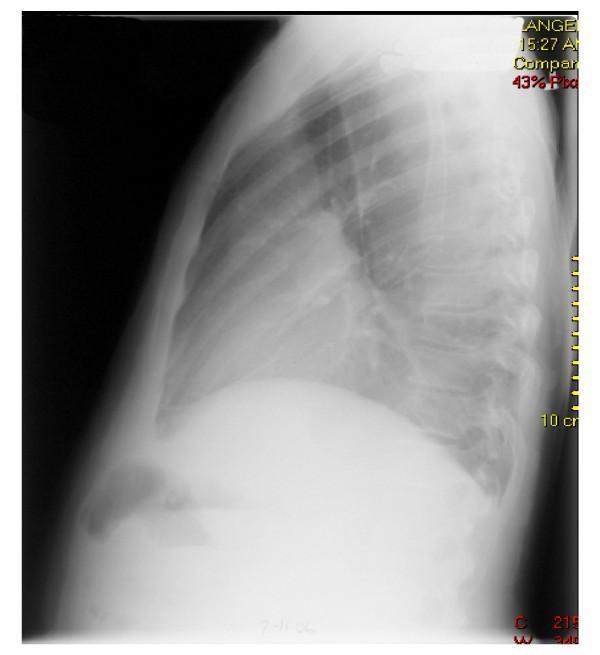
A lateral chest X-ray illustrating a massive re-accumulated pleural effusion in the left hemithorax. The image shows a large, dense area of radiopacity in the lower and middle portions of the chest, which characteristic of a significant fluid collection. This density obscures the left hemidiaphragm, the left costophrenic angle, and the posterior cardiac border. The extensive effusion results in a marked loss of lung volume on the affected side, with visible compression of the lung parenchyma. The right hemidiaphragm and right lung field appear relatively clear by comparison, though the cardiac silhouette is partially silhouette-masked by the adjacent fluid. This diagnostic image demonstrates the hallmark radiological features of massive pleural fluid accumulation, including loss of typical anatomical interfaces and increased thoracic density, serving as a primary example for pulmonary and critical care medicine education regarding pleural space pathology.
COPD chronic obstructive pulmonary disease lung pathology diagram
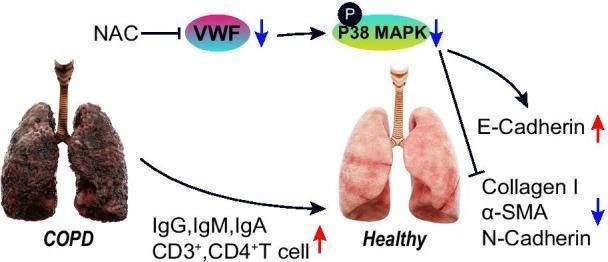
A pathophysiology diagram illustrating the molecular mechanism by which N-acetylcysteine (NAC) improves Chronic Obstructive Pulmonary Disease (COPD)-induced pulmonary fibrosis. The visual contrasts a pathological COPD lung—exhibiting a dark, shriveled, and fibrotic appearance—with a smooth, pink, and healthy-appearing lung. The central mechanism shows NAC inhibiting the expression of Von Willebrand Factor (VWF), which leads to a downstream reduction in p38 mitogen-activated protein kinase (MAPK) phosphorylation. This inhibitory pathway results in an upregulated immune response, characterized by increased levels of IgG, IgM, IgA, and CD3+/CD4+ T cells. Simultaneously, the suppression of the VWF/p38 MAPK axis promotes E-Cadherin expression while inhibiting markers of epithelial-mesenchymal transition (EMT) and fibrosis, specifically decreasing Collagen I, alpha-smooth muscle actin (α-SMA), and N-Cadherin. The diagram provides a comprehensive overview of how antioxidant therapy may modulate the VWF/p38 MAPK/EMT axis to restore pulmonary function and immune homeostasis in chronic respiratory pathology.
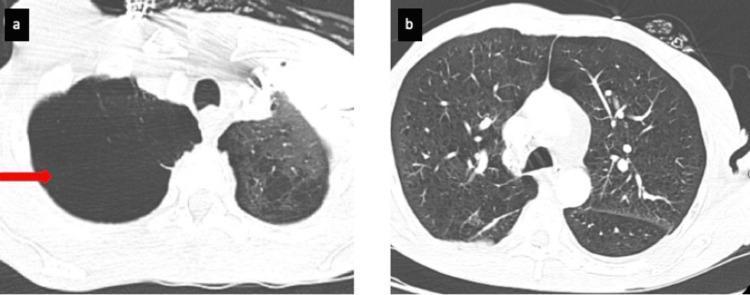
Two axial CT pulmonary angiography (CTPA) slices displayed in a lung window, illustrating chronic obstructive pulmonary disease (COPD) pathology. Image (a) shows a large, well-circumscribed, air-filled bulla in the right apical region, indicated by a red arrow. This bulla causes focal compression of the adjacent lung tissue and significant rarefaction of the vascular markings. Image (b) shows a lower thoracic section demonstrating diffuse, bilateral emphysematous changes. The lung parenchyma exhibits increased lucency, multiple small air-filled lucent spaces, and a reduction in the density and caliber of peripheral pulmonary vessels, creating a 'spongy' texture. These findings are characteristic of extensive centrilobular and paraseptal emphysema. The images provide clinical evidence of severe parenchymal destruction, contributing to decreased gas exchange and potential secondary pulmonary hypertension.
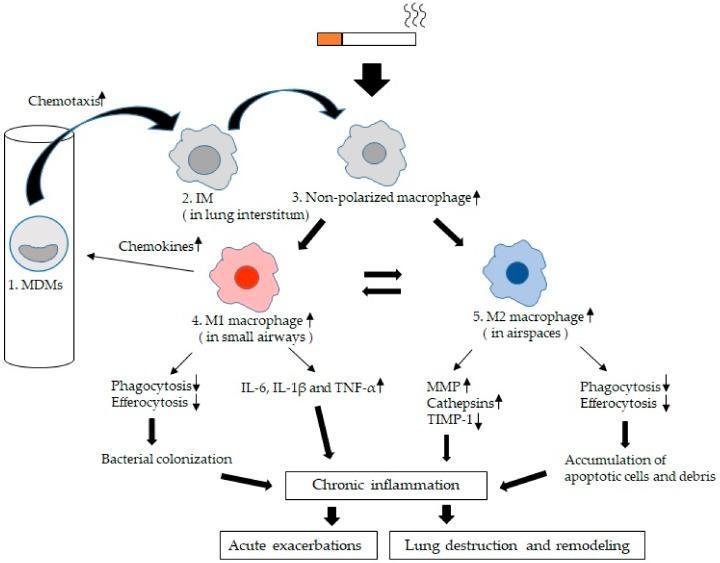
A pathophysiology diagram illustrating the kinetics and phenotypic polarization of lung macrophages (LMs) in Chronic Obstructive Pulmonary Disease (COPD). The diagram follows a progression starting from blood monocyte-derived macrophages (MDMs) that undergo chemotaxis into the lung interstitium to become Interstitial Macrophages (IMs). These transition into non-polarized macrophages within small airways and airspaces. Driven by the microenvironment—influenced by cigarette smoke—macrophages polarize into two main phenotypes: 1) M1 macrophages (classically activated), primarily in small airways, which show increased secretion of pro-inflammatory cytokines (IL-6, IL-1̢̣, TNF-̢̣) and impaired phagocytosis/efferocytosis, leading to bacterial colonization. 2) M2 macrophages (alternatively activated), primarily in airspaces, characterized by increased MMPs and cathepsins with decreased TIMP-1, contributing to the accumulation of apoptotic cells and debris. Both pathways converge on chronic inflammation, which subsequently drives acute exacerbations and structural lung destruction/remodeling. This educational infographic visualizes the immune mechanisms underlying COPD progression and the functional impairment of cellular defense in the lung.
pleural effusion diagnosis management
COPD management treatment guidelines
Pleural Effusion
Definition & Pathophysiology
Classification: Transudates vs. Exudates
- Transudates arise from an imbalance between hydrostatic and oncotic pressures (low-protein ultrafiltrate)
- Exudates result from pleural inflammation or neoplasia causing active fluid secretion or leakage (high-protein content)
Light's Criteria (1972 - gold standard)
| Criterion | Threshold |
|---|---|
| Pleural fluid (PF) / serum protein ratio | > 0.5 |
| PF / serum LDH ratio | > 0.6 |
| PF LDH | > 2/3 the upper limit of normal serum LDH |
Common Causes
| Type | Common | Less Common |
|---|---|---|
| Transudate | Heart failure, cirrhosis with ascites | Nephrotic syndrome, peritoneal dialysis |
| Exudate | Cancer (primary/metastatic), bacterial pneumonia (parapneumonic), pulmonary embolism | Tuberculosis, SLE, rheumatoid arthritis, uremia, pancreatitis, drug-related (amiodarone) |
Clinical Features
- Small effusions may be asymptomatic
- Larger effusions cause dyspnea, pleuritic chest pain, and cough
- Physical examination: dullness to percussion and decreased/absent breath sounds at the lung base
- Very large effusions may cause mediastinal shift and hemodynamic compromise (mimicking tamponade physiology)
Radiology
- Subpulmonary effusion: Presents as an apparently "high hemidiaphragm" with an unusual peak more lateral than usual - confirmed by US or CT
- Loculated effusion: Fluid trapped between pleural adhesions, often against the chest wall or in fissures
- Supine CXR: Fluid is barely visible as a hazy opacity in the lower hemithorax; costophrenic angles may not be blunted
Pleural Fluid Analysis (Key Tests)
| Test | Result | Suggested Condition |
|---|---|---|
| pH | < 7.2 | Empyema, malignancy, esophageal rupture |
| Glucose | Very low (<60 mg/dL) | Empyema, RA, malignancy |
| LDH | Very high | Empyema, malignancy |
| Amylase | Elevated | Pancreatitis, esophageal rupture |
| Triglycerides | >110 mg/dL | Chylothorax |
| Cytology | Malignant cells | Malignant effusion |
| ADA | Elevated | Tuberculosis |
Special Effusions
-
Hepatic hydrothorax: Affects ~5-10% of cirrhotics. Ascitic fluid passes through small diaphragmatic defects into the pleural space. 85% are right-sided. Nearly all are transudates. Management: sodium restriction + diuretics; refractory cases - TIPS (70-80% initial response rate) or indwelling pleural catheter (IPC) as bridge to transplant. - Murray & Nadel's Respiratory Medicine
-
Tuberculous pleuritis: White cell count 500-2500/mL (lymphocyte-predominant exudate), protein >50% of serum protein. AFB smear rarely positive (~25-30% culture yield). Elevated ADA is diagnostically helpful. Without treatment, 65% relapse with active TB within 5 years. - Rosen's Emergency Medicine
-
Empyema: Frank pus in the pleural space. Requires tube drainage ± intrapleural fibrinolytics (or surgical VATS if fibrinolytics fail).
Management
- Treat the underlying cause (especially for transudates - diuresis for heart failure)
- Therapeutic thoracentesis: For symptomatic relief of dyspnea; remove up to 1.5 L at once to avoid re-expansion pulmonary edema
- Chest tube drainage: For empyema, large or rapidly accumulating effusions
- Intrapleural fibrinolytics (e.g., tPA + DNase): For complicated parapneumonic effusions/empyema
- Pleurodesis (talc, doxycycline): For recurrent malignant effusions to obliterate the pleural space
- Indwelling pleural catheter (IPC): For recurrent malignant or hepatic hydrothorax - allows outpatient drainage
- VATS pleuroscopy: For undiagnosed exudative effusions (biopsy) or complex empyema; diagnostic yield equivalent to medical thoracoscopy but higher cost
COPD (Chronic Obstructive Pulmonary Disease)
Definition
Epidemiology & Risk Factors
- Third most common cause of death in the United States
- Accounts for >$40 billion/year in direct and indirect healthcare costs
- Cigarette smoking is the primary risk factor (develops in 15-30% of habitual smokers by traditional estimates, though CT studies show progressive changes even in smokers with normal spirometry)
- Other risk factors: occupational dust/fumes, air pollution, alpha-1-antitrypsin (A1AT) deficiency, recurrent childhood respiratory infections
Pathological Components
1. Emphysema
- Enlargement of air spaces distal to terminal bronchioles due to destruction of elastic tissue
- Caused by proteases (especially elastase) released from inflammatory cells (neutrophils, macrophages) overwhelming antiprotease defenses
- Centriacinar (centrilobular): Most common type; smoking-related; affects upper lobes primarily
- Panacinar: Seen in alpha-1-antitrypsin deficiency; affects all lung zones, worse at bases
- Results in: increased lung compliance, air trapping, barrel chest, hyperinflation
2. Chronic Bronchitis
- Defined as productive cough for ≥3 consecutive months in ≥2 consecutive years (clinical definition)
- Mucus overproduction from hyperplasia of tracheal/large airway mucous glands (Reid index increased) + goblet cell metaplasia
- Airway obstruction from small airway disease (chronic bronchiolitis) + inflammation + bronchiolar fibrosis
- Mucus hyperconcentration with MUC5AC increased 10-fold and MUC5B 3-fold in severe COPD
- Results in: hypoxemia, hypercapnia, recurrent infections (especially H. influenzae)
- Fishman's Pulmonary Diseases
Pathophysiology
| Feature | Emphysema | Chronic Bronchitis |
|---|---|---|
| Blood gases | Near-normal PaO2 at rest ("pink puffer") | Hypoxemia + hypercapnia ("blue bloater") |
| Compliance | Increased | Normal or decreased |
| Airflow obstruction | Elastic recoil loss | Mucus + inflammation |
| Cyanosis | Less common | Common |
Diagnosis
Spirometry (GOLD standard)
- Post-bronchodilator FEV1/FVC < 0.70 confirms obstructive airflow limitation (GOLD criterion)
- ATS/ERS uses lower limit of normal (5th percentile) to avoid over-diagnosis in elderly
- Flow-volume loop shows concave (scooped-out) pattern with reduced flow at all lung volumes
- Volume-time curve shows prolonged expiratory time
GOLD Staging (by FEV1 % predicted, post-bronchodilator)
| Grade | Severity | FEV1 % predicted |
|---|---|---|
| GOLD 1 | Mild | ≥ 80% |
| GOLD 2 | Moderate | 50-79% |
| GOLD 3 | Severe | 30-49% |
| GOLD 4 | Very Severe | < 30% |
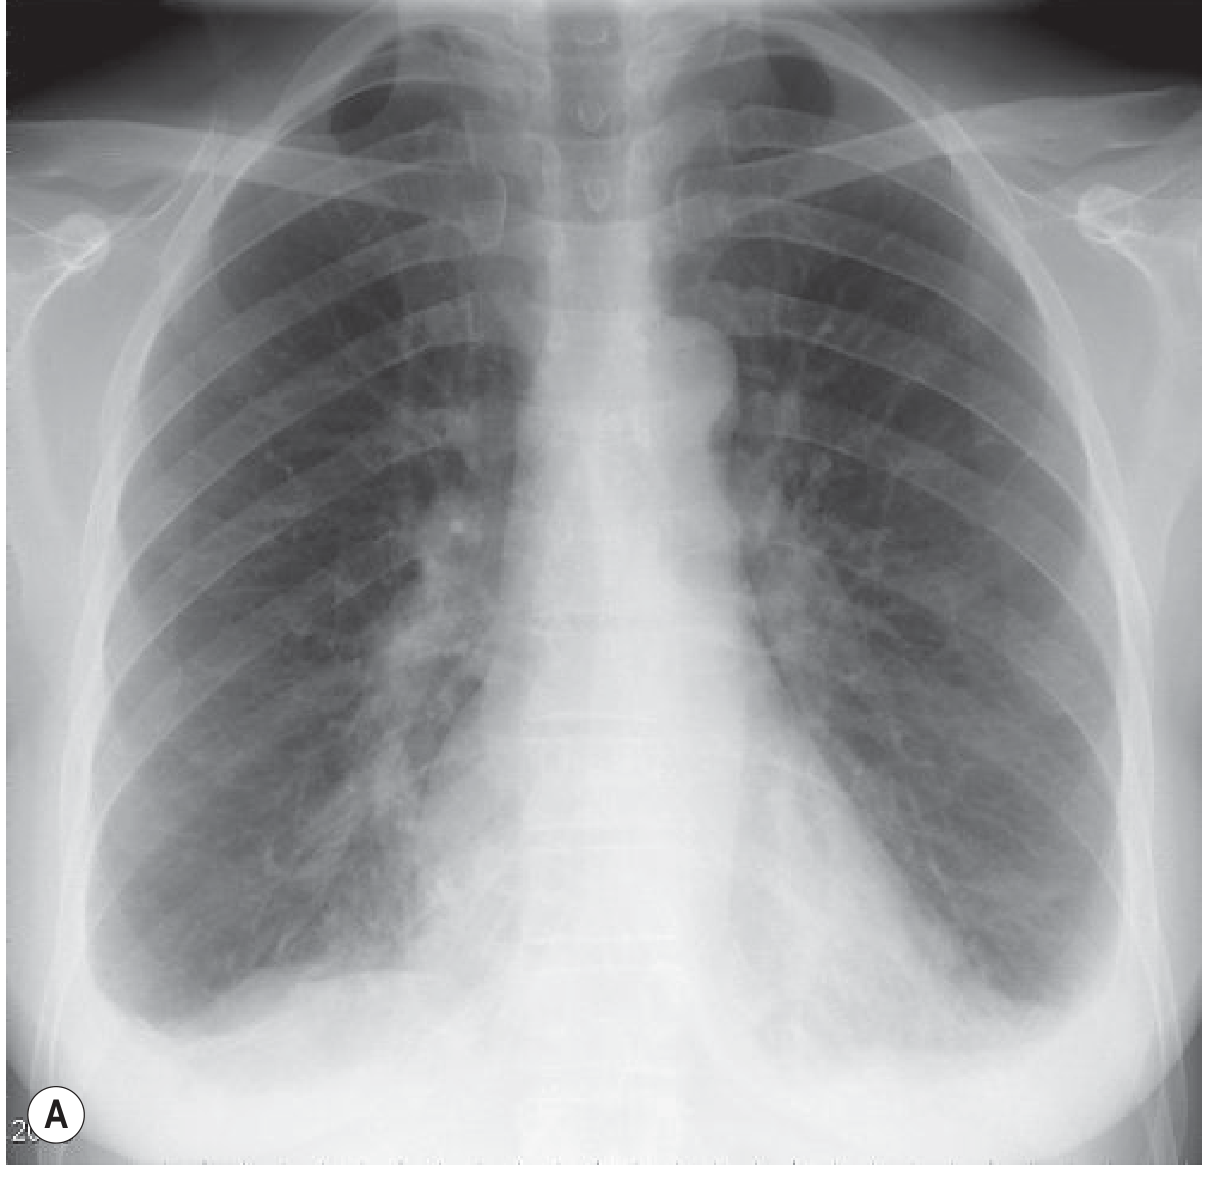
COPD CXR / CT findings
Management
Stable COPD - Stepwise Approach
- Smoking cessation - single most effective intervention
- Pulmonary rehabilitation
- Vaccinations (influenza, pneumococcal, COVID-19)
- Long-term oxygen therapy (LTOT) if PaO2 ≤55 mmHg or SaO2 ≤88%
| Indication | Drug class | Examples |
|---|---|---|
| Acute symptom relief | SABA | Albuterol (salbutamol) |
| Acute anticholinergic | SAMA | Ipratropium bromide |
| SABA + SAMA combined | Salbutamol + ipratropium | |
| Persistent exertional dyspnea (GOLD B/E) | LABA or LAMA | Salmeterol, formoterol / Tiotropium, umeclidinium |
| More severe / frequent exacerbations | LABA + LAMA | Combination inhalers |
| High eosinophils + frequent exacerbations | Add ICS | Fluticasone, budesonide |
| Severe airflow limitation + chronic bronchitis | PDE4 inhibitor | Roflumilast (reduces exacerbations + improves FEV1) |
| Antibiotic prophylaxis (frequent exacerbators) | Macrolide | Azithromycin |
Acute Exacerbations of COPD (AECOPD)
- Short-acting bronchodilators (SABA ± SAMA) - first-line
- Systemic corticosteroids (e.g., prednisone 40 mg × 5 days) - reduce recovery time and treatment failure
- Antibiotics (beta-lactams, macrolides, fluoroquinolones) - routinely given in AECOPD (unlike asthma exacerbations)
- Controlled oxygen - target SaO2 88-92% to avoid hypercapnic respiratory failure
- NIV (non-invasive ventilation) - for hypercapnic respiratory failure (pH <7.35, PaCO2 >45 mmHg)
- Invasive mechanical ventilation - if NIV fails or contraindicated
Note: Theophylline - once widely used - failed to show benefit on exacerbation frequency in a recent large placebo-controlled RCT and is no longer recommended routinely. - Katzung's Pharmacology
Summary Comparison
| Feature | Pleural Effusion | COPD |
|---|---|---|
| Primary pathology | Fluid accumulation in pleural space | Permanent airflow obstruction (emphysema/bronchitis) |
| Key investigation | Thoracentesis + Light's criteria | Post-bronchodilator spirometry (FEV1/FVC < 0.70) |
| Imaging | CXR: blunted costophrenic angle; US/CT confirmatory | CXR: hyperinflation, flat diaphragm; CT: emphysema, bullae |
| Key classification | Transudate vs. Exudate | GOLD Grade 1-4 + ABE assessment |
| Definitive treatment | Treat cause; drain if symptomatic | Smoking cessation; stepwise bronchodilator therapy |