
Define the terms EPIDEMIC, ENDEMIC, PANDEMIC & SPORADIC. Outline steps involved in investigation of an EPIDEMIC.-spm from park textbook
Reading File
Now let me search the Park's textbook for epidemic investigation and the definitions.
Finding Sources
Finding Sources
Finding Sources
Reading File
Good, I have the investigation section. Now let me read the steps of investigation and also find the definitions of epidemic, endemic, pandemic, sporadic.
Reading File
Finding Sources
Reading File
Finding Sources
Let me find the definitions (epidemic, endemic, pandemic, sporadic) section in Park's textbook, and also read more of the investigation steps.
Finding Sources
Reading File
Now let me read the EPIDEMIC definition section and the remaining investigation steps.
Reading File
Reading File
I now have all the necessary content from Park's textbook. Let me compile the complete answer.
Definitions & Epidemic Investigation - Park's Textbook of Preventive and Social Medicine
PART I: DEFINITIONS
1. EPIDEMIC
(From Greek: Epi = upon; demos = people)
The occurrence in a community or region of cases of an illness, specific health-related behaviour, or other health-related events clearly in excess of normal expectancy. The community/region and the period in which cases occur must be specified precisely.
- The number of cases indicating an epidemic varies with the agent, size and type of population exposed, previous exposure history, and time and place of occurrence.
- Epidemicity is relative - it is judged against the usual frequency of the same disease in the same area, among the same population, at the same season.
- Even a single case of a disease long absent from a population, or a first invasion by a previously unrecognized disease, requires immediate reporting and full field investigation.
- Two cases of such a disease associated in time and place may be sufficient to constitute an epidemic.
2. ENDEMIC
(From Greek: En = in; demos = people)
The constant presence of a disease or infectious agent within a given geographic area or population group, without importation from outside. It may also refer to the "usual" or expected frequency of the disease within that area or population group.
- Example: Common cold is endemic because somebody always has one.
- Hyperendemic: Disease constantly present at a high incidence/prevalence and affects all age groups equally.
- Holoendemic: High level of infection beginning early in life, affecting most of the child population, leading to equilibrium where adults show less disease than children (e.g., malaria).
- An endemic disease, when conditions are favourable, may burst into an epidemic (e.g., hepatitis A, typhoid fever).
3. SPORADIC
The word sporadic means scattered about. Cases occur irregularly, haphazardly from time to time, and generally infrequently.
- The cases are so few and separated widely in space and time that they show little or no connection with each other, nor a recognizable common source of infection.
- Examples: Tetanus, herpes zoster, meningococcal meningitis.
- A sporadic disease may become the starting point of an epidemic when conditions become favourable for spread.
- Many zoonotic diseases are characterized by sporadic transmission to humans.
4. PANDEMIC
An epidemic occurring over a very wide area, crossing international boundaries, and usually affecting a large number of people.
- Only some pandemics cause severe disease in individuals or at a population level.
- Characteristics of an infectious agent for pandemic causation:
- The agent must be able to infect humans
- The agent must be able to cause disease in humans
- The agent must be able to spread easily from human to human
- Examples: Influenza pandemics, cholera pandemics, COVID-19 pandemic.
PART II: INVESTIGATION OF AN EPIDEMIC
(Park's Textbook - Steps in Epidemic Investigation)
The occurrence of an epidemic signals a significant shift in the balance between agent, host, and environment. The objectives of epidemic investigation are to:
- (a) Define the magnitude in terms of time, place, and person
- (b) Determine the conditions and factors responsible for occurrence
- (c) Identify the cause, source(s) of infection, and modes of transmission
- (d) Make recommendations to prevent recurrence
Note: Some steps can be done concurrently. The approach is applicable to almost any epidemic.
STEPS IN INVESTIGATION OF AN EPIDEMIC
Step 1: Verification of Diagnosis
- First and most important step.
- Reports may sometimes be spurious, arising from misinterpretation of signs and symptoms by the lay public.
- Verification must be done on the spot, as quickly as possible.
- Not necessary to examine ALL cases - a representative sample may suffice.
- Laboratory investigations are useful to confirm the diagnosis, but epidemiological investigations should not be delayed awaiting lab results.
Step 2: Confirmation of the Existence of an Epidemic
- Compare disease frequency during the same period of previous years (baseline data).
- An epidemic exists when observed frequency is in excess of expected frequency for that population based on past experience.
- An arbitrary limit of two standard errors from the endemic occurrence is used to define the epidemic threshold (e.g., influenza).
- Some epidemics are obvious (e.g., cholera, food poisoning, hepatitis A - common-source epidemics).
- Modern epidemics (cancer, cardiovascular disease) are less easily recognized without comparison.
Step 3: Defining the Population at Risk
- (a) Obtaining a map of the area: Prepare a detailed, current map with natural landmarks, roads, and location of all dwelling units; divide into segments and smaller sections with numbered dwelling units.
- (b) Counting the population: Conduct a complete census by age and sex via house-to-house visits, using lay health workers. This helps compute attack rates in various groups. Without an appropriate denominator ("population at risk"), attack rates cannot be calculated.
Step 4: Rapid Search for All Cases and Their Characteristics
- (a) Medical survey: Identify all cases including those who have not sought medical care, and those possibly exposed to risk. Complete screening picks up all affected individuals.
- (b) Epidemiological case sheet: Design a case interview form to collect: name, age, sex, occupation, social class, travel history, time of onset, signs and symptoms, contacts at home/work/school, special events (parties, foods eaten), exposure to common vehicles (water, food, milk), history of injections or blood products, etc.
- (c) Searching for more cases: Ask patients about other cases in home, family, neighbourhood, school, workplace. Search for secondary cases every day until the area is declared free of epidemic (usually taken as twice the incubation period since the last case).
Step 5: Data Analysis
Analyze data on an ongoing basis using the classical epidemiological parameters - Time, Place, and Person (or Agent-Host-Environment model):
- Time: Prepare a chronological distribution of onset dates and construct an "epidemic curve." Look for time clustering; the curve can indicate (a) time relationship with exposure to a suspected source, (b) whether common-source or propagated epidemic, (c) seasonal or cyclic pattern.
- Place: Prepare a "spot map" (geographic distribution) of cases and relate to possible sources (water supply, air pollution, occupation, etc.). Clustering indicates a common source.
- Person: Analyze by age, sex, occupation, and other risk factors. Determine attack rates/case fatality rates for those exposed vs. not exposed. In food-borne outbreaks, food-specific attack rates must be calculated for each food item eaten.
Step 6: Formulation of Hypotheses
- Based on time, place and person analysis, formulate hypotheses explaining the epidemic in terms of:
- (a) Possible source
- (b) Causative agent
- (c) Possible modes of spread
- (d) Environmental factors which enabled it to occur
- Place hypotheses in order of relative likelihood to guide further investigation.
Step 7: Testing of Hypotheses
- All reasonable hypotheses must be considered and weighed by comparing attack rates in various groups for those exposed vs. not exposed to each suspected factor.
- This determines which hypothesis is consistent with all known facts.
- The hypothesis is tested by the subsequent course of events.
Step 8: Evaluation of Ecological Factors
- Investigate circumstances to prevent further transmission.
- Examine ecological factors: sanitary status of eating establishments, water and milk supply, breakdown in water supply system, population movements, atmospheric changes (temperature, humidity, air pollution), population dynamics of insects and animal reservoirs.
- The outbreak can be studied in a case-control fashion.
- Primary concern: relating the disease to environmental factors to know source(s) of infection, reservoirs, and modes of transmission.
Step 9: Further Investigation of Population at Risk
- Additional information may be obtained by: medical examination, screening tests, examination of suspected food/faeces/blood samples, biochemical studies, assessment of immunity status.
- Approach may be retrospective or prospective.
- Serological studies may reveal clinically inapparent cases and illuminate pathogenesis.
- Classify all members as to (a) exposure to specific potential vehicles and (b) whether ill or not.
Step 10: Writing the Report
- The report should be complete and convincing.
- Contents of the final report include: background (geographic location, demographics, socioeconomic situation, health services), description of the epidemic, analytical data, conclusions, and recommendations to prevent recurrence.
Source: Park's Textbook of Preventive and Social Medicine (Park's PSM)
Quick Summary Table
| Term | Meaning | Example |
|---|---|---|
| Epidemic | Cases clearly in excess of normal expectancy in a defined area/time | Cholera outbreak in a city |
| Endemic | Constant presence of disease in a geographic area at expected/usual level | Malaria in sub-Saharan Africa |
| Sporadic | Cases scattered irregularly in time and space, no recognizable source | Tetanus, herpes zoster |
| Pandemic | Epidemic crossing international boundaries, affecting large numbers worldwide | Influenza, COVID-19, cholera |
Search for case studies of real epidemic investigations from Park's textbook
Searching sources...
Finding Sources
Finding Sources
Finding Sources
Finding Sources
Finding Sources
Reading File
Finding Sources
Reading File
Reading File
Reading File
Finding Sources
Finding Sources
Finding Sources
Reading File
Now I have excellent material. Let me also fetch the famous John Snow spot map image and the epidemic curve image from the textbook.
Loading Image
Loading Image
Excellent! I have all the real case studies from Park's textbook, along with the original images. Here is the full compiled answer:
Real Epidemic Investigation Case Studies from Park's Textbook
Park's Textbook of Preventive and Social Medicine
CASE STUDY 1: John Snow and the Broad Street Pump - London Cholera Epidemic (1854)
THE most celebrated epidemic investigation in history - the foundation of field epidemiology.
Background
Cholera repeatedly ravaged London during the 19th century. In 1854, a devastating outbreak occurred in the Golden Square district of Soho, London. John Snow, an English physician, undertook a systematic epidemiological investigation - before the causative organism (Vibrio cholerae) had even been identified.
Method: The Spot Map
Snow plotted all fatal cholera cases on a street map of the Golden Square district. This "spot map" visually revealed a striking geographic clustering of deaths - all heavily concentrated around a single location: the water pump on Broad Street.
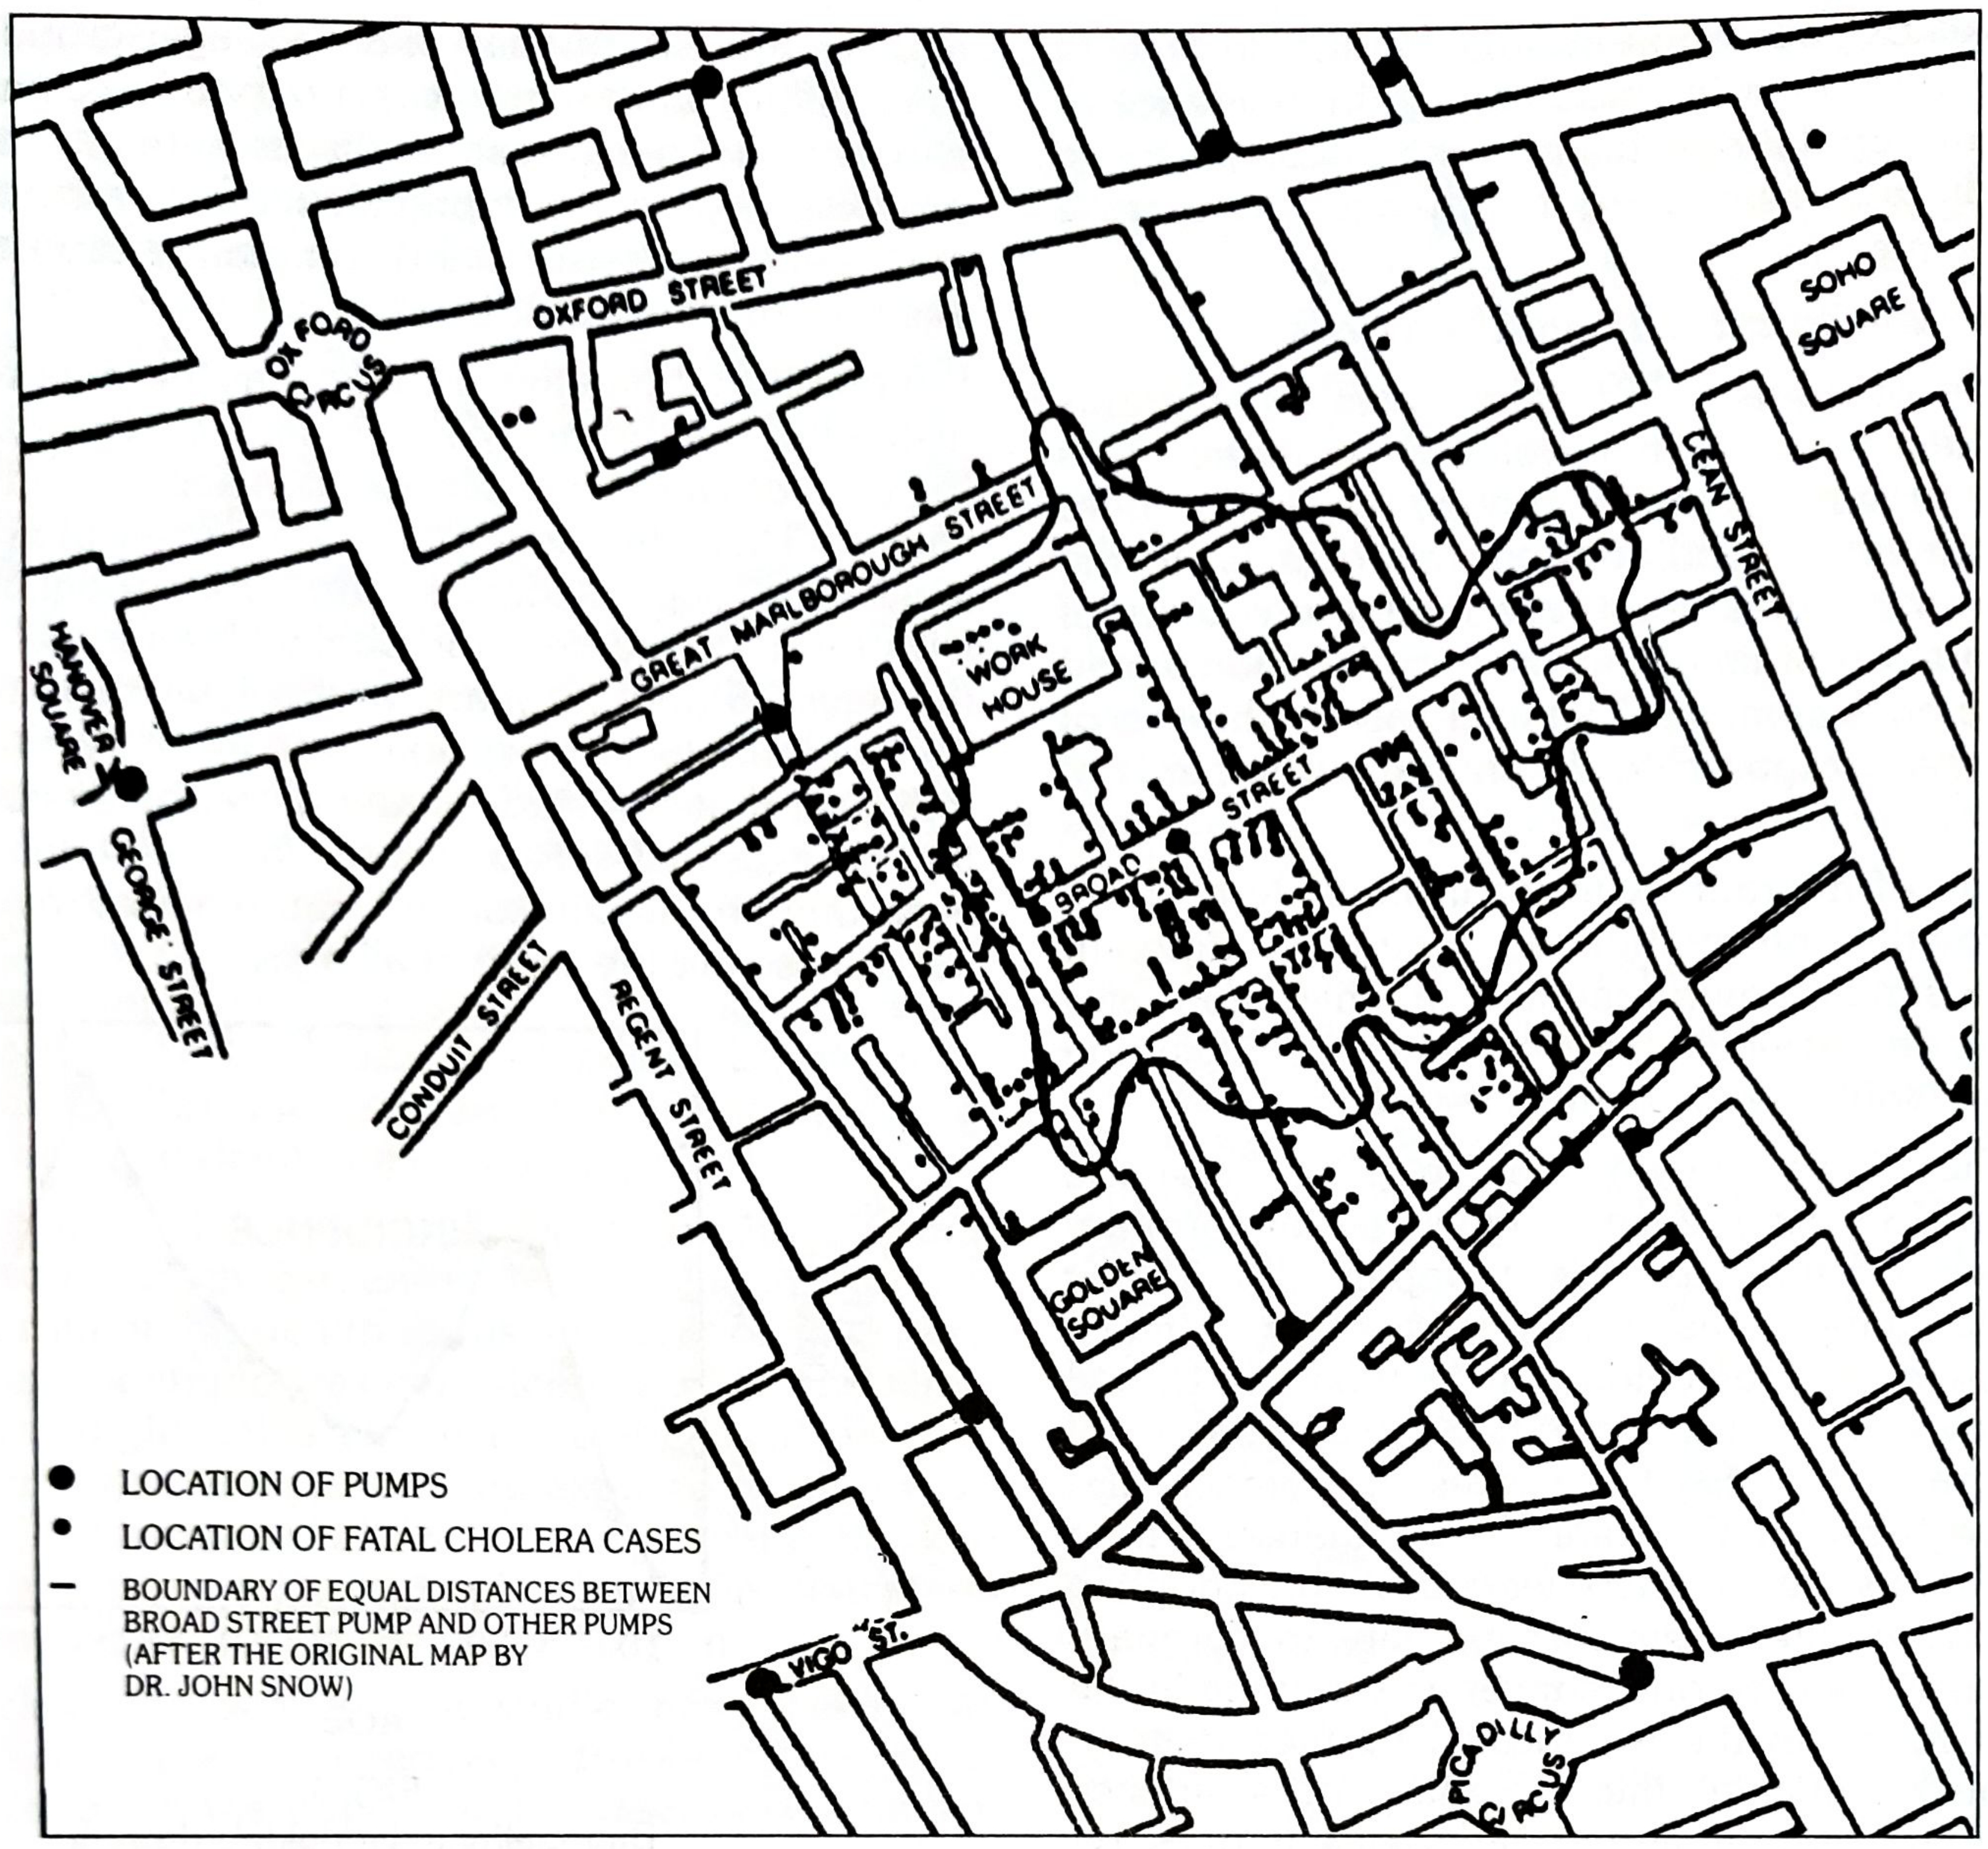
FIG. 6 - Spot map of Asiatic Cholera in London (after the original map by Dr. John Snow). Filled circles = location of pumps; dots = location of fatal cholera cases; boundary = equal distances between Broad Street pump and other pumps.
Key Epidemiological Findings
- Cases clustered tightly around the Broad Street pump
- The boundary lines of equal distance between the Broad Street pump and neighboring pumps coincided almost perfectly with the distribution of cases
- The Workhouse nearby (which had its own water supply) had very few cases despite being in the middle of the epidemic zone
- People who worked or lived near the Broad Street pump but obtained water from elsewhere were spared
Outcome
Based purely on descriptive epidemiology (time, place, person), Snow hypothesized that cholera was a water-borne disease and that the Broad Street pump was the source. He convinced local authorities to remove the handle of the Broad Street pump - the epidemic subsided shortly after.
Park's comment: "It was by such a study (spot map of fatal cases), John Snow was able to focus attention on the common water pump in Broad Street as the source of infection... Snow was able to hypothesize that cholera was a water-borne disease, long before the birth of bacteriology."
Type of epidemic: Common-source, continuous/repeated exposure epidemic (contaminated water supply).
CASE STUDY 2: Legionnaire's Disease - Philadelphia, USA (1976)
Background
In the summer of 1976, an outbreak of respiratory illness (later named Legionnaire's disease, caused by Legionella pneumophila) occurred among attendees of an American Legion convention held at a hotel in Philadelphia, USA.
Epidemiological Features
- Classified as a common-source, continuous or repeated exposure outbreak
- The outbreak continued beyond the range of one incubation period (unlike a point-source epidemic)
- There was no evidence of secondary cases among persons who had contact with ill persons - ruling out person-to-person (propagated) spread
- The source was ultimately traced to the air conditioning cooling tower of the hotel, from which contaminated aerosols were distributed
Significance
This outbreak demonstrated:
- How to differentiate a continuous common-source epidemic from a point-source epidemic using the epidemic curve
- The importance of ruling out person-to-person spread through careful contact tracing
- The discovery of a previously unknown pathogen (Legionella) - a new disease entity
Type of epidemic: Common-source, continuous/repeated exposure.
CASE STUDY 3: Maxcy's Investigation of Murine Typhus - USA (1920s)
Background
Typhus fever was long considered a single disease entity. In the 1920s, Kenneth Maxcy investigated cases of typhus fever in the southern USA using a spot map by place of employment.
Method & Finding
- Maxcy plotted cases by their place of employment on a geographic map
- The analysis revealed that cases clustered in locations frequented by rodents (rats)
- This geographic pattern pointed strongly to a rodent reservoir and a rodent-associated vector (rat flea) as the transmission mechanism
Outcome
Maxcy's geographic mapping led to the hypothesis of a rodent reservoir for typhus, which ultimately led to the discovery that typhus fever was not a single disease entity - distinguishing epidemic typhus (Rickettsia prowazekii, louse-borne) from murine/endemic typhus (Rickettsia typhi, flea-borne).
Park's comment: "It was by a spot map by 'place of employment' that Maxcy hypothesized a rodent reservoir for typhus fever in 1920s, which led to the discovery that typhus fever was not a single disease entity."
Type of epidemic: Propagated - animal reservoir to human via arthropod vector.
CASE STUDY 4: The AIDS Epidemic - Cluster Analysis (Early 1980s)
Background
When AIDS first appeared in the early 1980s, its cause was unknown. Epidemiologists investigated the cases using descriptive methods.
Method & Finding
- Analysis of case clustering based on sexual contact revealed that cases were concentrated among men who had sex with men
- Clustering based on blood product use identified cases among haemophiliacs and blood transfusion recipients
- These two patterns of clustering provided the epidemiological clue that AIDS was an infectious disease transmitted through blood and sexual contact
Outcome
The epidemic investigation, well before HIV was identified, correctly pointed to:
- An infectious (transmissible) agent
- Blood and sexual routes of transmission
- Target populations at highest risk
This guided early prevention strategies including blood product screening.
Park's comment: "Evidence of case clustering based on sexual contact or blood product use provided the clue that AIDS (Acquired Immune Deficiency Syndrome) was an infectious disease."
CASE STUDY 5: William Budd and Typhoid Fever - Rural England (1856)
Background
After John Snow's cholera work, William Budd in 1856 investigated an outbreak of typhoid fever in rural north England.
Method & Findings
- By careful observations of the pattern of cases in the community
- Budd concluded that the spread was by drinking water - not by miasma or sewer gas (which was the prevailing theory at the time)
Significance
This investigation, like Snow's, was remarkable because the causative organism (Salmonella typhi) had not yet been identified. It established:
- Water-borne transmission of typhoid
- Led to public demands for clean water supplies
- Contributed to the Public Health Act of 1875 in England
Summary: Epidemic Type vs. Classic Case Study
| Case Study | Disease | Year | Location | Epidemic Type | Key Method Used |
|---|---|---|---|---|---|
| John Snow | Cholera | 1854 | London, UK | Common-source (water) | Spot map - Place analysis |
| Legionnaire's disease | Legionellosis | 1976 | Philadelphia, USA | Common-source, continuous | Epidemic curve + contact tracing |
| Maxcy's investigation | Murine typhus | 1920s | Southern USA | Animal reservoir/vector | Spot map - Place of employment |
| AIDS cluster analysis | AIDS/HIV | 1980s | USA | Propagated (person-to-person) | Person analysis - clustering by risk |
| William Budd | Typhoid fever | 1856 | Rural England | Common-source (water) | Descriptive observation |
Key Epidemic Curve - Common-Source (Point-Source) Pattern
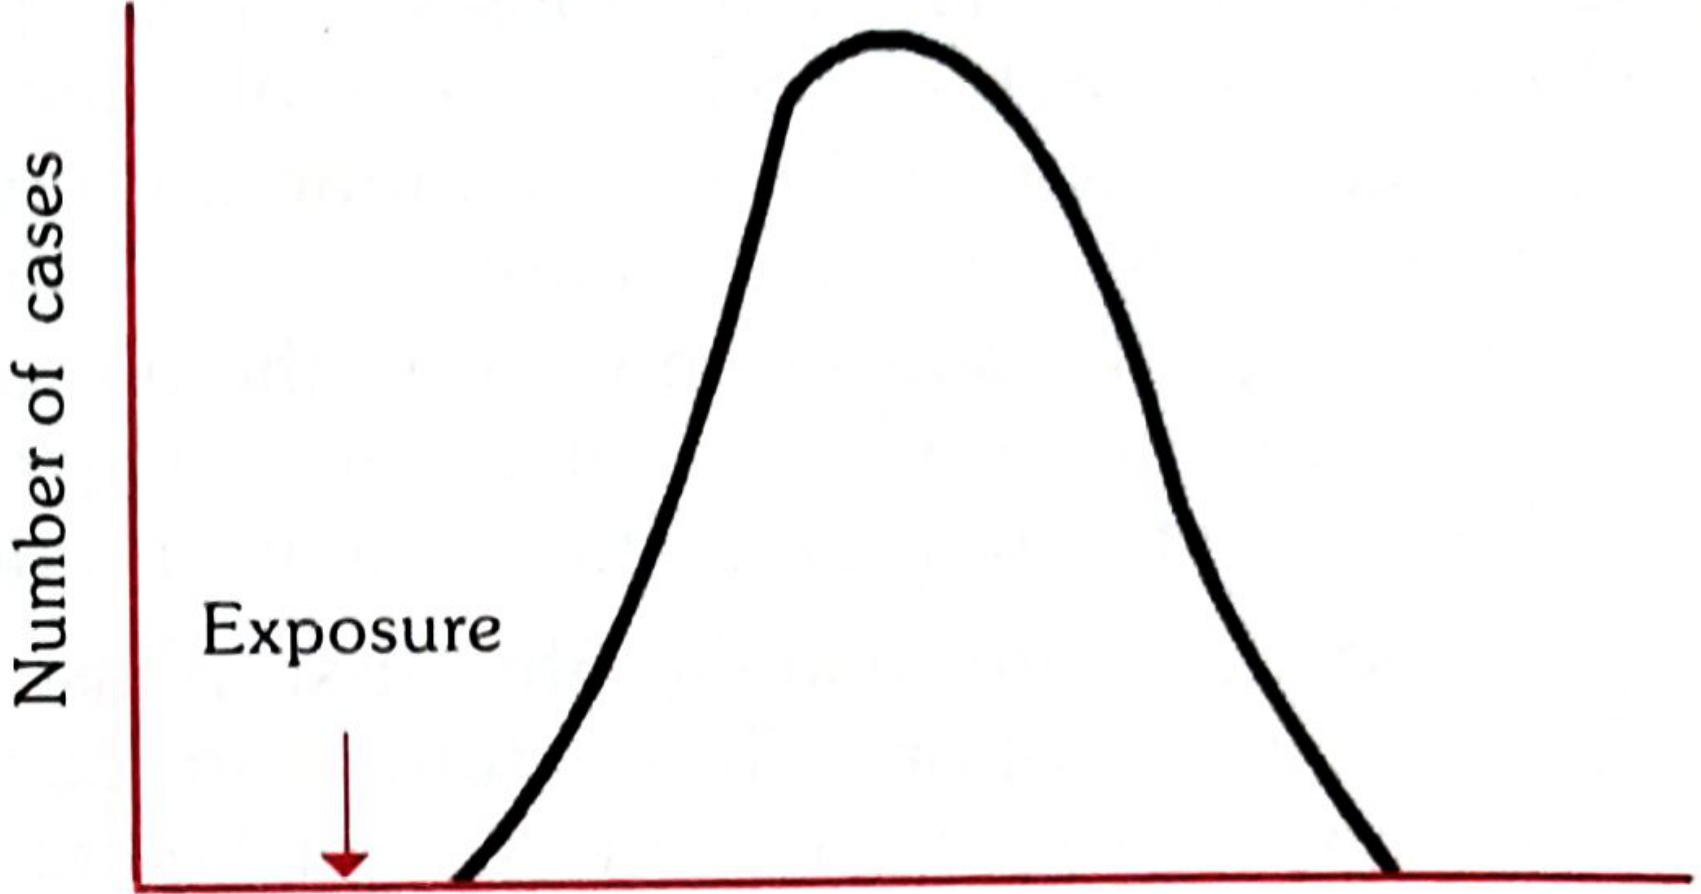
FIG. 4 - Epidemic curve of a common-source, single-exposure (point-source) epidemic. Note: the curve rises and falls rapidly within one incubation period; all cases develop within one incubation period of the disease.
Outbreak Trigger Events (India - Park's Table)
Park's textbook also includes India-specific outbreak trigger thresholds:
| Syndrome | Trigger for Investigation |
|---|---|
| Acute watery diarrhoea | Single case of severe dehydration/death >5 years, OR >10 houses with loose stools per village |
| Fever only | 5 cases per 1,000 population |
| Fever with rash (Measles/Dengue) | 2 similar cases in a village (1,000 pop.) |
| Fever with altered consciousness | 2 cases per village/1,000 pop. |
| Fever with bleeding | 2 cases per village/1,000 pop. |
| Jaundice | >2 cases per village/1,000 pop. |
| Unusual event | >2 deaths or hospitalizations |
Source: Park's Textbook of Preventive and Social Medicine
Define POPULATION EXPLOSION. What are demographic trends in India. What measures measures do you suggest for the control of population explosion.
Searching sources...
Reading File
Finding Sources
Finding Sources
Finding Sources
Finding Sources
Reading File
Reading File
Reading File
Finding Sources
I can see DEMOGRAPHIC TRENDS IN INDIA is at line 6648. Let me read that section fully, and also find the population explosion definition and measures for control.
Reading File
Finding Sources
Reading File
Finding Sources
Reading File
Finding Sources
Finding Sources
Reading File
Reading File
Reading File
Now let me get the population explosion definition and measures for control from the block7 (demographic transition section) and the block8 (family planning).
Reading File
Reading File
Reading File
Now let me get the population explosion definition section and the measures for control from block7 (which should be just before the world population trends section).
Reading File
Reading File
Now let me get the actual definition of "population explosion" and the measures for control.
Reading File
Reading File
I now have comprehensive data from Park's textbook. Let me compile a thorough, well-structured answer.
Population Explosion, Demographic Trends in India & Control Measures
Park's Textbook of Preventive and Social Medicine
PART I: DEFINITION OF POPULATION EXPLOSION
Population explosion refers to the unprecedented rapid growth of the world's human population, particularly since the mid-20th century, resulting from a wide gap between a persistently high birth rate and a sharply declining death rate - with more births than deaths at any given time.
Park's textbook captures this vividly:
"It required all of human history up to the year 1800 for the world population to reach one billion. The second billion came in 130 years (around 1930), the third billion in 30 years (around 1960), the fourth billion in 15 years (1974), the fifth billion in 12 years (1987), and the sixth billion in 12 years (1999)."
This progressive shortening of the time needed to add each billion people is the hallmark of the population explosion. It is rooted in the demographic cycle - a shift from Stage 1 (high birth rate + high death rate = stationary population) to Stage 2-3 (falling death rate + unchanged high birth rate = explosive growth). The problem is described by Park's textbook epigram:
"Delay the first, postpone the second, and prevent the third" (referring to births)
The rampant population growth has been viewed as the greatest obstacle to the economic and social advancement of the majority of people in the underdeveloped world.
PART II: DEMOGRAPHIC TRENDS IN INDIA
A. Population Growth
India's population has grown dramatically since 1921 (the "Big Divide" - the year when population began increasing uninterruptedly):
| Year | Total Population (millions) | Annual Growth Rate (%) | Decadal Growth Rate (%) |
|---|---|---|---|
| 1901 | 238.4 | - | - |
| 1921 | 251.3 | (-) 0.03 | (-) 0.31 |
| 1931 | 279.0 | 1.04 | 11.00 |
| 1951 | 361.1 | 1.25 | 13.31 |
| 1961 | 439.2 | 1.96 | 21.64 |
| 1971 | 548.2 | 2.20 | 24.80 |
| 1981 | 683.3 | 2.22 | 24.66 |
| 1991 | 846.4 | 2.16 | 23.87 |
| 2001 | 1,028.6 | 1.70 | 21.52 |
| 2011 | 1,210.1 | 1.64 | 17.64 (declining) |
| 2020 | 1,400.2 | - | - |
Key observation: The decadal growth rate is declining (from 24.8% in 1971 to 17.64% in 2011), indicating a slowing - but India's population is still increasing by 16 million people every year.
- India doubled from 238 million (1901) to 439 million in 60 years (1961)
- Doubled again to 846 million in only 30 years (1991)
- Crossed 1 billion on 11 May 2000
- At 1.4 billion (mid-2020), India supports 17.5% of the world's population on just 2.4% of the world's land area
- Projected to reach 1.53 billion by 2050 and surpass China as world's most populous country around 2027
B. Birth Rate and Death Rate Trends in India
| Indicator | Value (approx.) |
|---|---|
| Crude Birth Rate (CBR) | ~18.2 per 1,000 (2019) |
| Crude Death Rate (CDR) | ~6.2 per 1,000 (2019) |
| Natural Growth Rate | ~12 per 1,000 |
| Total Fertility Rate (TFR) | 2.2 (national average) |
| Replacement level TFR | 2.1 |
| Life expectancy at birth | ~69 years |
- Southern states (Kerala, Tamil Nadu, Karnataka, Andhra Pradesh) have achieved TFR near or below replacement level (2.1)
- High-focus northern/central states (Bihar TFR 3.3, UP 3.1, Meghalaya 3.0) drive national population increase
- These high-fertility states are anticipated to contribute about 50% of the nation-wide increase in population
C. Age-Sex Composition (India, 2018)
| Age Group | Total % | Males % | Females % |
|---|---|---|---|
| 0-14 years | ~25.9 | 26.5 | 25.3 |
| 15-64 years (working age) | ~65.8 | ~65.5 | ~66.2 |
| 60+ years | ~8.3 | ~7.9 | ~8.6 |
- Population in age group 0-14 is showing decline - a positive demographic sign
- Proportion of elderly (60+) is increasing - will impose greater burden on health services
- India's young working-age population offers a potential "demographic dividend" if harnessed
D. Sex Ratio
| Year | Females per 1,000 Males |
|---|---|
| 1901 | 972 |
| 1951 | 946 |
| 1981 | 934 |
| 2011 | 943 |
| Sex ratio at birth (2016-18) | 899 (national average) |
- Haryana (843), Delhi (844), and Uttarakhand (840) have the most skewed sex ratios at birth
- Kerala (957) and Chhattisgarh (958) have the most balanced
- The low sex ratio at birth reflects sex-selective practices, posing a serious social and demographic problem
E. Density of Population
| Year | Per Sq. km |
|---|---|
| 1901 | 77 |
| 1951 | 117 |
| 1971 | 177 |
| 1991 | 267 |
| 2011 | 382 |
| 2020 | 464 |
India's density of 464 persons/sq. km (2020) reflects extreme pressure on land and resources.
F. Urbanization
- Urban population (2019): 471.8 million (34.5%) - still predominantly rural
- Urbanization driven by: natural population growth + rural-to-urban migration (for employment, education, health)
- Major metros (2019): Mumbai (12.69 million), Delhi (10.93 million), Bengaluru (5.10 million)
- Continuous rural-urban migration constitutes a social crisis impairing quality of life
G. Literacy
- National literacy rate (2011): 74.04% (males 82.14%; females 65.46%)
- Highest literacy: Kerala 93.91%, Mizoram 91.58%
- Lowest: Bihar 63.82%, Arunachal Pradesh 66.95%
- Low female literacy in states like Rajasthan (52.66%) directly contributes to high fertility
H. Demographic Stage: Where is India?
India has entered Stage 3 (Late Expanding) of the demographic cycle - death rate declining, birth rate tending to fall, but population continues to grow because births still exceed deaths. Some southern states are transitioning toward Stage 4 (Low Stationary).
PART III: MEASURES FOR CONTROL OF POPULATION EXPLOSION
Park's textbook classifies these under direct (family planning) measures and indirect (socioeconomic) measures:
A. DIRECT MEASURES (Family Planning / Contraception)
1. Spacing Methods (Temporary Methods)
Barrier methods:
- Condom - male barrier, also prevents STIs
- Diaphragm / Cervical cap - female barriers
- Spermicides
Hormonal methods:
- Oral contraceptive pills (OCP) - combined estrogen-progestin; highly effective
- Progestin-only pills (Mini-pill)
- Injectable contraceptives (DMPA - Depo-Provera)
- Implants (sub-dermal progestin implants)
Intrauterine devices (IUDs/IUCD):
- Copper-T (Cu-T 380A) - highly effective, long-acting
- Hormonal IUDs (LNG-IUS)
Natural methods:
- Rhythm method / Calendar method
- Lactational Amenorrhoea Method (LAM)
- Basal body temperature method
- Cervical mucus (Billings) method
2. Terminal / Permanent Methods (Sterilization)
Male:
- Vasectomy (conventional)
- No-scalpel vasectomy (NSV) - safer, more acceptable; currently promoted under National Family Welfare Programme
Female:
- Tubectomy/Tubal ligation (minilaparotomy - most common in India)
- Laparoscopic sterilization (using Falope rings or clips)
- Can be done as: interval procedure, post-partum, or concurrent with MTP
Campaign slogan: "Hum Do, Hamare Do" (We two, ours two - the two-child family norm) - NRR = 1 is the long-term demographic goal.
B. INDIRECT / SOCIOECONOMIC MEASURES
These are the most important and sustainable measures - Park's textbook emphasizes: "economic development is the best contraceptive."
1. Education
- Universal primary and secondary education, especially for girls
- Population education at school and university level - making students aware of consequences of uncontrolled growth and benefits of a small family
- Low female literacy (e.g., Rajasthan 52.66%) is directly correlated with high TFR
2. Raising the Age of Marriage
- Prohibition of Child Marriage - legal minimum age: 18 for girls, 21 for boys
- Delayed marriage reduces reproductive span and total fertility
3. Improving Status of Women
- Employment opportunities for women
- Economic empowerment and financial independence
- Women with education and employment desire fewer children
4. Old Age Social Security
- One reason for large families: children as old age insurance
- State-supported old age security reduces dependence on children as economic assets
5. Economic Development
- Historically proven: countries that achieved economic development also achieved fertility decline
- "The best motivation is economic - a desire to improve standard of living"
6. Compulsory Education of Children
- Reduces child labor, raises cost of raising children, lowers desired family size
7. Mass Communication and IEC (Information, Education, Communication)
- Communication of small family norm through mass media (TV, radio, social media)
- Attitude surveys show >60% already have favorable attitudes to family planning
- The challenge is converting favorable attitudes into actual contraceptive use
8. Legislation
- Laws against sex determination (Pre-Conception and Pre-Natal Diagnostic Techniques Act - PC-PNDT)
- Child marriage prevention acts
- Incentives and disincentives for family size (controversial)
9. Voluntary Organizations
- Family Planning Association of India
- Family Planning Foundation of India
- Population Council of India
- Indian Medical Association, Indian Red Cross - all supplement government efforts
C. NATIONAL PROGRAMME (India's Family Welfare Programme)
India was the first country in the world to launch a national family planning programme (1952). Key features:
- Renamed Family Welfare Programme (1977) to avoid coercive connotations
- Target-free approach adopted (1996) - reproductive health approach replacing numerical targets
- Current strategy: Reproductive and Child Health (RCH) approach
- Focus states: BIMARU states (Bihar, UP, MP, Rajasthan) + Jharkhand, Chhattisgarh, Uttarakhand, Assam, Odisha (highest TFR states)
- Two-child family norm as the campaign goal
- Demographic goal: achieve NRR = 1 (Net Reproduction Rate = 1, i.e., each woman replaces herself exactly)
Summary: Measures at a Glance
| Category | Measures |
|---|---|
| Contraceptive | OCPs, IUCDs, condoms, sterilization (vasectomy/tubectomy), injectables, barrier methods |
| Educational | Female education, population education, IEC campaigns |
| Social | Raise marriage age, improve women's status, old-age security |
| Economic | Economic development, employment for women, raise per capita income |
| Legal | Anti-child marriage laws, PC-PNDT Act, compulsory education |
| Programmatic | National Family Welfare Programme, RCH programme, focus on BIMARU states |
Source: Park's Textbook of Preventive and Social Medicine
This is a shared conversation. Sign in to Orris to start your own chat.