
Explain in detail nutrition and health in community medicine
Reading File
Now let me search the medical library for nutrition and community medicine content in parallel.
Finding Sources
Finding Sources
Finding Sources
Finding Sources
Excellent! Found the key sections. Let me read the main nutrition sections in parallel.
Reading File
Reading File
Finding Sources
Reading File
Reading File
Reading File
Reading File
Reading File
Finding Sources
Reading File
Finding Sources
Finding Sources
Finding Sources
Searching Images
protein energy malnutrition kwashiorkor marasmus children community
Reading File
Reading File
I now have comprehensive content from Park's Textbook. Let me compile the full detailed answer.
Nutrition and Health in Community Medicine
Based primarily on Park's Textbook of Preventive and Social Medicine
1. Introduction: Concept of Nutrition in Community Medicine
Nutrition is a cornerstone of community medicine and public health. It refers to the science of how food sustains life - providing energy, building materials, and regulatory substances essential for growth, reproduction, and health maintenance. In a community context, nutrition is viewed not merely as an individual concern but as a population-level determinant of health, productivity, and survival.
Food means not only proteins, fats, minerals, vitamins and other nutrients - it is part of security and civilization. Hunger and malnutrition are problems everywhere and have threatened peace throughout history. The growing incidence of hunger and malnutrition remains at the forefront of international concern.
2. Definition of Malnutrition
Malnutrition is defined as "a pathological state resulting from a relative or absolute deficiency or excess of one or more essential nutrients." It comprises four forms:
| Form | Definition |
|---|---|
| Undernutrition | Results when insufficient food is eaten over an extended period; extreme form is starvation |
| Overnutrition | Pathological state from excessive food consumption over time; leads to obesity, atheroma, diabetes |
| Imbalance | Disproportion among essential nutrients, with or without absolute deficiency |
| Specific deficiency | Relative or absolute lack of an individual nutrient (e.g., vitamin A, iron, iodine) |
On a global scale, the five principal nutritional deficiency diseases accorded highest priority are:
- Wasting
- Stunting
- Xerophthalmia (Vitamin A deficiency)
- Nutritional anaemias
- Endemic goitre
These represent the "tip of the iceberg" - a much larger population is affected by hidden malnutrition that is not easy to diagnose.
3. Undernutrition: The Major Problem in Developing Countries
3.1 Burden of Undernutrition in India
Undernutrition is identified as a major health and nutrition problem in India. It is not only an important cause of childhood morbidity and mortality but leads to permanent impairment of physical - and possibly mental - growth of survivors.
Key statistics (NFHS-4):
- 18.5% of children are born with low birth weight
- 35.7% are underweight (weight for age, <5 years)
- 38.4% are stunted (height for age, <5 years)
- 21% are wasted (weight for height)
- About 33% of adult men and 36% of adult women have BMI below 18.5 (indicating chronic energy deficiency)
The term undernutrition encompasses:
- Stunting - chronic malnutrition (low height for age)
- Wasting - acute malnutrition (low weight for height)
- Underweight - low weight for age
3.2 Protein-Energy Malnutrition (PEM)
PEM is characterized by:
- Low birth weight in malnourished mothers
- Poor growth in children
- High mortality between 12 and 24 months of age
- Estimated as underlying cause in ~30% of deaths in children under 5
The concept has evolved from "protein gap" to "food gap" - PEM is primarily due to:
- Inadequate intake of food in both quantity and quality
- Infections (diarrhoea, respiratory infections, measles, intestinal worms) that increase nutritional requirements while decreasing absorption
It is a vicious circle: infection -> malnutrition -> infection.
3.3 Kwashiorkor vs Marasmus
| Feature | Kwashiorkor | Marasmus |
|---|---|---|
| Cause | Low protein/energy ratio (primarily protein deficiency) | Inadequate intake of both protein AND energy |
| Oedema | Present (characteristic feature) | Absent or minimal |
| Wasting | Present | Severe wasting and cachexia |
| Subcutaneous fat | Retained | Severely depleted |
| Serum albumin | Low (hypoalbuminaemia) | Non-normal levels |
| Liver | Enlarged, steatosis | Usually normal |
| Skin/hair | Possible depigmentation | No depigmentation typically |
Children who are severely wasted are 9 times more likely to die than well-nourished children.
4. Micronutrient Malnutrition ("Hidden Hunger")
About 2 billion people are affected by micronutrient malnutrition. Key deficiency diseases:
4.1 Vitamin A Deficiency (VAD)
- Single most frequent cause of preventable blindness among pre-school children in developing countries
- Children aged 6 months to 6 years are most vulnerable (high requirements + frequent infections)
- ~20% of children with VAD are at increased risk of death from common infections
- ~2% are blinded or suffer serious sight impairment
- Leading to xerophthalmia (from night blindness to corneal ulceration/keratomalacia)
4.2 Iron Deficiency Anaemia (Nutritional Anaemia)
- Affects all age groups: pre-school children, school children, pregnant women, elderly
- Even mild anaemia reduces resistance to fatigue and impairs psychological and physical behaviour
- In pregnancy: increases risk of maternal/foetal mortality, associated with abortions, premature births, postpartum haemorrhage, and low birth weight. In India, 19% of maternal deaths were found to be due to anaemia
- Immunity: Iron deficiency impairs cellular responses and immune function
- Work capacity: Even mild anaemia causes significant reduction in maximal work capacity and productivity
Haemoglobin classification for intervention:
- Hb < 10 g/dl: Severe anaemia - high dose iron or blood transfusion
- Hb 10-12 g/dl: Moderate - iron and folic acid supplementation
4.3 Iodine Deficiency Disorders (IDD)
- About 1.5 billion people live in iodine-deficient environments
- Causes goitre, cretinism, and brain damage
- Each year: >30,000 stillbirths and >120,000 births with mental retardation, physical stunting, deaf-mutism or paralysis
- Even without overt disease, iodine deficiency causes mental dullness and apathy
5. Ecology of Malnutrition: Causative Factors
Malnutrition is a man-made disease - a disease of human societies. It begins in the womb and ends in the grave. Jelliffe (1966) classified ecological factors as:
(1) Conditioning Influences
Infectious diseases are the most important conditioning factor:
- Diarrhoea, intestinal parasites, measles, whooping cough, malaria, tuberculosis all contribute
- In poor environments, children may suffer infections for almost half of their first three years of life
(2) Cultural Influences
- Food habits, customs, beliefs, traditions: Deep psychological roots linked to love, social prestige, and family traditions. Passed from generation to generation
- Food taboos: Most often applied to vulnerable groups - infants, toddlers, pregnant and lactating women (e.g., papaya avoided in pregnancy as it is believed to cause abortion)
- People choose poor diets even when good ones are available due to cultural influences
(3) Socio-economic Factors
- Poverty is the most fundamental determinant
- Large family size, poor maternal health, failure of lactation, premature termination of breastfeeding
- Adverse child-rearing practices: over-diluted cow's milk, discarding cooking water from cereals, delayed supplementary feeding
(4) Food Production
- Agricultural productivity, seasonal variations, land distribution
- Post-harvest losses and food storage issues
(5) Health and Other Services
- Inadequate antenatal care, failure of breastfeeding promotion, poor access to health services
The Malnutrition-Infection Cycle
Malnutrition is self-perpetuating:
- A child's nutritional status at any point depends on past nutritional history
- This is linked to the mother's health and nutritional status
- Which was in turn influenced by HER living conditions during her own childhood
6. Effects of Malnutrition on the Community
Direct Effects
- Frank nutritional deficiency diseases: kwashiorkor, marasmus, xerophthalmia, anaemia, goitre
- Subclinical forms of deficiency (the larger "hidden" portion of the iceberg)
Indirect Effects
- High morbidity and mortality: Nearly 50% of total deaths in developing countries occur among children under 5 years (vs < 5% in developed countries)
- Retarded physical and mental growth - may be permanent
- Lowered vitality and productivity of the population
- Reduced life expectancy
- High rates of maternal mortality, stillbirths, and low birth weight
7. Assessment and Measurement of Undernutrition
In Children
| Indicator | Measurement | Significance |
|---|---|---|
| Weight for age | Growth chart | Most practical; first indicator of PEM |
| Height for age | Anthropometry | Stunting; reflects cumulative malnutrition |
| Weight for height | Anthropometry | Wasting; reflects current severe undernutrition |
| Arm circumference (MUAC) | Tape measure | Useful when age unknown; reflects muscle mass |
MUAC (Mid-Upper Arm Circumference) interpretation:
-
13.5 cm = Satisfactory nutritional status
- 12.5-13.5 cm = Mild to moderate malnutrition
- <12.5 cm = Severe malnutrition
MUAC is particularly valuable in field settings as it requires no age data and can be used by field health workers.
Nutrition Surveillance Indicators
| Phenomenon | Indicator |
|---|---|
| Maternal Nutrition | Birth weight |
| Infant/preschool nutrition | Breast-feeding proportions; height for age; weight for height; arm circumference |
| School child nutrition | Height for age; weight for height at 7 years or school admission |
8. Social Aspects of Nutrition
Overnutrition (The "New" Problem in Developed Countries)
While undernutrition dominates in developing countries, developed nations face the opposite problem:
- High incidence of obesity, diabetes, hypertension, cardiovascular and renal diseases, disorders of liver and gall bladder
- These are attributed to excess caloric intake, physical inactivity, and poor dietary quality
Food Security
Food security exists when all people, at all times, have physical and economic access to sufficient, safe, and nutritious food to meet their dietary needs. It has four dimensions:
- Availability - sufficient food produced
- Access - physical and economic access
- Utilization - proper use and absorption
- Stability - consistent access over time
9. Food Surveillance and Food Hygiene
Food surveillance is essential for the protection and maintenance of community health - it implies monitoring of food safety/food hygiene.
WHO defines food safety/food hygiene as: "All conditions and measures that are necessary during the production, processing, storage, distribution and preparation of food to ensure that it is safe, sound, wholesome and fit for human consumption."
The Declaration of Alma-Ata recognized food safety as an essential component of primary health care.
Milk Hygiene
Milk is an efficient vehicle for a variety of disease agents. Sources of contamination:
- The dairy animal (tuberculosis, brucellosis, Q fever, salmonellosis, staphylococcal enterotoxin poisoning)
- Human handlers
- Environment (contaminated vessels, polluted water, flies, dust)
10. Community Nutrition Programmes in India
The Government of India has initiated large-scale programmes to combat malnutrition, summarized below:
| Programme | Ministry | Focus |
|---|---|---|
| Vitamin A Prophylaxis Programme | Health & Family Welfare | 200,000 IU orally every 6 months to pre-school children |
| Prophylaxis against Nutritional Anaemia | Health & Family Welfare | Iron + folic acid tablets to pregnant women and children 1-12 yrs |
| Iodine Deficiency Disorders Control Programme | Health & Family Welfare | Iodised salt; launched as National Goitre Control Programme in 1962 |
| Special Nutrition Programme | Social Welfare | Supplementary feeding for vulnerable groups |
| Balwadi Nutrition Programme | Social Welfare | Nutritional support for young children |
| ICDS (Integrated Child Development Services) | Social Welfare | Comprehensive child nutrition + development |
| Mid-day Meal Programme | Education / HRD | Nutritional support to school-age children |
Key Programme Details
Vitamin A Prophylaxis Programme (launched 1970):
- Single massive dose of 200,000 IU of vitamin A (oily preparation) orally every 6 months to all pre-school children
- Delivered by peripheral health workers
- Technology developed at the National Institute of Nutrition, Hyderabad
- Evaluation showed significant reduction in VAD in children
National Nutritional Anaemia Prophylaxis Programme (Fourth Five Year Plan):
- Pregnant women and lactating mothers: 100 mg elemental iron + 0.5 mg folic acid daily
- Children (1-12 years): 20 mg elemental iron + 0.1 mg folic acid daily for 100 days
- Implemented via MCH centres, PHCs, and ICDS projects
National Iron Plus Initiative (NIPI) and Weekly Iron Folic Acid Supplementation (WIFS):
- Expanded programme targeting all age groups including adolescents
IDD Control Programme:
- Launched 1962 (Himalayan goitre belt initially)
- Iodisation of common salt is the primary strategy
- Technology for iron fortification of salt also developed at NIN Hyderabad
11. Prevention of PEM at Community Level
Adapted from the 8th FAO/WHO Expert Committee on Nutrition:
Health Promotion
- Measures directed to pregnant and lactating women (education, supplement distribution)
- Promotion of breastfeeding (exclusive breastfeeding for 6 months)
- Development of low-cost weaning foods - frequent small feeds
- Measures to improve family diet
- Nutrition education - correct feeding practices
- Home economics
- Family planning and birth spacing
- Improved family environment
Specific Protection
- Protein and energy-rich foods in the child's diet (milk, eggs, fresh fruits)
- Immunization (breaks the infection-malnutrition cycle)
- Food fortification
Role of International Agencies
Several international agencies - FAO, UNICEF, WHO, World Bank, UNDP, and CARE - work collaboratively with national governments in the battle against malnutrition.
12. Nutrition Indicators in Global Health Monitoring (SDG Framework)
Key SDG nutrition indicators monitored include:
- Exclusive breastfeeding rate (0-5 months)
- Early initiation of breastfeeding
- Incidence of low birth weight
- Children under 5 years who are stunted (SDG 2.2.1)
- Children under 5 years who are wasted (SDG 2.2.2)
- Children under 5 years who are overweight (SDG 2.2.2)
- Anaemia prevalence in children
- Anaemia prevalence in women of reproductive age
13. Nutrition in Disasters
Natural disasters affect nutritional status by disrupting the food chain. The most vulnerable groups are infants, children, pregnant women, nursing mothers, and sick persons. Immediate steps for effective food relief:
- Assess food supplies after disaster
- Gauge nutritional needs of affected population
- Calculate daily food rations for large population groups
- Monitor nutritional status of affected population
Summary: The Double Burden of Malnutrition
Community medicine addresses a double burden:
- Developing countries: Undernutrition dominates - PEM, micronutrient deficiencies, stunting, wasting
- Developed countries: Overnutrition dominates - obesity, cardiovascular disease, diabetes, hypertension
- Middle-income countries (including India): Face BOTH problems simultaneously
The fundamental approach in community medicine is:
- Surveillance and assessment of nutritional status
- Identification of high-risk groups (infants, pregnant women, lactating mothers, elderly)
- Targeted supplementation and fortification programmes
- Nutrition education and behavioural change
- Food security interventions
- Breaking the malnutrition-infection cycle through immunization and sanitation
- Inter-sectoral coordination (health, agriculture, education, social welfare)
Source: Park's Textbook of Preventive and Social Medicine - the standard community medicine reference covering all aspects of nutrition from epidemiology of malnutrition through national control programmes.
Explain assessment of nutrition and health in community medicine
Reading File
Now let me search for all the relevant sections on nutritional assessment in Park's textbook simultaneously.
Finding Sources
Finding Sources
Finding Sources
Found the key section. Now let me read it comprehensively in parallel passes.
Reading File
Finding Sources
Finding Sources
Excellent content found. Let me fetch the key diagram and read the next sections in parallel.
Loading Image
Reading File
The read at offset 5608 showed the surveillance table. The main assessment content was in the first read (5408-5608). Let me now read the full detail of all 7 assessment methods from that initial read, and also pick up sections I need to expand on.
Reading File
I now have all 7 methods. The truncated output cut off mid-section. Let me get the remaining content covering methods 4-7 and dietary assessment details.
Reading File
Finding Sources
Reading File
I now have all 7 methods covered comprehensively. I also need the functional indicators table details. Let me get the remaining truncated part from the last read which had the functional indicators and dietary assessment methods.
Reading File
I have all the core content needed. Now let me compile the comprehensive, well-structured answer.
Assessment of Nutritional Status in Community Medicine
Source: Park's Textbook of Preventive and Social Medicine
1. Introduction and Purpose
The nutritional status of an individual is the result of many interrelated factors - influenced by the adequacy of food intake (in quantity and quality) and the physical health of the individual. The nutritional status of a community is the sum of the nutritional status of the individuals who form that community.
The main objectives of a comprehensive nutritional survey are:
- Obtain precise information on the prevalence and geographic distribution of nutritional problems in a given community
- Identify individuals or population groups "at risk" or in greatest need of assistance
- Enable policy formulation and programme planning
- Evaluate the effectiveness of existing nutrition programmes
Without nutritional assessment, problems cannot be defined and policies cannot be formulated. The purpose is to develop a health care programme that meets the needs defined by the assessment.
2. Survey Design Principles
In nutritional surveys, it is not necessary to examine the entire community. A random and representative sample covering:
- All age groups
- Both sexes
- Different socio-economic groups
...is sufficient to draw valid conclusions. All surveys must be planned with expert statistical advice and key decisions made in advance:
- Duration of survey
- Type of survey (cross-sectional vs longitudinal)
- Standardization of measurement techniques and instruments
- Opportunity for an intensive sub-sample investigation
3. Natural History Framework for Assessment
Proper evaluation demands a many-angled approach, covering all different stages in the natural history of nutritional diseases - including the prepathogenesis stage:
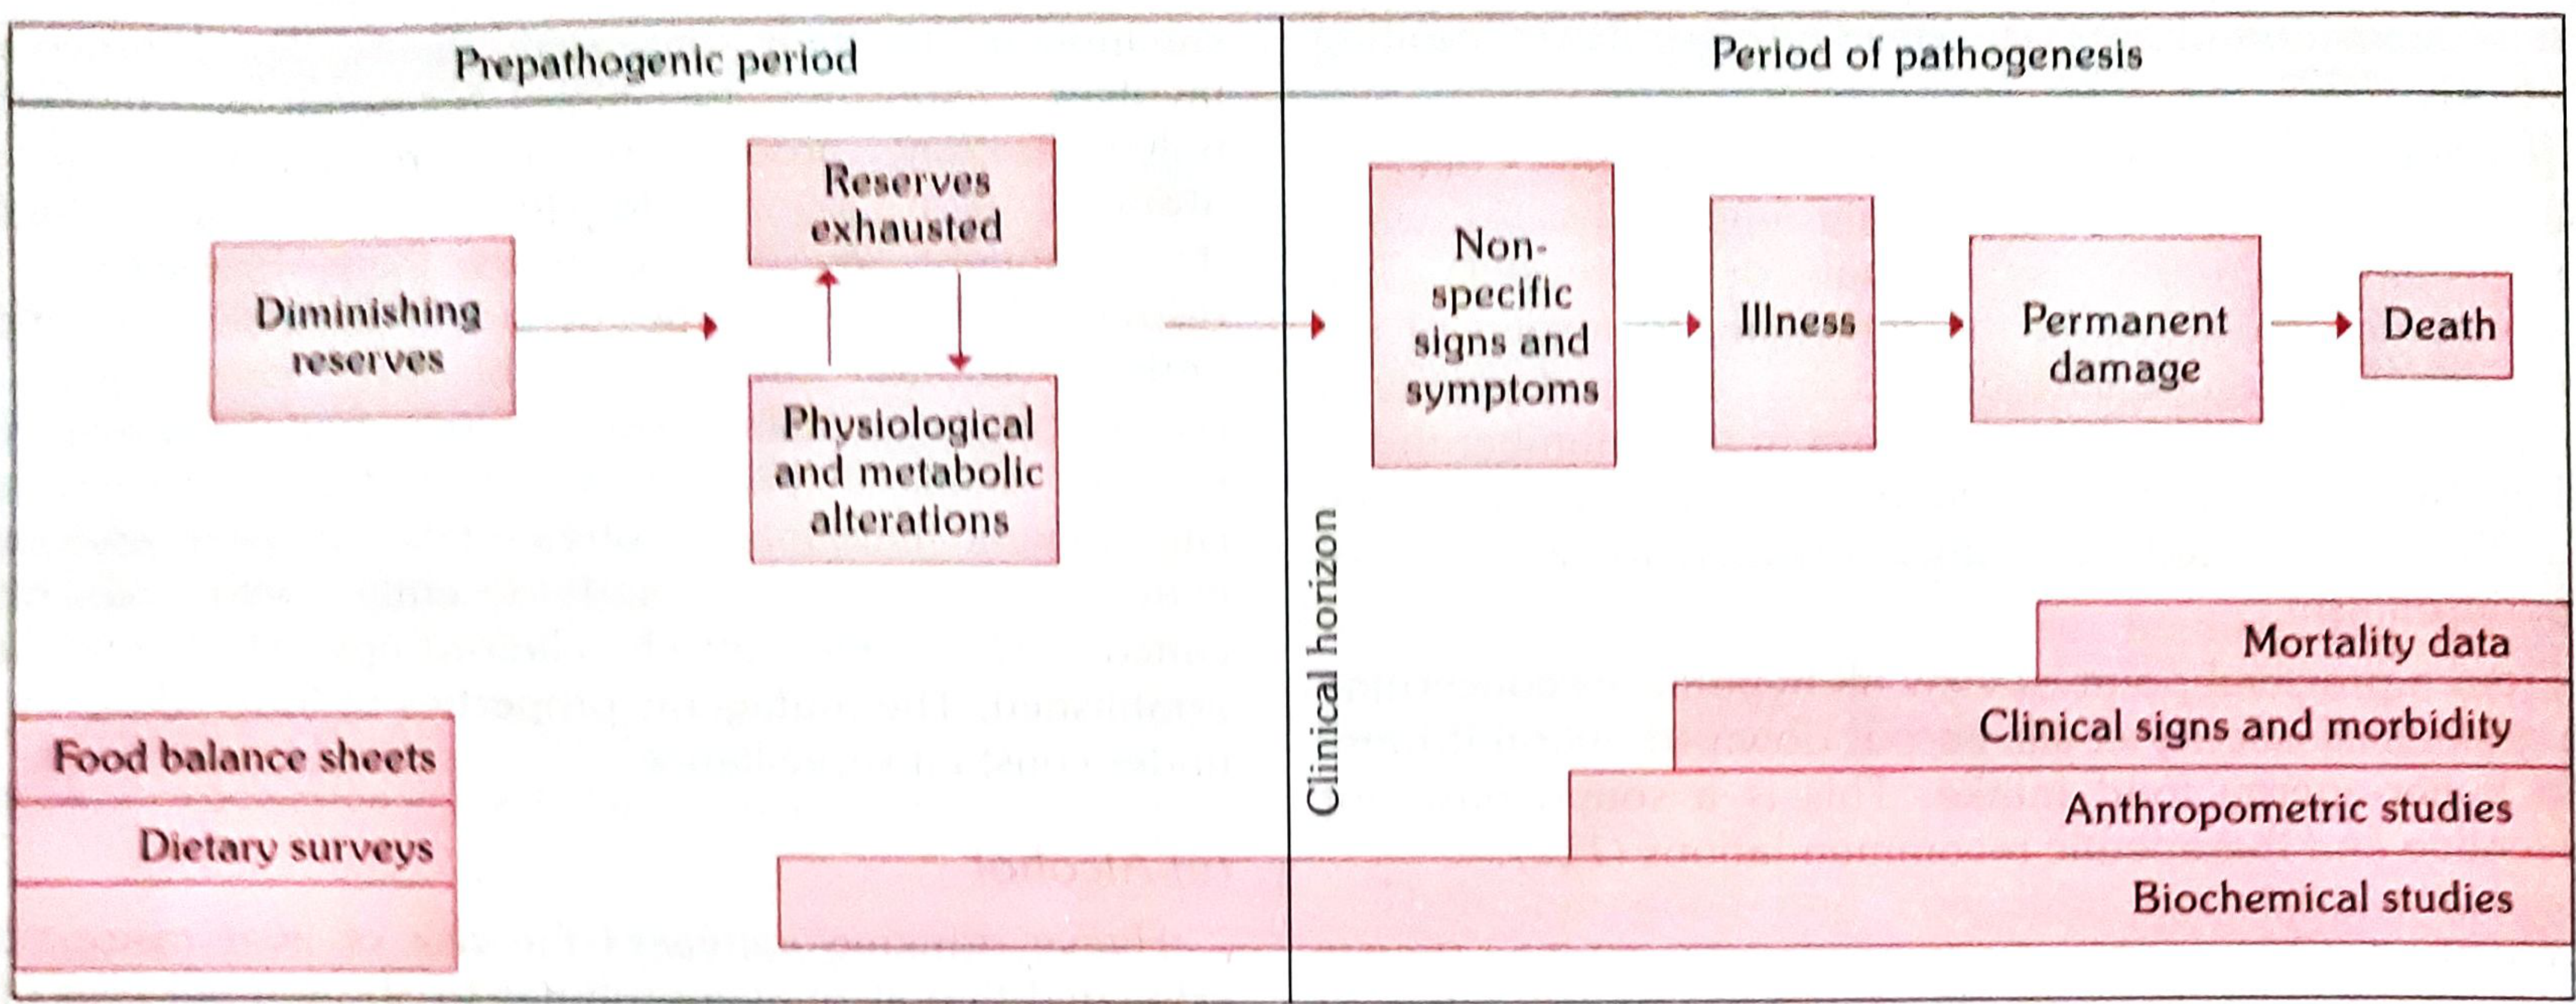
Fig: Methods of nutritional assessment mapped to the natural history of disease (Park's Textbook of Preventive and Social Medicine)
As shown in the diagram:
- Prepathogenic period: Food balance sheets and dietary surveys detect diminishing reserves before any clinical signs appear
- Biochemical studies: Span both prepathogenic and pathogenic periods - detect physiological and metabolic alterations early
- Anthropometric studies: Come into play as malnutrition becomes measurable physically
- Clinical signs and morbidity: Detect illness after the clinical horizon is crossed
- Mortality data: The final and most advanced stage indicator
The different methods are not mutually exclusive - they are complementary to each other.
4. The Seven Methods of Nutritional Assessment
Method 1: Clinical Examination
Clinical examination is an essential feature of all nutritional surveys as it is the simplest and most practical method of assessing nutritional status.
Classification of clinical signs (WHO Expert Committee):
| Category | Examples |
|---|---|
| (a) Not related to nutrition | Alopecia, pyorrhoea, pterygium |
| (b) Needs further investigation | Malar pigmentation, corneal vascularization, geographic tongue |
| (c) Known to be of value | Angular stomatitis, Bitot's spots, calf tenderness, absent knee/ankle jerks (beri-beri), thyroid enlargement (goitre) |
When two or more clinical signs characteristic of a deficiency disease are present simultaneously, their diagnostic significance is greatly enhanced.
Drawbacks of clinical examination:
- Malnutrition cannot be quantified on the basis of clinical signs alone
- Many deficiencies are unaccompanied by physical signs
- Most signs lack specificity and are subjective in nature
To minimize errors, standard survey forms (schedules) covering all areas of the body have been devised.
Key clinical signs and their nutritional correlates:
| Sign | Deficiency |
|---|---|
| Bitot's spots, night blindness, xerophthalmia | Vitamin A |
| Angular stomatitis, cheilosis | Riboflavin (B2) |
| Calf tenderness, absent ankle/knee jerks | Thiamine (B1) - Beri-beri |
| Bleeding gums, petechiae | Vitamin C (Scurvy) |
| Goitre | Iodine deficiency |
| Oedema, skin depigmentation | Protein deficiency (Kwashiorkor) |
| Severe wasting, "old man face" | Protein-energy deficiency (Marasmus) |
| Rickets, knock-knees, bow legs | Vitamin D / Calcium |
| Koilonychia (spoon nails), pallor | Iron deficiency anaemia |
Method 2: Anthropometry
Anthropometric measurements are valuable indicators of nutritional status. They reflect patterns of growth and development and show how individuals deviate from the average in body size, build, and nutritional status. Anthropometric data can be collected by non-medical personnel with sufficient training.
Key Anthropometric Measurements:
In Adults:
| Measurement | What it indicates |
|---|---|
| Body Mass Index (BMI) = Weight(kg)/Height(m²) | Overall nutritional status; chronic energy deficiency |
| Weight | Current nutritional status |
| Height | Long-term nutritional history |
| Skinfold thickness | Body fat / adiposity |
| Waist-hip ratio | Central obesity, cardiovascular risk |
BMI Classification:
- < 18.5: Underweight (chronic energy deficiency)
- 18.5-24.9: Normal
- 25-29.9: Overweight
- ≥ 30: Obese
About 33% of adult men and 36% of adult women in India have BMI below 18.5.
In Children (additional measurements):
| Measurement | Indicator | Reflects |
|---|---|---|
| Weight for Age | Underweight | Overall nutritional depletion |
| Height for Age | Stunting (chronic malnutrition) | Cumulative effects of undernutrition since birth |
| Weight for Height | Wasting (acute malnutrition) | Current severe undernutrition or disease |
| Mid-Upper Arm Circumference (MUAC) | Muscle mass depletion | Useful when age is unknown |
| Head circumference | Brain growth (infants) | Severe early malnutrition |
| Chest circumference | Growth assessment | Nutritional status in infants |
MUAC (Mid-Upper Arm Circumference) Interpretation:
- > 13.5 cm = Satisfactory nutritional status
- 12.5 - 13.5 cm = Mild to moderate malnutrition
- < 12.5 cm = Severe malnutrition
MUAC is especially useful in field settings because it requires no age data and can be measured with just a tape.
Growth Charts:
- The first indicator of PEM is underweight for age
- The most practical detection tool for field health workers is maintaining growth charts
- These indicate at a glance whether a child is gaining or losing weight, and whether they are on track
Method 3: Laboratory and Biochemical Assessment
(a) Laboratory Tests
| Test | Significance |
|---|---|
| Haemoglobin estimation | Most important; useful index of overall nutritional status and anaemia |
| RBC count and haematocrit | Anaemia assessment |
| Stool examination | Intestinal parasites (contribute to malnutrition) |
| Urine for albumin and sugar | Protein loss, diabetes mellitus |
(b) Biochemical Tests
With increasing knowledge of metabolic functions of vitamins and minerals, biochemical tests have become more precise. They can:
- Measure individual nutrient concentration in body fluids (e.g., serum retinol, serum iron)
- Detect abnormal metabolites in urine (e.g., urinary iodine) after a loading dose
- Measure enzymes where the vitamin is a co-factor (e.g., in riboflavin deficiency)
- Help establish malnutrition in its pre-clinical stages
Biochemical Tests Used in Nutrition Surveys (Table 33, Park's):
| Nutrient | Method | Normal Value |
|---|---|---|
| Vitamin A | Serum retinol | 20 mcg/dl |
| Thiamine (B1) | TPP stimulation of RBC transketolase activity | 1.00-1.23 (ratio) |
| Riboflavin (B2) | RBC glutathione reductase stimulated by FAD | 1.0-1.2 (ratio) |
| Niacin | Urine N-methyl nicotinamide | (not very reliable) |
| Folate | Serum folate | 6.0 mcg/ml |
| Red cell folate | 160 mcg/ml | |
| Vitamin B12 | Serum vitamin B12 | 160 mg/L |
| Vitamin C | Leucocyte ascorbic acid | 15 mcg/10⁹ cells |
| Vitamin K | Prothrombin time | 11-16 seconds |
| Protein | Serum albumin | 35 g/L |
| Transferrin | 20 g/L | |
| Thyroid-binding pre-albumin | 250 mg/L |
Limitations of biochemical tests:
- Cannot be applied on a large scale to assess a whole community
- Often carried out on a sub-sample of the population
- Most tests reveal only current nutritional status
- Useful to quantify mild deficiencies
- Best used to prove or disprove questions raised by clinical examination
Method 4: Functional Indicators
Static indices (biochemical indicators) are well-established, but functional indices are emerging as an important class of diagnostic tools. They measure how nutrition affects the functioning of organ systems:
| System | Nutrient Involved | Functional Test |
|---|---|---|
| Structural integrity | ||
| Erythrocyte fragility | Vitamin E, Selenium | |
| Capillary fragility | Vitamin C | Rumpel-Leede test |
| Tensile strength | Copper | |
| Immune function | ||
| Lymphocyte response | Protein, Zinc | Skin test response |
| Haematological | Iron, B12, Folate | Work capacity tests |
| Neurological | Thiamine, B12 | Nerve conduction, cognitive tests |
| Work capacity | Energy, Iron | Maximal oxygen uptake |
| Dark adaptation | Vitamin A | Scotopic vision test |
Functional indicators demonstrate the real-world consequences of nutritional deficiency - impaired immunity, reduced work capacity, slowed dark adaptation, and impaired cognition - often before frank clinical signs appear.
Method 5: Assessment of Dietary Intake
The value of nutritional assessment is greatly enhanced when supplemented by assessment of food consumption. Direct assessment involves dietary surveys, which may be household inquiries or individual food consumption surveys.
Diet Survey Methods:
(i) Weighment of Raw Foods
- Most widely employed method in India
- Considered fairly accurate if properly carried out
- Survey team visits households and weighs all food going to be cooked/eaten plus waste
- Duration: 1 to 21 days; commonly 7 days ("one dietary cycle")
(ii) Weighment of Cooked Foods
- Foods analyzed in the state in which they are normally consumed
- More accurate nutritionally but not easily acceptable to the community
(iii) Oral Questionnaire Method (24-hour Recall)
- Useful for large population surveys in a short time
- Retrospective inquiry about food eaten in the previous 24 or 48 hours
- If properly carried out, gives reliable results
- Also collects data on dietary habits and practices
Data Translation:
Survey data is converted to:
- Mean intake (grams) of each food group: cereals, pulses, vegetables, fruits, milk, meat, fish, eggs
- Mean nutrient intake per adult man value or "consumption unit"
This analysis requires food composition tables - in India, the ICMR publication "Nutritive Value of Indian Foods" is the standard guide.
What Dietary Assessment Provides:
- Dietary intake patterns and specific foods consumed
- Estimated nutrient intakes
- Relative dietary inadequacies
- Basis for health education activities
- Information for changes needed in agriculture and food production industries
Method 6: Vital Statistics
An analysis of vital statistics (mortality and morbidity data) identifies groups at high risk and indicates the extent of nutritional risk to the community.
Key vital statistics used:
| Statistic | Nutritional Relevance |
|---|---|
| 1-4 year mortality rate | Most sensitive indicator - closely linked to malnutrition; in developing countries may be 20x higher than in developed countries |
| Infant Mortality Rate (IMR) | Reflects maternal and infant nutritional status |
| Second-year mortality rate | Sensitive to PEM (weaning period) |
| Low birth weight rate | Reflects maternal malnutrition |
| Life expectancy | Influenced by overall nutritional status |
Morbidity data from hospital records or community surveys relating to:
- Protein-energy malnutrition, anaemia, xerophthalmia
- Other vitamin deficiencies, endemic goitre
- Diarrhoea, measles, parasitic infestations
...all contribute additional information about community nutritional status.
Limitation: Mortality data alone does not provide a satisfactory picture of the nutritional status of a population.
Method 7: Assessment of Ecological Factors
Malnutrition is the end result of many interacting ecological factors. In any nutrition survey, it is necessary to collect ecological information about the community to make the assessment complete.
Components of Ecological Study:
(a) Food Balance Sheet
- An indirect method of assessing food consumption at the national/regional level
- Food supplies related to census population to derive levels of food consumption
- Gives per capita availability of food and nutrients at population level
- Detects food shortages at the macro level
(b) Agricultural and Economic Data
- Land use, crop yields, food production and storage
- Market prices, purchasing power of the population
- Seasonal variation in food supply
(c) Social and Cultural Factors
- Food habits, taboos, beliefs, and traditions
- Cultural practices around child feeding and weaning
- Social prestige of certain foods
(d) Health and Sanitation Data
- Prevalence of infections (diarrhoea, parasites, TB, measles)
- Safe water and sanitation coverage
- Health service utilization
5. Community Nutrition Surveillance Indicators
A practical summary of indicators used for ongoing community nutrition surveillance:
| Life Stage | Indicator | How Measured |
|---|---|---|
| Maternal | Birth weight | Weighing newborns |
| Infants (0-11 months) | Breastfeeding rate; weaning food introduction | Survey questionnaire |
| Preschool children (1-5 yrs) | Mortality in 1, 2, 3, 4 year olds (emphasis on 2-year-olds); height for age; weight for age (if age known); weight for height; arm circumference; clinical signs (if age unknown) | Growth monitoring, MUAC |
| School children | Height for age; weight for height at 7 years or school admission; clinical signs | School health screening |
| Adolescents | BMI for age; haemoglobin | Screening programmes |
| Adults | BMI; haemoglobin; serum retinol | Community surveys |
| Community level | IMR; U5MR; 1-4 year mortality rate | Vital statistics |
6. Summary: Integrated Approach
The WHO Expert Committee and Park's textbook both emphasize that no single method of nutritional assessment is sufficient. A multi-method approach is essential:
| Method | Stage Detected | Setting |
|---|---|---|
| Food balance sheets / Dietary surveys | Earliest - prepathogenic | National, community |
| Biochemical tests | Pre-clinical (subclinical deficiency) | Sub-sample surveys |
| Functional indicators | Pre-clinical to early clinical | Sub-sample surveys |
| Anthropometry | Clinical (measurable physical changes) | Community, field |
| Clinical examination | Established deficiency disease | Community, clinical |
| Vital statistics | Advanced disease and death | National, district |
| Ecological assessment | Root causes | Macro level |
The ideal nutritional assessment combines:
- Rapid screening (growth charts, MUAC, haemoglobin)
- Targeted biochemical testing on high-risk sub-samples
- Dietary surveys to understand intake patterns
- Ecological analysis to address root causes
- Vital statistics for programme monitoring and evaluation
This comprehensive approach allows community medicine practitioners to detect malnutrition at the earliest possible stage, target interventions where they are most needed, and evaluate whether nutritional programmes are achieving their objectives.
Source: Park's Textbook of Preventive and Social Medicine, Chapter on Nutrition (Community Medicine standard reference)
This is a shared conversation. Sign in to Orris to start your own chat.