
Diclofenac explain in detail
diclofenac pharmacology clinical use
diclofenac NSAID mechanism of action COX inhibition prostaglandin pathway
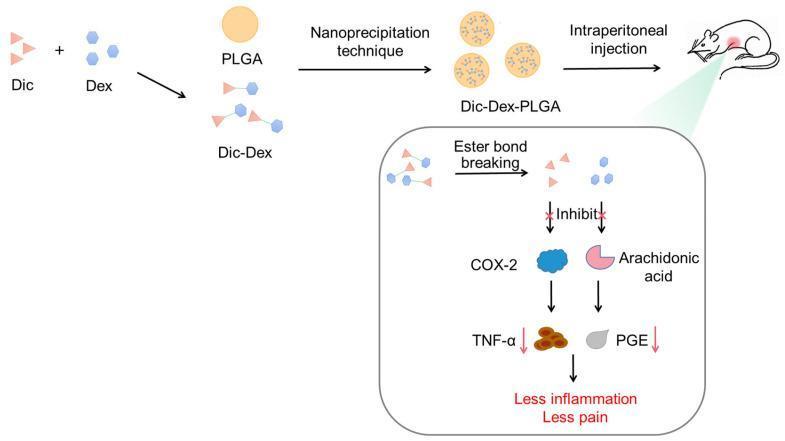
This pathophysiology diagram illustrates the development and mechanism of a drug co-delivery system using poly(lactic-co-glycolic acid) (PLGA) nanoparticles for pain and inflammation management. The flowchart details the formulation process where diclofenac (Dic) and dexamethasone (Dex) are combined to form a Dic-Dex complex, which is then encapsulated into PLGA nanoparticles via nanoprecipitation. The resulting Dic-Dex-PLGA nanoparticles are administered through intraperitoneal injection, as demonstrated in a murine model. An inset diagram explains the in vivo pharmacological mechanism: the breaking of ester bonds releases the active Dic and Dex molecules, which subsequently inhibit cyclooxygenase-2 (COX-2) and arachidonic acid pathways. This molecular inhibition leads to a downregulation of pro-inflammatory mediators, specifically tumor necrosis factor-alpha (TNF-̑) and prostaglandin E (PGE), culminating in the clinical outcomes of reduced inflammation and pain relief. The diagram highlights the educational focus on nanotechnology-based drug delivery systems and the synergistic effects of combining nonsteroidal anti-inflammatory drugs (NSAIDs) with corticosteroids.
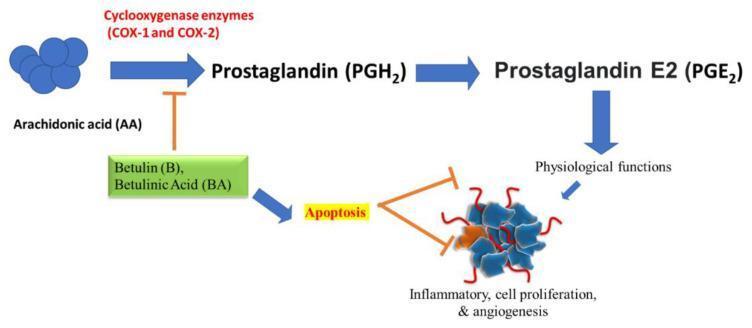
A pathophysiology diagram illustrating the molecular signaling pathway of arachidonic acid (AA) metabolism and its modulation by the natural compounds Betulin (B) and Betulinic Acid (BA). The primary pathway shows AA converting to Prostaglandin (PGH2) via Cyclooxygenase enzymes (COX-1 and COX-2), which is further metabolized into Prostaglandin E2 (PGE2). PGE2 is shown to mediate physiological functions. The educational focus of the diagram is the anti-inflammatory and anti-cancer mechanism of Betulin and Betulinic Acid. These compounds are depicted inhibiting the conversion of AA to PGH2 (indicated by a brown T-bar inhibitory symbol). Additionally, Betulin and Betulinic Acid are shown promoting apoptosis. This induced apoptosis subsequently inhibits downstream pathological processes including inflammation, cell proliferation, and angiogenesis (depicted as a complex cluster with red vascular-like tendrils). The diagram effectively visualizes how triterpenoids can interfere with the COX-2-mediated prostaglandin pathway to arrest tumor growth and reduce inflammatory responses.
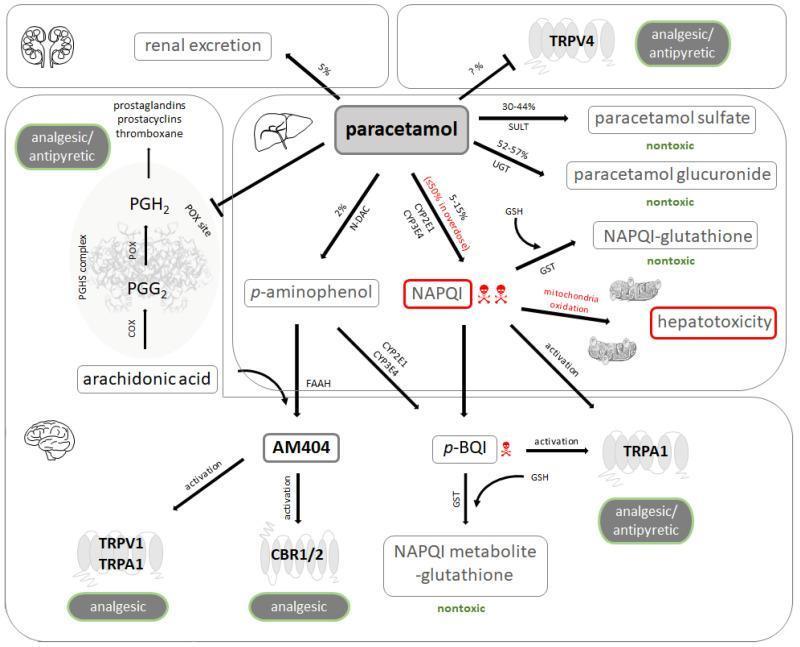
A comprehensive pharmacology and pathophysiology diagram illustrating the metabolic pathways and mechanism of action of paracetamol (acetaminophen). The schematic details three primary metabolic routes in the liver: glucuronidation (via UGT) and sulfation (via SULT) producing nontoxic metabolites for renal excretion, and a cytochrome P450-mediated pathway (CYP2E1, CYP3A4) forming the toxic intermediate N-acetyl-p-benzoquinone-imine (NAPQI). It depicts the detoxification of NAPQI by glutathione (GSH) and the adverse effects of excessive NAPQI, including mitochondrial oxidation and hepatotoxicity. The diagram also shows the N-deacetylation of paracetamol to p-aminophenol, leading to the formation of AM404, which activates TRPV1, TRPA1, and CBR1/2 receptors to provide analgesia. Furthermore, it illustrates the inhibition of the prostaglandin endoperoxide H synthase (PGHS) complex at the peroxidase (POX) site, preventing the conversion of PGG2 to PGH2, thereby explaining the drug's antipyretic and analgesic effects. Target receptors such as TRPV4 are also noted as potential sites of pharmacological interaction.
NSAID structure phenylacetic acid chemical structure diclofenac
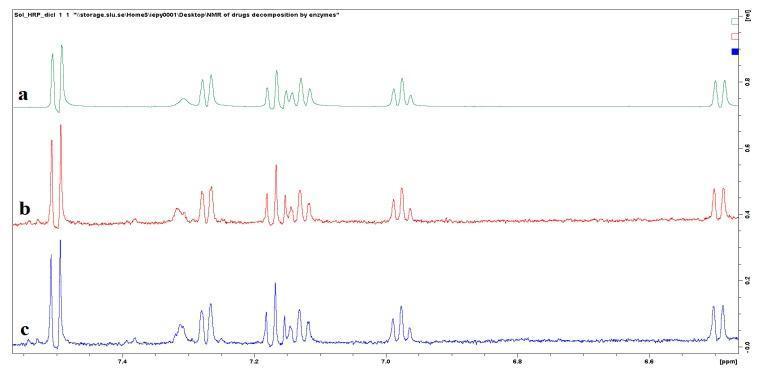
This Comparison Chart displays three 1H nuclear magnetic resonance (NMR) spectra illustrating the metabolic transformation of diclofenac, a nonsteroidal anti-inflammatory drug (NSAID), at pH 5.0. Spectrum (a), shown in green, represents the initial diclofenac control with characteristic aromatic proton signals between 6.5 and 7.6 ppm. Spectrum (b), in red, shows diclofenac after interaction with sol-gel encapsulated Lignin Peroxidase (LiP). Spectrum (c), in blue, shows the result after interaction with sol-gel encapsulated Horseradish Peroxidase (HRP). The comparative analysis highlights the appearance of new, low-intensity 'artifact' peaks between 7.3–7.4 ppm and at 7.55 ppm in spectra (b) and (c). These spectral changes indicate the enzymatic formation of hydroxy-substituted derivatives and metabolites. The diagnostic focus is on evaluating the efficacy of enzymatic composites for pharmacological waste removal and metabolic profiling. The graphic demonstrates key concepts in pharmacology and medicinal chemistry, specifically the oxidative degradation pathways of drugs by peroxidase enzymes.
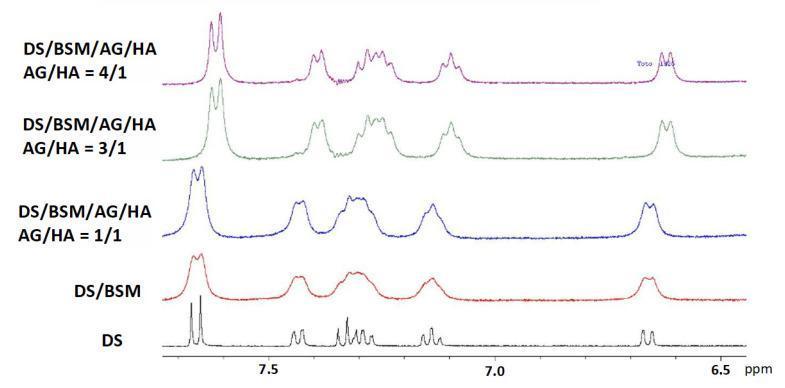
This diagnostic graphic displays five stacked 1H-NMR (Proton Nuclear Magnetic Resonance) spectra in the chemical shift range of 6.5–8 ppm, illustrating molecular interactions between the anti-inflammatory drug diclofenac sodium (DS), bovine submaxillary mucin (BSM), and two polysaccharides: arabinogalactan (AG) and hyaluronic acid (HA). The bottom spectrum (black line) shows pure DS with sharp, well-resolved multi-peak signals. The second spectrum (red line, DS/BSM) demonstrates significant peak broadening and decreased resolution, indicating DS immobilization via mucin interaction. The third spectrum (blue line, quaternary mixture AG/HA = 1/1) shows further broadening. In contrast, the top two spectra (green and purple lines, representing AG/HA ratios of 3/1 and 4/1) exhibit progressive peak sharpening and resolution recovery. This visual data evaluates the mucoadhesive properties and displacement capacity of AG/HA mixtures for ophthalmic drug delivery systems, specifically for treating dry eye syndrome. The sharpening of the DS peaks at higher AG ratios suggests that the polysaccharide mixture effectively displaces the drug from mucin, increasing the free drug fraction.
Diclofenac - Comprehensive Overview
1. Chemical Classification
2. Mechanism of Action
celecoxib = diclofenac = meloxicam = etodolac < valdecoxib < rofecoxib < lumiracoxib
- Inhibition of phospholipase A2 activity (reduces arachidonic acid release)
- Possible activation of the endocannabinoid system
- Some evidence for inhibition of lipoxygenase pathway at higher concentrations
3. Pharmacokinetics (ADME)
| Parameter | Details |
|---|---|
| Absorption | Rapidly absorbed after oral administration |
| Protein binding | Extensive (>99%), primarily albumin |
| Half-life (t½) | 1-2 hours (short) |
| Bioavailability | ~50% due to substantial first-pass hepatic metabolism |
| Distribution | Accumulates in synovial fluid after oral administration - this explains why therapeutic duration exceeds plasma t½ |
| Metabolism | Liver via CYP2C subfamily → principal metabolite: 4-hydroxydiclofenac → further glucuronidation and sulfation |
| Excretion | Urine 65%, bile 35% |
- Early phase of dosing interval: both COX-1 and COX-2 are inhibited (high plasma levels)
- Late phase of dosing interval: behaves more like a selective COX-2 inhibitor (declining plasma levels)
4. Therapeutic Uses
Musculoskeletal / Inflammatory
- Rheumatoid arthritis (long-term symptomatic treatment)
- Osteoarthritis
- Ankylosing spondylitis
Pain
- Acute and chronic pain (various formulations)
- Primary dysmenorrhea
- Acute migraine (oral powder solution, IV injection)
- Postoperative pain (ophthalmic solution after cataract surgery)
Dermatological
- Actinic keratosis (3% topical gel - Solaraze)
Other
- Photophobia after corneal refractive surgery (ophthalmic drops)
- Available combined with misoprostol (a PGE1 analogue) to reduce GI ulcer risk while retaining efficacy
5. Available Formulations
| Formulation | Route | Use |
|---|---|---|
| Enteric-coated tablets (50 mg, 75 mg) | Oral | Arthritis, pain |
| Extended-release tablets | Oral | Chronic arthritis |
| Powder for oral solution | Oral | Acute migraine |
| IV injection | Intravenous | Acute severe pain |
| 1% topical gel | Topical | Minor sprains, strains |
| Transdermal patch | Topical | Localized pain |
| 3% gel (Solaraze) | Topical | Actinic keratosis |
| Ophthalmic solution | Ocular | Post-surgical inflammation |
| Diclofenac + misoprostol | Oral | GI-protective combination |
6. Adverse Effects
Gastrointestinal (Most Common)
- Side effects in approximately 20% of patients
- GI ulcers, erosions, bleeding
- Risk of serious GI events is similar to COX-2-selective inhibitors
- Combination with misoprostol reduces GI mucosal injury
Cardiovascular
- Diclofenac increases major vascular events (nonfatal MI, nonfatal stroke, vascular death) by approximately 40%, driven mainly by a ~75% increase in major coronary events
- Vascular death increased by ~60% with diclofenac (similar to coxibs, unlike naproxen which does NOT significantly increase vascular risk)
- This cardiovascular risk profile is shared with COX-2-selective inhibitors
Hepatotoxicity (Distinctive Feature)
- Severe liver injury in 6-11 per 100,000 regular users annually
- Elevation of hepatic transaminases >3× upper limit of normal in ~4% of patients
- Transaminases must be monitored during the first 8 weeks of therapy
- Mechanism involves two reactive metabolites:
- 4'-hydroxydiclofenac → forms reactive benzoquinone imines (similar to NAPQI from acetaminophen) → depletes hepatic glutathione (GSH)
- Diclofenac acyl glucuronide (formed via UGT2B7) → highly reactive metabolite
- Genetic variation causing higher UGT2B7 activity is associated with increased hepatotoxicity risk
Renal
- Fluid retention and edema
- Renal function impairment (decreased GFR by reducing prostaglandin-mediated renal perfusion)
CNS
- Dizziness, headache, drowsiness
Hypersensitivity
- Skin rashes; reactions can occur with both topical and systemic administration
Contraindications / Not Recommended
- Children
- Nursing mothers
- Pregnant women (especially third trimester - premature closure of ductus arteriosus)
- Patients with established cardiovascular disease or high CV risk (relative)
- Pre-existing hepatic disease
7. Drug Interactions
| Interacting Drug/Class | Mechanism & Effect |
|---|---|
| Warfarin / anticoagulants | Displacement from protein binding + inhibition of platelet aggregation → increased bleeding risk |
| Lithium | Reduced renal lithium clearance → lithium toxicity |
| Methotrexate | Reduced renal tubular secretion → methotrexate toxicity |
| ACE inhibitors / ARBs | Blunted antihypertensive effect; increased risk of acute kidney injury |
| Diuretics | Reduced natriuretic effect; hyperkalemia risk |
| Other NSAIDs / aspirin | Increased GI risk; diclofenac may compete with aspirin for COX-1 binding |
| CYP2C9 inhibitors | Reduced metabolism → elevated diclofenac levels |
8. COX Selectivity - Clinical Significance
- Reduced GI mucosal damage compared to non-selective NSAIDs like indomethacin
- Higher cardiovascular risk (similar to celecoxib, unlike naproxen)
- The COX-2 selectivity does NOT provide GI safety equivalent to coxibs unless combined with a PPI or misoprostol
- However, COX-2 selectivity reduces COX-1-mediated platelet inhibition - meaning diclofenac does not provide the antiplatelet protection of aspirin
9. Special Populations
| Population | Consideration |
|---|---|
| Elderly | Increased GI, CV, and renal risk; use lowest effective dose |
| Renal impairment | Avoid or use with caution; risk of acute kidney injury |
| Hepatic impairment | Avoid; diclofenac itself is hepatotoxic |
| Pregnancy | Avoid (especially 3rd trimester); premature ductus closure |
| Breastfeeding | Not recommended |
| Children | Not recommended |
10. Comparison with Other NSAIDs
| Feature | Diclofenac | Ibuprofen | Naproxen | Celecoxib |
|---|---|---|---|---|
| COX-2 selectivity | Moderate | Low | Low | High |
| GI risk | Moderate | Moderate | Moderate | Lower |
| CV risk | High (40% ↑) | Moderate | Low | High |
| Hepatotoxicity | Distinctive high risk | Low | Low | Low |
| t½ | 1-2 h | 2 h | 12-17 h | 11 h |
| Renal risk | Moderate | Moderate | Moderate | Moderate |
11. Summary
- Goodman & Gilman's Pharmacological Basis of Therapeutics, Acetic Acid Derivatives, p. 861
- Rheumatology 2-Volume Set (2022, Elsevier) - COX selectivity and cardiovascular events chapters
- Goldman-Cecil Medicine - Hepatocellular hepatitis due to diclofenac