
Hello
See iam a third year mbbs students appearing for final exams in following 28 days So when ever I ask question and mention marks give answers in such a way that i can get good marks For spm - refer park and cia with diagrams tabular forms wherever necessary Fmt- Narayan Reddy and mudabbir
- Primary reference: Park's Textbook of PSM + CIA (Community & Investigative approaches)
- Answers will include:
- Diagrams wherever relevant
- Tabular comparisons
- Definitions, classifications, and exam-ready points
- Mnemonics when helpful
- Primary reference: Narayan Reddy + Mudabbir
- Answers will include:
- Medicolegal points highlighted
- Important definitions
- Diagrams (wound patterns, instruments, etc.)
- High-yield exam points
- Structure answers with headings and subheadings
- Lead with a definition when applicable
- Use tables for comparisons and classifications
- Add diagrams/flowcharts in text form where visual aids help
- Highlight high-yield exam points
Define balanced diet Proximal principles of nutrition Enumerate the major nutritional problems in india What are the components of nutritional assessment Describe how will you conduct nutritional assessment in a community 20 marks long note
NUTRITION - BALANCED DIET, PROXIMATE PRINCIPLES, NUTRITIONAL PROBLEMS & ASSESSMENT
(20 Marks | Ref: Park's Textbook of PSM)
I. DEFINITION OF BALANCED DIET
"One which contains a variety of foods in such quantities and proportions that the need for energy, amino acids, vitamins, minerals, fats, carbohydrates and other nutrients is adequately met for maintaining health, vitality and general well-being, and also makes a small provision for extra nutrients to withstand short duration of leanness." - Park
II. PROXIMATE PRINCIPLES OF NUTRITION
A. Macronutrients ("Proximate Principles")
Proteins, fats, and carbohydrates are often called "proximate principles" because they form the main bulk of food.
| Proximate Principle | Contribution to Daily Energy Intake (Indian Dietary) |
|---|---|
| Proteins | 10 - 15% |
| Fats | 15 - 30% |
| Carbohydrates | 50 - 80% |
1. Proteins
- Complex organic nitrogenous compounds (C, H, O, N, S)
- Constitute ~20% of body weight in adults
- Nitrogen content ~16%
- 9 Essential Amino Acids (EAA): Leucine, Isoleucine, Lysine, Methionine, Phenylalanine, Threonine, Valine, Tryptophan, Histidine
- Mnemonic: "PVT TIM HaLL" - Phenylalanine, Valine, Threonine, Tryptophan, Isoleucine, Methionine, Histidine, Leucine, Lysine
- A protein is "biologically complete" if it contains all EAA (e.g., animal proteins)
2. Fats
- Most concentrated source of energy (9 kcal/g)
- Essential fatty acids (EFA): Linoleic acid, Linolenic acid, Arachidonic acid
- Function: Energy reserve, fat-soluble vitamin carrier (A, D, E, K), cell membrane structure
3. Carbohydrates
- Primary energy source (4 kcal/g)
- Should be rich in natural fibre
- Types: Monosaccharides, Disaccharides, Polysaccharides
B. Micronutrients
- Vitamins (fat-soluble and water-soluble) and Minerals
- Required in small amounts (fraction of mg to several grams)
Principles of Constructing a Balanced Diet:
- First meet protein requirement (10-15% of daily energy)
- Then limit fat to 15-30% of energy
- Carbohydrates rich in natural fibre constitute the remaining energy
- Requirements of micronutrients must be met (as per RDA 2020)
FOOD GUIDE PYRAMID (Park's Fig. 1)
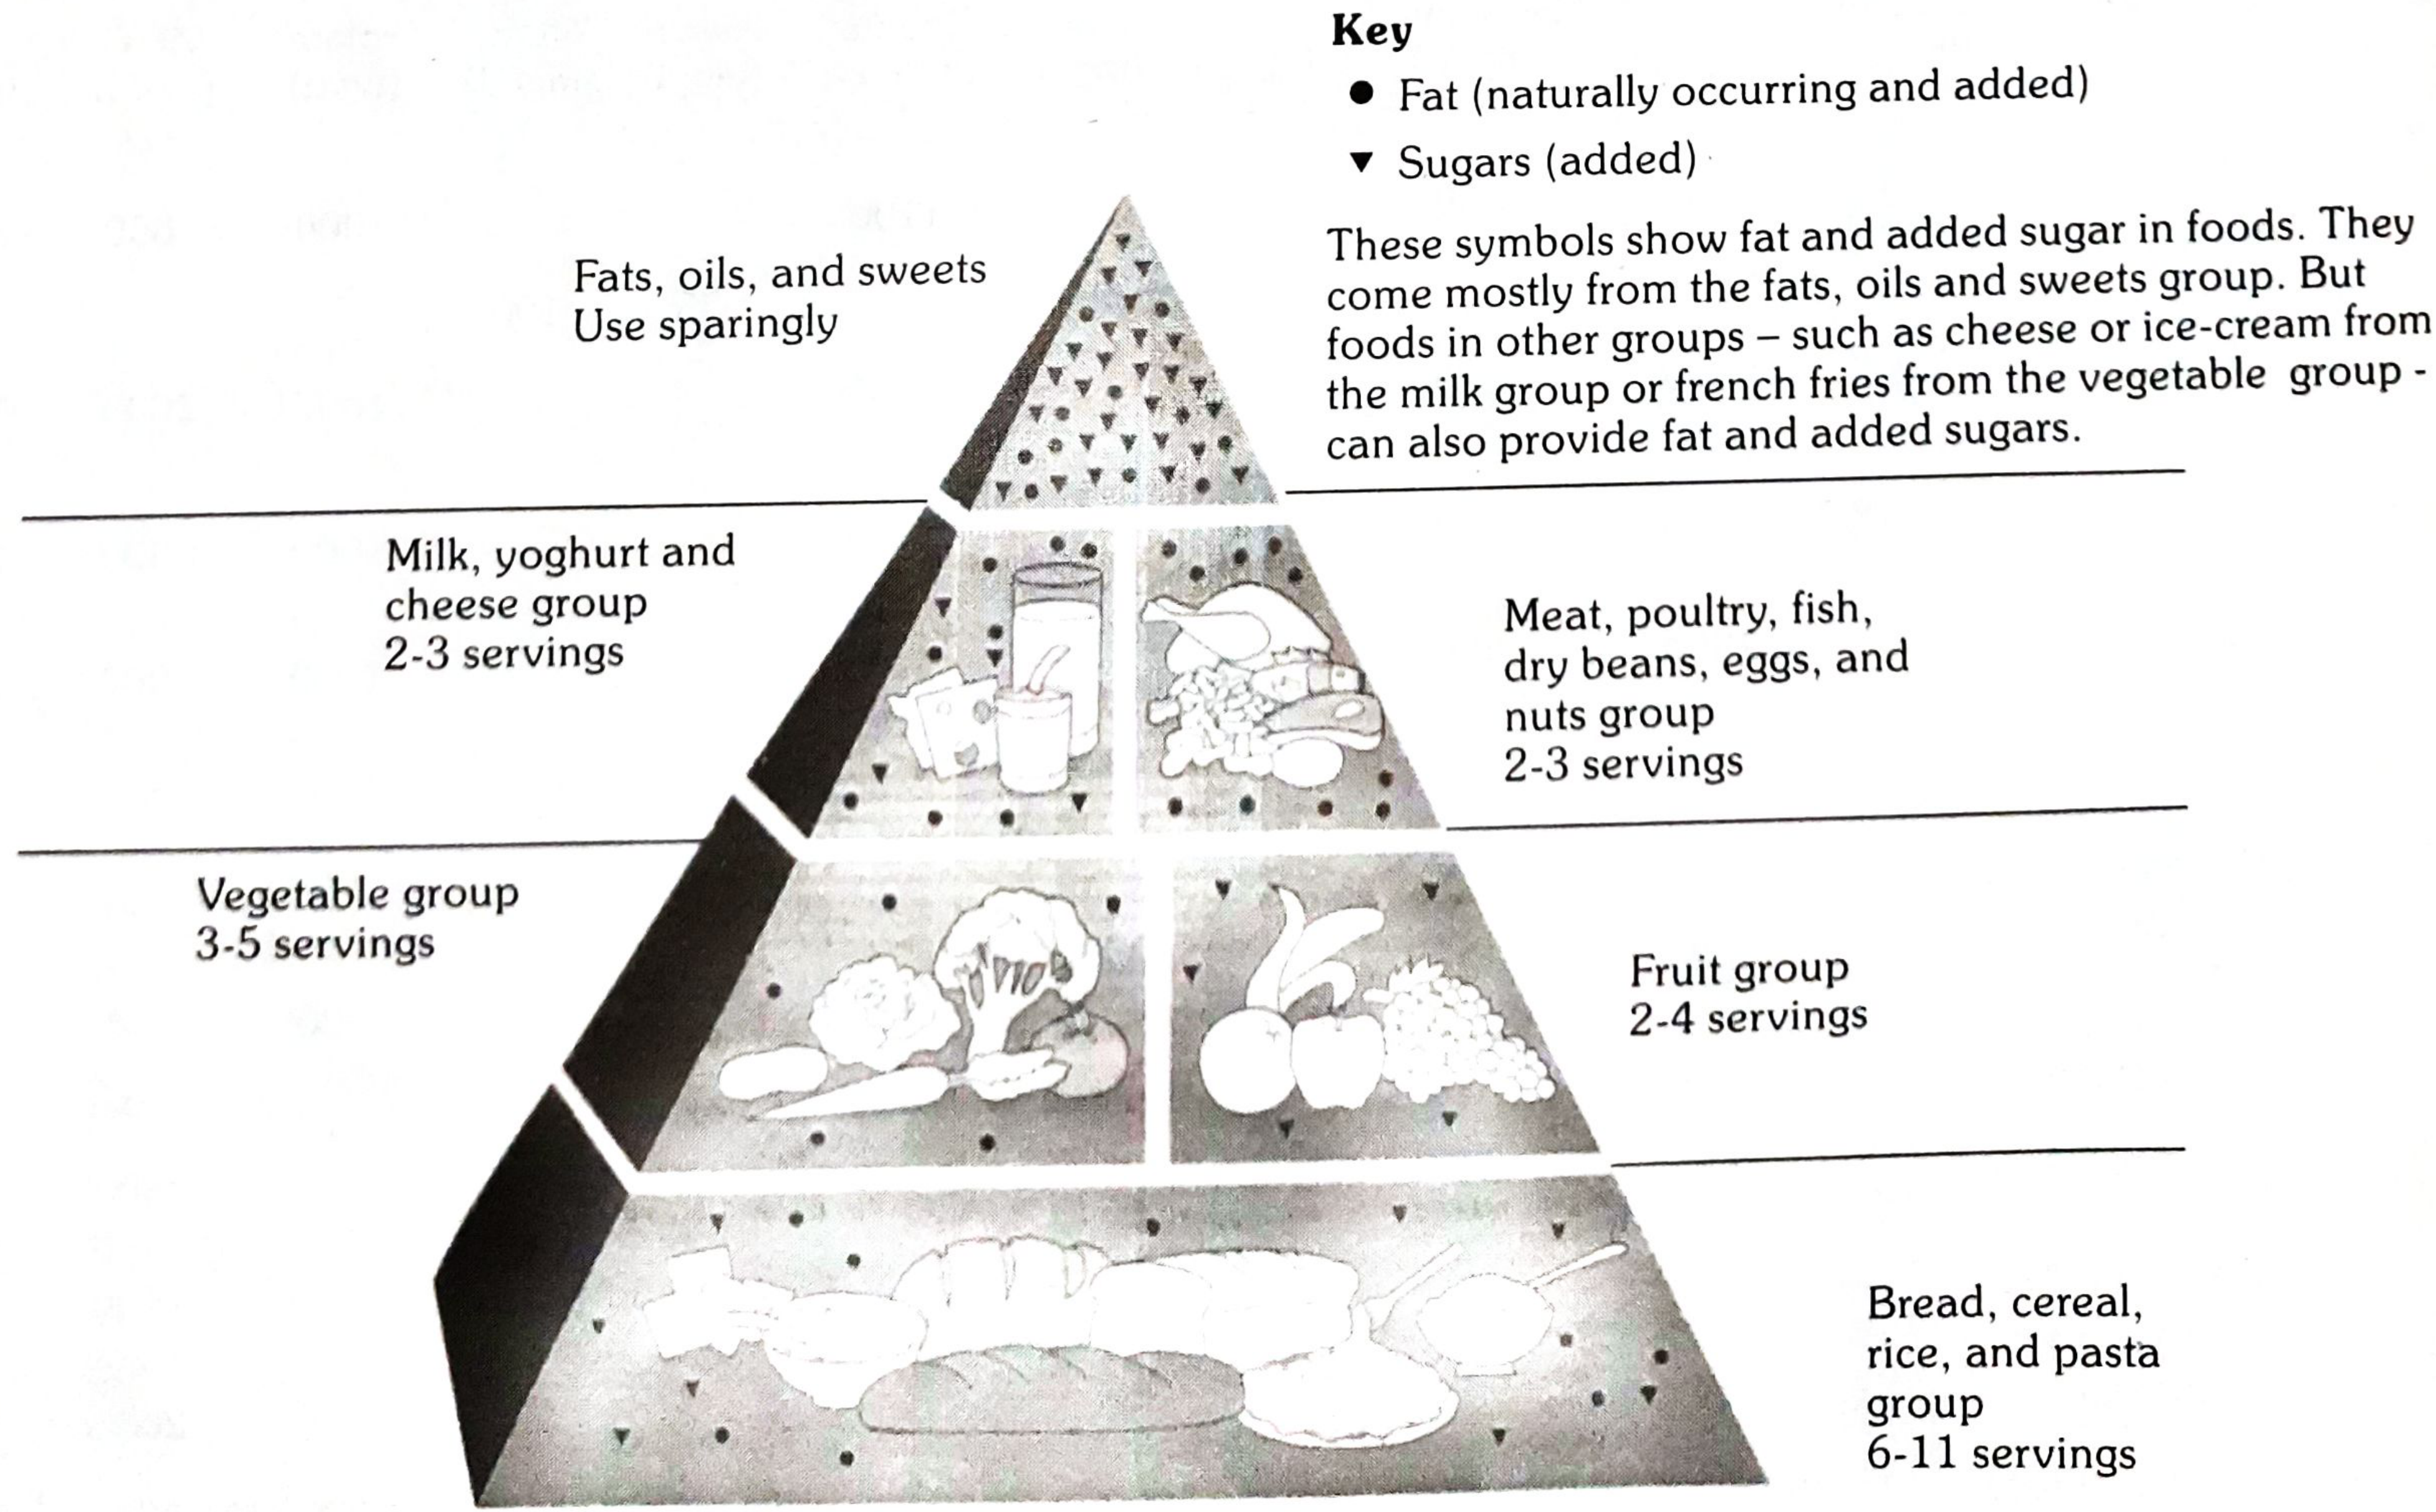
| Level | Food Group | Servings/Day |
|---|---|---|
| Base | Bread, cereal, rice, pasta | 6-11 |
| 2nd | Vegetables | 3-5 |
| 2nd | Fruits | 2-4 |
| 3rd | Milk, yoghurt, cheese | 2-3 |
| 3rd | Meat, poultry, fish, eggs, nuts | 2-3 |
| Apex | Fats, oils, sweets | Use sparingly |
Note: Diet should be adapted to special needs of growth, pregnancy, lactation, physical activity, and medical disorders (e.g., diabetes).
III. MAJOR NUTRITIONAL PROBLEMS IN INDIA
"From the nutritional point of view, the Indian society is a dual society - a small group of well fed and a very large group of undernourished." - Park
| # | Nutritional Problem | Key Facts |
|---|---|---|
| 1 | Protein-Energy Malnutrition (PEM) | "Food gap" is chief cause; 80% are mild-moderate cases; severe cases 1-2% in preschool children; Marasmus > Kwashiorkor |
| 2 | Nutritional Anaemia | India has highest prevalence worldwide; ~50% non-pregnant women + children anaemic; 50.3% pregnant women anaemic; 19% maternal deaths due to anaemia; Iron deficiency is most common cause |
| 3 | Low Birth Weight (LBW) | ~28% of all births in India are LBW (<2.5 kg); caused by maternal malnutrition and anaemia |
| 4 | Xerophthalmia (Nutritional Blindness) | 0.04% of total blindness due to Vitamin A deficiency; Keratomalacia major cause in children 1-3 years |
| 5 | Iodine Deficiency Disorders (IDD) | Endemic in sub-Himalayan regions; 263 out of 324 districts surveyed are endemic (>10% prevalence); >71 million people affected |
| 6 | Others | Lathyrism, endemic fluorosis, widespread food adulteration |
According to NFHS-4: 53.1% women are anaemic; anaemia in children aged 6-59 months is 58.4%
IV. COMPONENTS OF NUTRITIONAL ASSESSMENT
(A) Objectives of Nutritional Assessment:
- Obtain precise information on prevalence and geographic distribution of nutritional problems
- Identify individuals or population groups "at risk"
- Develop health care programmes that meet defined needs
- Evaluate effectiveness of nutrition programmes
(B) Components (Methods) - "CABFVE" mnemonic:
| # | Component | Key Details |
|---|---|---|
| 1 | Clinical Examination | Physical signs of deficiency; standardized survey forms |
| 2 | Anthropometry | Height, weight, skinfold thickness, MUAC, head/chest circumference |
| 3 | Biochemical Evaluation | Hb estimation, serum retinol, urinary iodine, enzyme assays |
| 4 | Functional Assessment | Work capacity, immune function tests |
| 5 | Vital and Health Statistics | Mortality data, morbidity records, infant mortality rate |
| 6 | Ecological Studies | Food balance sheets, socioeconomic factors |
| + | Dietary Intake Assessment | 24-hr recall, food frequency questionnaire, weighed dietary record |
V. CONDUCTING NUTRITIONAL ASSESSMENT IN A COMMUNITY
Step 1: Planning the Survey
- Define objectives clearly
- Decide type of survey: Cross-sectional OR Longitudinal
- Plan sampling: Random and representative sample covering all ages, both sexes, different socio-economic groups
- Seek expert statistical advice
- Decide duration and standardization of measurement techniques
"It is not necessary to examine all persons in a given community." - Park
Step 2: Clinical Examination
- Systematic head-to-toe examination using standardized survey forms (Annexure I schedule)
- Look for physical signs of nutritional deficiency
| Category | Signs |
|---|---|
| Not related to nutrition | Alopecia, pyorrhoea, pterygium |
| Need further investigation | Malar pigmentation, corneal vascularization, geographic tongue |
| Known to be of value | Angular stomatitis, Bitot's spots, calf tenderness, absent knee/ankle jerks (Beri-beri), thyroid enlargement (Goitre) |
- Malnutrition cannot be quantified
- Many deficiencies have no physical signs
- Lack of specificity and subjective nature
Step 3: Anthropometric Measurements
| Measurement | Use |
|---|---|
| Weight & Height | BMI calculation; growth monitoring |
| Skinfold thickness | Body fat estimation |
| Mid-Upper Arm Circumference (MUAC) | PEM screening in children |
| Head circumference | Brain growth in children <2 yrs |
| Chest circumference | Nutritional status in infants |
| BMI (kg/m²) | Category |
|---|---|
| <18.5 | Underweight |
| 18.5-24.9 | Normal |
| 25-29.9 | Overweight |
| ≥30 | Obese |
Step 4: Biochemical/Laboratory Assessment
- Haemoglobin estimation - most important test in nutrition surveys
- RBC count and haematocrit
- Stool examination - for intestinal parasites
- Urine - for albumin, sugar
- Serum retinol (Vitamin A status)
- Serum iron / Serum ferritin (Iron stores)
- Urinary iodine (Iodine status)
- Enzyme assays (e.g., erythrocyte glutathione reductase for Riboflavin)
- These detect preclinical (subclinical) malnutrition before clinical signs appear
Step 5: Assessment of Dietary Intake
| Method | Description |
|---|---|
| 24-hour dietary recall | Subject recalls all food consumed in previous 24 hours |
| Food frequency questionnaire | How often specific foods are consumed |
| Weighed dietary record | Actual weighing of food before and after eating |
| Food balance sheets | National-level food availability data |
Step 6: Vital and Health Statistics
- Infant Mortality Rate (IMR)
- Under-5 mortality rate
- Morbidity data from hospitals/PHCs
- Maternal mortality rate
- Growth monitoring data (ICDS registers)
Step 7: Ecological Studies
- Assessment of socioeconomic factors (income, education, occupation)
- Environmental factors (sanitation, water supply)
- Cultural factors (food taboos, feeding practices)
- Agricultural data (food production, availability)
DIAGRAM: Methods of Nutritional Assessment & Natural History of Disease (Park's Fig. 5)
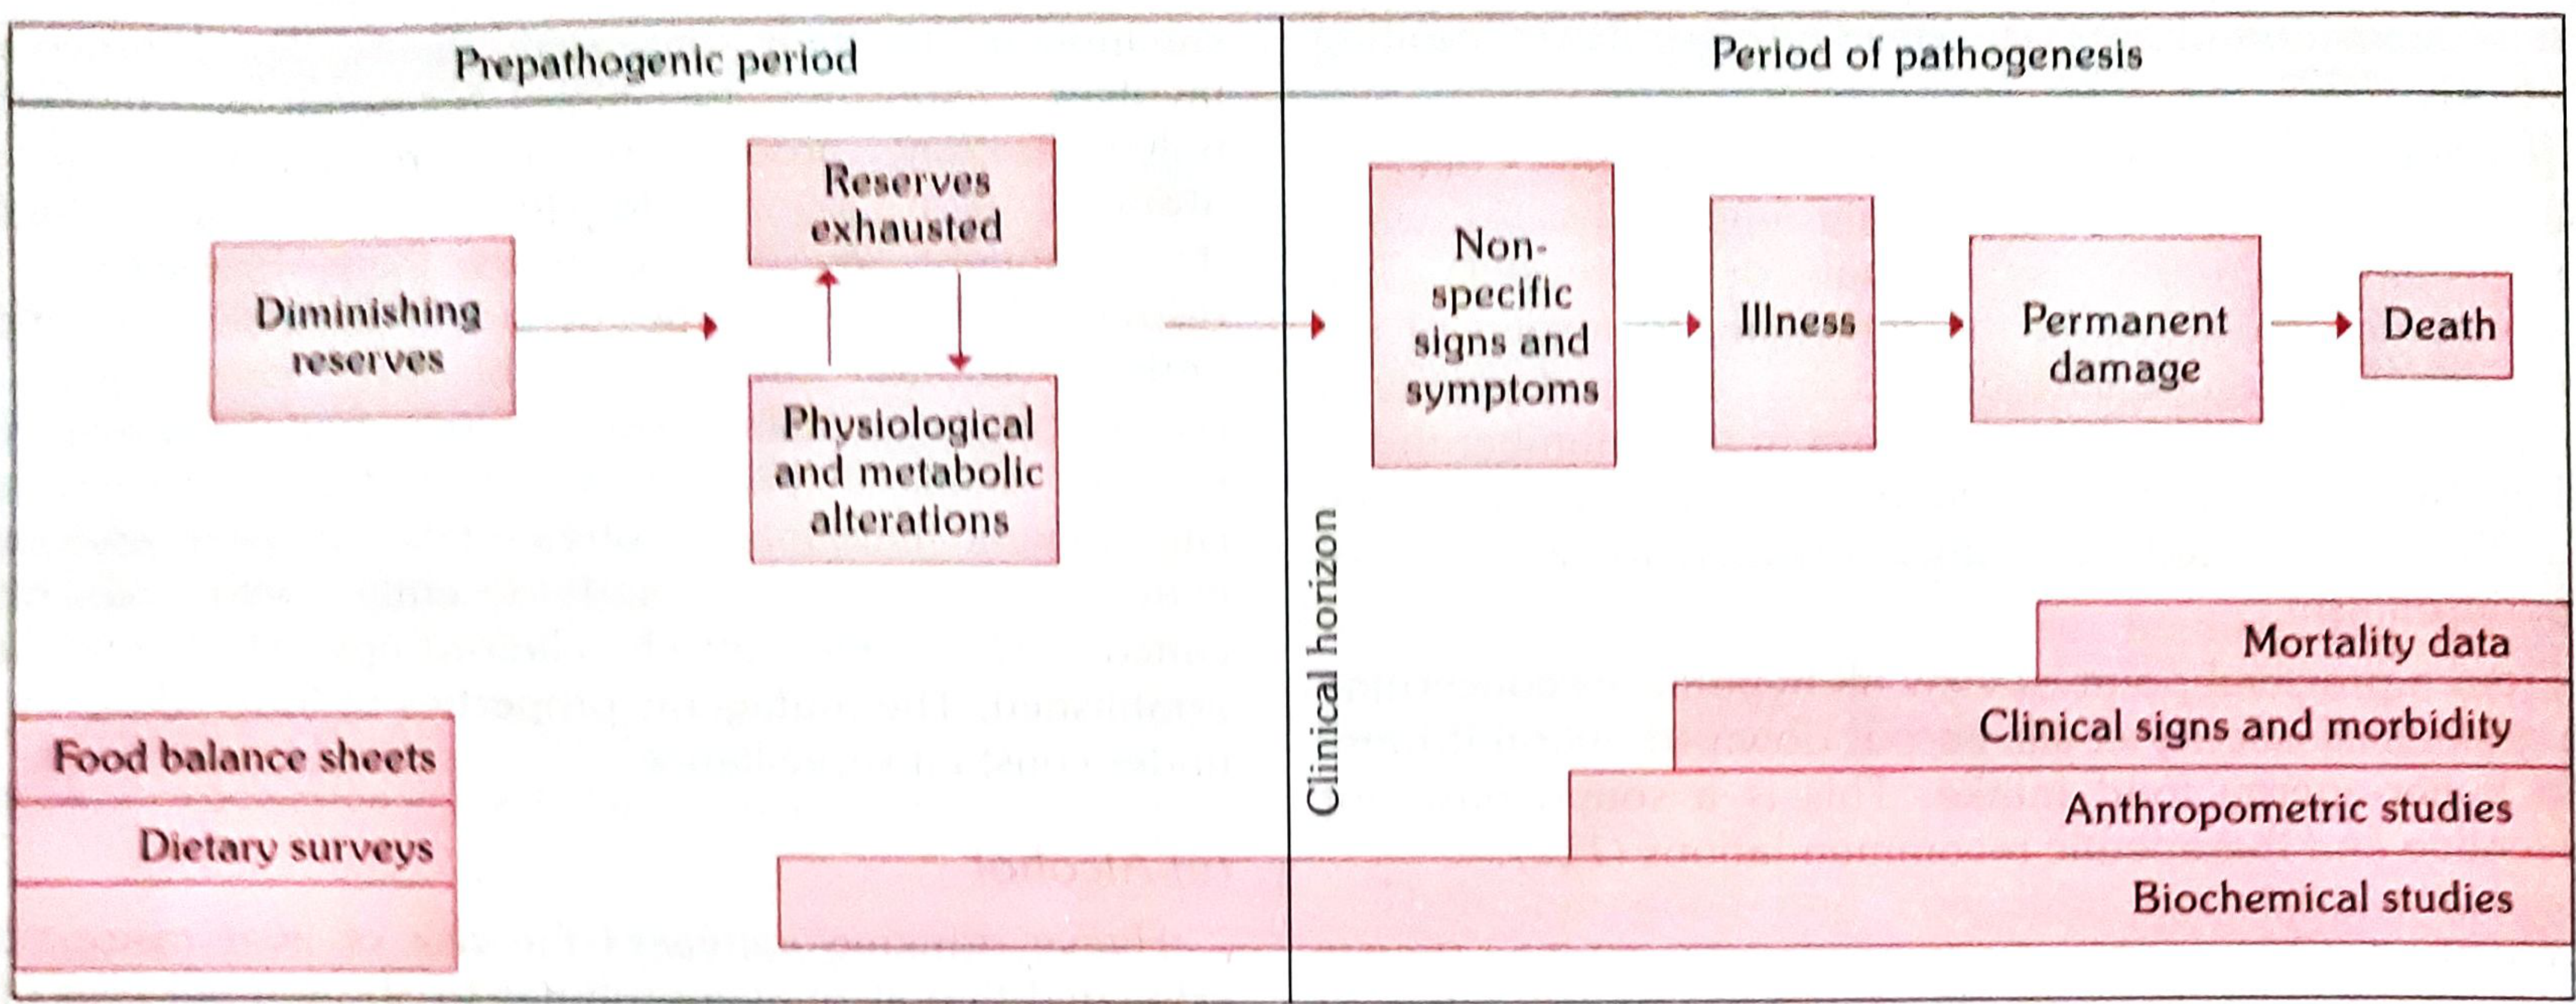
Key concept from diagram: Biochemical studies can detect malnutrition even in the prepathogenic period (before any clinical signs), while clinical signs and mortality data become apparent only after the clinical horizon is crossed.
Summary Flowchart - Community Nutritional Assessment
PLAN SURVEY
(Objectives → Sampling → Statistical design)
↓
CLINICAL EXAMINATION
(Physical signs, standardized schedule)
↓
ANTHROPOMETRY
(Ht, Wt, MUAC, Skinfold, BMI)
↓
BIOCHEMICAL TESTS
(Hb, Serum retinol, Urinary iodine)
↓
DIETARY INTAKE ASSESSMENT
(24-hr recall, FFQ, Weighed record)
↓
VITAL STATISTICS
(IMR, MMR, Morbidity data)
↓
ECOLOGICAL STUDIES
(Socioeconomic, cultural, environmental factors)
↓
ANALYSIS & REPORT
(Identify "at-risk" groups → Plan intervention)
High-Yield Exam Points to Remember:
- Balanced diet = Variety + Adequate quantity + Proportions that meet all nutrient needs + Small provision for lean periods
- Proximate principles = Proteins + Fats + Carbohydrates (macronutrients - main bulk of food)
- Nutritional anaemia = most prevalent nutritional problem in Indian women and children
- Marasmus > Kwashiorkor in India
- Most important lab test in nutrition survey = Haemoglobin estimation
- Biochemical tests detect malnutrition in preclinical stages (before clinical signs)
- "Not all persons need to be examined" - random representative sample is sufficient
Add More points acc to park textbook to nutritional assessment in a community
NUTRITIONAL ASSESSMENT IN A COMMUNITY
(Complete - As per Park's Textbook of PSM)
DEFINITION & OBJECTIVES
- Obtain precise information on prevalence and geographic distribution of nutritional problems
- Identify individuals or population groups "at risk" or in greatest need of assistance
- Formulate policies based on defined problems
- Develop health care programmes that meet assessed needs
- Evaluate effectiveness of ongoing nutrition programmes
PLANNING THE SURVEY
- Duration of the survey
- Type of survey: Cross-sectional OR Longitudinal
- Sampling strategy: Random + representative sample covering:
- All age groups
- Both sexes
- Different socio-economic groups
- Standardization of measurement techniques and survey instruments
- Statistical advice from experts
- Opportunity to conduct an intensive investigation on a sub-sample
"It is not necessary to examine all persons. Examination of a random and representative sample is sufficient to draw valid conclusions." - Park
METHODS OF NUTRITIONAL ASSESSMENT
DIAGRAM: Natural History of Disease & Assessment Methods (Park's Fig. 5)
Key point: Biochemical studies can detect malnutrition even in the prepathogenic period. Clinical signs and mortality data appear only after the clinical horizon is crossed.
1. CLINICAL EXAMINATION
- Systematic head-to-toe examination
- Standardized survey forms/schedules covering all areas of the body (Annexure I)
- Diagnostic significance is greatly enhanced when two or more clinical signs are present simultaneously
| Category | Examples |
|---|---|
| Not related to nutrition | Alopecia, pyorrhoea, pterygium |
| Need further investigation | Malar pigmentation, corneal vascularization, geographic tongue |
| Known to be of value | Angular stomatitis, Bitot's spots, calf tenderness, absent knee/ankle jerks (Beri-beri), thyroid enlargement (Goitre) |
- Malnutrition cannot be quantified by clinical signs
- Many deficiencies are unaccompanied by physical signs
- Lack of specificity and subjective nature of most signs
2. ANTHROPOMETRY
| Measurement | Purpose |
|---|---|
| Height & Weight | BMI; growth monitoring; Gomez/IAP classification of PEM |
| Skinfold thickness | Estimation of body fat |
| Mid-Upper Arm Circumference (MUAC) | Screening for PEM in children; quick field tool |
| Head circumference | Brain growth; children <2 years |
| Chest circumference | Nutritional status in infants |
| Head:Chest circumference ratio | Normal >1 up to 6 months, <1 after 1 year |
Anthropometric data can be collected by non-medical personnel given sufficient training.
| BMI (kg/m²) | Category |
|---|---|
| <18.5 | Underweight |
| 18.5 - 24.9 | Normal |
| 25 - 29.9 | Overweight |
| ≥ 30 | Obese |
3. LABORATORY AND BIOCHEMICAL ASSESSMENT
| Test | Significance |
|---|---|
| Haemoglobin estimation | Most important test in nutrition surveys; index of overall nutrition state |
| RBC count + Haematocrit | Assessment of anaemia |
| Stool examination | Detect intestinal parasites, chronic dysentery |
| Urine examination | Albumin, sugar |
| Nutrient | Test | Normal Value |
|---|---|---|
| Vitamin A | Serum retinol | 20 mcg/dL |
| Thiamine (B1) | TPP stimulation of RBC transketolase | Ratio 1.00-1.23 |
| Riboflavin (B2) | RBC glutathione reductase stimulated by FAD | Ratio 1.0-1.2 |
| Niacin | Urine N-methyl nicotinamide | (not very reliable) |
| Folate | Serum folate / Red cell folate | 6.0 mcg/mL / 160 mcg/mL |
| Vitamin B12 | Serum B12 concentration | 160 mg/L |
| Vitamin C | Leucocyte ascorbic acid | 15 mcg/10⁹ cells |
| Vitamin K | Prothrombin time | 11-16 seconds |
| Protein | Serum albumin | 35 g/L |
| Transferrin | 20 g/L | |
| Thyroid-binding pre-albumin | 250 mg/L | |
| Iron | Serum iron / Serum ferritin | Reflects iron stores |
| Iodine | Urinary iodine | Reflects iodine status |
- Time-consuming and expensive
- Cannot be applied on a large scale to whole community
- Often carried out only on a subsample of the population
- Most biochemical tests reveal only current nutritional status
- If clinical examination raises a question, biochemical tests may be invoked to prove or disprove it
4. FUNCTIONAL INDICATORS
| System | Test | Nutrient Involved |
|---|---|---|
| Structural integrity | Erythrocyte fragility | Vit E, Se |
| Capillary fragility | Vit C | |
| Tensile strength | Copper (Cu) | |
| Host defence (Immunity) | Leucocyte chemotaxis | Protein/Energy, Zn |
| Leucocyte phagocytic capacity | P/E, Fe | |
| Leucocyte bactericidal capacity | P/E, Fe, Se | |
| T cell blastogenesis | P/E, Zn | |
| Delayed cutaneous hypersensitivity (DCH) | P/E, Zn | |
| Haemostasis | Prothrombin time | Vit K |
| Reproduction | Sperm count | Energy, Zn |
| Nerve function | Nerve conduction velocity | P/E, Vit B1, B12 |
| Dark adaptation | Vit A, Zn | |
| EEG | P/E | |
| Work capacity | Heart rate | P/E, Fe |
| Vasopressor response | Vit C |
5. ASSESSMENT OF DIETARY INTAKE
| Method | Description | Use |
|---|---|---|
| Weighment of Raw Foods | Survey team visits households; weighs all food to be cooked + waste; 7-day "dietary cycle" | Widely used in India; fairly accurate |
| Weighment of Cooked Foods | Foods analyzed in state normally consumed | More accurate but not easily acceptable |
| Oral Questionnaire (24-hr recall) | Retrospective inquiry about food eaten in previous 24-48 hours | Large populations; quick |
- Mean intake (grams) of food in terms of cereals, pulses, etc.
- Nutritive value (energy, protein, fat, vitamins, minerals) - using ICMR's "Nutritive Value of Indian Foods" publication
- Comparison with Recommended Dietary Allowances (RDA) to identify dietary inadequacies
- Identifies dietary inadequacies against present standards
- Valuable for planning health education activities
- Helps assess changes needed in agriculture and food production
- Identifies specific foods consumed and intake patterns
6. VITAL STATISTICS
| Vital Statistic | Nutritional Relevance |
|---|---|
| Mortality rate in 1-4 years | Most closely related to malnutrition; in developing countries may be 20x higher than developed |
| Infant Mortality Rate (IMR) | Influenced by nutritional status |
| Second-year mortality rate | Reflects post-weaning malnutrition |
| Rate of Low Birth Weight babies | Reflects maternal nutritional status |
| Life expectancy | Broad index of nutritional wellbeing |
- Protein Energy Malnutrition (PEM)
- Anaemia
- Xerophthalmia, other vitamin deficiencies
- Endemic goitre
- Diarrhoea, measles, parasitic infestations
Limitation: Mortality data alone does NOT provide a satisfactory picture of nutritional status of a population.
7. ASSESSMENT OF ECOLOGICAL FACTORS
- Indirect method of assessing food consumption
- Supplies related to census population → derive per capita food supply
- Refers to country as a whole (conceals regional differences)
- Advantage: Cheaper and simpler than direct methods
- Gives general pattern of food consumption in the country
- Family size, occupation, income, education
- Cultural patterns in relation to feeding practices of children and mothers
- Food habits, customs, beliefs, traditions, food taboos
- Primary health care services
- Feeding programmes (ICDS, mid-day meal)
- Immunization programmes
- Parasitic, bacterial, viral infections → precipitate malnutrition
- Diarrhoea, measles, TB, whooping cough, malaria, intestinal parasites
- Vicious circle: Infection → malnutrition → worse infection
NUTRITIONAL SURVEILLANCE (Park - Important Concept)
- Aid long-term planning in health and development
- Provide input for programme management and evaluation
- Give timely warning and intervention to prevent short-term food consumption crises
SUMMARY TABLE - All Methods at a Glance
| Method | What It Detects | Stage of Disease |
|---|---|---|
| Food balance sheets & dietary surveys | Food gap, inadequacy | Prepathogenic |
| Biochemical tests | Diminishing reserves, subclinical deficiency | Pre-pathogenic / Early pathogenic |
| Anthropometry | Chronic/acute malnutrition (stunting/wasting) | Pathogenic |
| Functional indicators | Immune dysfunction, work capacity loss | Pathogenic |
| Clinical examination | Overt clinical signs | Post-clinical horizon |
| Vital statistics (mortality data) | Deaths due to malnutrition | End stage |
Key Exam Points:
- 7 methods of nutritional assessment: Clinical, Anthropometry, Biochemical, Functional, Dietary, Vital statistics, Ecological
- Most important lab test = Haemoglobin estimation
- Biochemical tests are done on a subsample (too expensive for whole community)
- Dietary survey in India uses weighment of raw foods (most commonly) with 7-day dietary cycle
- Nutritive Value of Indian Foods - ICMR publication used for dietary data analysis
- Mortality in 1-4 year age group is most closely linked to malnutrition in developing countries
- Ecological "ecological diagnosis" must be made before planning prevention/control
See mention the tables which are in the park textbook give that u don't make extra tables u give points wise answer make some tables where they are necessary
- Points/bullets for most content
- Tables only from Park's textbook (Table 33, Table 34, etc.) - reproduced as-is
- No extra self-made tables unless comparing 2-3 things where a table is genuinely necessary
- Clean, exam-ready, point-wise answers
NUTRITIONAL ASSESSMENT IN A COMMUNITY
(As per Park's Textbook of PSM)
DEFINITION
- Nutritional status of an individual is often the result of many interrelated factors
- It is influenced by adequacy of food intake (quantity + quality) and physical health of the individual
- Nutritional status of a community = sum of the nutritional status of all individuals forming that community
OBJECTIVES OF NUTRITIONAL SURVEY
- To obtain precise information on the prevalence and geographic distribution of nutritional problems of a given community
- To identify individuals or population groups "at risk" or in greatest need of assistance
- Without this information, problems cannot be defined and policies cannot be formulated
- To develop a health care programme that meets the needs defined by assessment
- To evaluate the effectiveness of such programmes
PLANNING THE SURVEY
- Examination of a random and representative sample of the population is sufficient (need not examine all persons)
- Sample must cover:
- All age groups
- Both sexes
- Different socio-economic groups
- All surveys should be planned with expert statistical advice
- Decisions to be made in advance:
- Duration of survey
- Type of survey - cross-sectional or longitudinal
- Standardization of measurement techniques and survey instruments
- Opportunity may be taken to conduct an intensive investigation on a sub-sample
ASSESSMENT METHODS
DIAGRAM: Methods of Nutritional Assessment & Natural History of Disease (Park's Fig. 5)
- Clinical examination
- Anthropometry
- Biochemical evaluation
- Functional assessment
- Assessment of dietary intake
- Vital and health statistics
- Ecological studies
1. CLINICAL EXAMINATION
- Essential feature of all nutritional surveys
- Simplest and most practical method of ascertaining nutritional status of a group
- There are a number of physical signs - some specific, many non-specific - known to be associated with malnutrition
- When two or more clinical signs characteristic of a deficiency disease are present simultaneously, their diagnostic significance is greatly enhanced
- (a) Not related to nutrition - e.g., alopecia, pyorrhoea, pterygium
- (b) Need further investigation - e.g., malar pigmentation, corneal vascularization, geographic tongue
- (c) Known to be of value - e.g., angular stomatitis, Bitot's spots, calf tenderness, absence of knee or ankle jerks (beri-beri), enlargement of thyroid gland (endemic goitre)
- (a) Malnutrition cannot be quantified on the basis of clinical signs
- (b) Many deficiencies are unaccompanied by physical signs
- (c) Lack of specificity and subjective nature of most physical signs
- To minimize errors, standard survey forms/schedules covering all areas of the body have been devised (Annexure I - specimen nutrition assessment schedule)
2. ANTHROPOMETRY
- Anthropometric measurements such as height, weight, skinfold thickness and arm circumference are valuable indicators of nutritional status
- In young children, additional measurements such as head and chest circumference are made
- If recorded over a period of time, they reflect patterns of growth and development, and how individuals deviate from the average at various ages in body size, build and nutritional status
- Anthropometric data can be collected by non-medical personnel, given sufficient training
3. LABORATORY AND BIOCHEMICAL ASSESSMENT
- (i) Haemoglobin estimation - most important laboratory test carried out in nutrition surveys; Hb level is a useful index of overall state of nutrition irrespective of its significance in anaemia; RBC count and haematocrit are also valuable
- (ii) Stools and urine - Stools should be examined for intestinal parasites; history of parasitic infestation, chronic dysentery and diarrhoea provides useful background information; Urine should be examined for albumin and sugar
- With increasing knowledge of metabolic functions of vitamins and minerals, assessment has given way to more precise biochemical tests
- Applied to measure:
- Individual nutrient concentration in body fluids (e.g., serum retinol, serum iron)
- Detection of abnormal amounts of metabolites in urine (e.g., urinary iodine) - frequently after a loading dose
- Measurement of enzymes in which the vitamin is a known co-factor (e.g., in riboflavin deficiency)
- Help establish malnutrition in its preclinical stages
- Time-consuming and expensive
- Cannot be applied on a large scale to a whole community
- Often carried out only on a subsample of the population
- Most biochemical tests reveal only current nutritional status
- Useful to quantify mild deficiencies
- If clinical examination has raised a question, biochemical tests may be invoked to prove or disprove it
PARK'S TABLE 33 - Some Biochemical Tests Used in Nutrition Surveys
| Nutrient | Method | Normal Value |
|---|---|---|
| Vitamin A | Serum retinol | 20 mcg/dL |
| Thiamine | TPP stimulation of RBC transketolase activity | 1.00 - 1.23 (ratio) |
| Riboflavin | RBC glutathione reductase stimulated by FAD | 1.0 - 1.2 (ratio) |
| Niacin | Urine N-methyl nicotinamide | (not very reliable) |
| Folate | Serum folate | 6.0 mcg/mL |
| Red cell folate | 160 mcg/mL | |
| Vitamin B12 | Serum vitamin B12 concentration | 160 mg/L |
| Vitamin C | Leucocyte ascorbic acid | 15 mcg/10⁹ cells |
| Vitamin K | Prothrombin time | 11 - 16 seconds |
| Protein | Serum albumin | 35 g/L |
| Transferrin | 20 g/L | |
| Thyroid-binding pre-albumin | 250 mg/L |
4. FUNCTIONAL INDICATORS
- Static indices (biochemical indicators) will continue to play an important role as they are well-established and familiar to practitioners and public health workers
- Functional indices are emerging as an important class of diagnostic tools
PARK'S TABLE 34 - Functional Indices of Nutritional Status
| System | Test | Nutrient |
|---|---|---|
| Structural integrity | Erythrocyte fragility | Vit E, Se |
| Capillary fragility | Vit C | |
| Tensile strength | Cu | |
| Host defence | Leucocyte chemotaxis | P/E, Zn |
| Leucocyte phagocytic capacity | P/E, Fe | |
| Leucocyte bactericidal capacity | P/E, Fe, Se | |
| T cell blastogenesis | P/E, Zn | |
| Delayed cutaneous hypersensitivity | P/E, Zn | |
| Haemostasis | Prothrombin time | Vit K |
| Reproduction | Sperm count | Energy, Zn |
| Nerve function | Nerve conduction | P/E, Vit B1, B12 |
| Dark adaptation | Vit A, Zn | |
| EEG | P/E | |
| Work capacity | Heart rate | P/E, Fe |
| Vasopressor response | Vit C |
5. ASSESSMENT OF DIETARY INTAKE
- Value of nutritional assessment is greatly enhanced when supplemented by assessment of food consumption
- Direct assessment of food consumption involves dietary surveys - household inquiries or individual food consumption surveys
- (i) Weighment of Raw Foods - widely employed in India; survey team visits households and weighs all food going to be cooked and eaten as well as food wasted or discarded; duration may vary from 1 to 21 days, commonly 7 days ("one dietary cycle"); considered fairly accurate
- (ii) Weighment of Cooked Foods - foods analyzed in the state in which they are normally consumed; not easily acceptable among people
- (iii) Oral Questionnaire Method - useful for large numbers of people in a short time; retrospective inquiry about nature and quantity of food eaten in previous 24 or 48 hours; if properly carried out, gives reliable results
- (a) Mean intake (grams) of food in terms of cereals, pulses, etc.
- (b) Nutritive value (energy, proteins, fats, minerals, vitamins) using ICMR's "Nutritive Value of Indian Foods" publication
- Comparison with RDA to assess adequacy
- Provides information about dietary intake patterns, specific foods consumed and estimated nutrient intakes
- Indicates relative dietary inadequacies as judged by present standards
- Valuable for planning health education activities
- Allows assessment of changes needed in agriculture and food production industries
6. VITAL STATISTICS
- Analysis of vital statistics - mortality and morbidity data - will identify groups at high risk and indicate the extent of risk to the community
- Mortality in age group 1 to 4 years is particularly related to malnutrition; in developing countries it may be as much as 20 times that in countries such as Australia, Denmark or France
- Infant mortality rate
- Second-year mortality rate
- Rate of low birth-weight babies
- Life expectancy
- Protein energy malnutrition
- Anaemia
- Xerophthalmia and other vitamin deficiencies
- Endemic goitre
- Diarrhoea, measles, parasitic infestations
Limitation: Mortality data do not provide a satisfactory picture of nutritional status of a population
7. ASSESSMENT OF ECOLOGICAL FACTORS
- Malnutrition is the end result of many interacting ecological factors
- In any nutrition survey it is necessary to collect ecological information of the given community to make the assessment complete
- An "ecological diagnosis" of various factors influencing nutrition in the community must be made before measures for prevention and control can be put into effect
- (a) Food Balance Sheet - indirect method of assessing food consumption; supplies related to census population to derive levels of food consumption in terms of per capita supply availability; refers to country as a whole (conceals differences between regions and economic/age/sex groups); advantage - cheaper and simpler than any direct assessment method; gives indication of general pattern of food consumption in the country
- (b) Socio-economic Factors - food consumption patterns vary among various socio-economic groups; family size, occupation, income, education, customs, cultural patterns in relation to feeding practices of children and mothers - all influence food consumption patterns
- (c) Health and Educational Services - primary health care services, feeding and immunization programmes should also be taken into consideration
- (d) Conditioning Influences - parasitic, bacterial and viral infections which precipitate malnutrition
NUTRITIONAL SURVEILLANCE (Park - Key Concept)
- (a) To aid long-term planning in health and development
- (b) To provide input for programme management and evaluation
- (c) To give timely warning and intervention to prevent short-term food consumption crises
HIGH-YIELD POINTS FOR EXAM
- 7 methods of nutritional assessment - CABFVED (Clinical, Anthropometry, Biochemical, Functional, Vital statistics, Ecological, Dietary)
- Most important lab test in nutrition survey = Haemoglobin estimation
- Biochemical tests are done on a subsample (expensive; cannot do on whole community)
- Dietary survey in India = Weighment of raw foods, duration = 7-day dietary cycle
- Reference for dietary data in India = ICMR "Nutritive Value of Indian Foods"
- Mortality in 1-4 year age group is most closely linked to malnutrition
- Mortality data alone is not satisfactory for assessing nutritional status
- Always make an ecological diagnosis before planning prevention/control
Convert this answer into 6-8 marks
NUTRITIONAL ASSESSMENT IN A COMMUNITY
(6-8 Marks | As per Park's PSM)
DEFINITION
- Nutritional status of a community = sum of the nutritional status of all individuals forming that community
- The main objective of a nutritional survey is to obtain precise information on prevalence and geographic distribution of nutritional problems, identify groups "at risk", and develop/evaluate health care programmes
PLANNING
- Examine a random and representative sample covering all ages, both sexes, different socio-economic groups
- Decide in advance: duration, type (cross-sectional/longitudinal), standardization of techniques
- All surveys planned with expert statistical advice
ASSESSMENT METHODS
1. Clinical Examination
- Simplest and most practical method
- Look for physical signs of nutritional deficiency using standard survey forms (Annexure I)
- WHO classified signs into 3 categories:
- Not related to nutrition - alopecia, pyorrhoea, pterygium
- Need further investigation - malar pigmentation, corneal vascularization
- Known to be of value - angular stomatitis, Bitot's spots, absent knee/ankle jerks (beri-beri), goitre
- Drawbacks: Cannot quantify malnutrition; many deficiencies have no physical signs; lacks specificity
2. Anthropometry
- Height, weight, skinfold thickness, arm circumference
- In young children - head and chest circumference additionally
- Can be collected by non-medical personnel with training
- Reflects patterns of growth and development over time
3. Biochemical Evaluation
- (i) Lab tests - Hb estimation (most important), RBC count, haematocrit; stool for parasites; urine for albumin and sugar
- (ii) Biochemical tests - Serum retinol (Vit A), urinary iodine, serum iron - detect malnutrition in preclinical stages
- Limitations: Time-consuming, expensive; done only on a subsample; reveals only current status
4. Functional Indicators
- Emerging as important diagnostic tools alongside static biochemical indices
- Examples (Park's Table 34): Delayed cutaneous hypersensitivity (P/E, Zn); Dark adaptation (Vit A, Zn); Nerve conduction (Vit B1, B12); Work capacity/Heart rate (P/E, Fe)
5. Assessment of Dietary Intake
- Methods of dietary survey:
- Weighment of raw foods - widely used in India; 7-day dietary cycle; fairly accurate
- Weighment of cooked foods - accurate but not easily acceptable
- Oral questionnaire (24-hr recall) - useful for large populations; quick
- Data translated using ICMR's "Nutritive Value of Indian Foods" and compared with RDA
6. Vital Statistics
- Mortality and morbidity data identify high-risk groups
- Mortality in 1-4 year age group is most related to malnutrition
- Other indicators: IMR, second-year mortality rate, rate of LBW babies, life expectancy
- Limitation: Mortality data alone is not a satisfactory picture of nutritional status
7. Ecological Studies
- Malnutrition is the end result of many interacting ecological factors
- Components:
- (a) Food Balance Sheet - indirect method; per capita food availability; cheaper and simpler than direct methods
- (b) Socio-economic factors - income, occupation, family size, education, food habits
- (c) Health and educational services - PHC, feeding programmes, immunization
- (d) Conditioning influences - infections (diarrhoea, TB, parasites) that precipitate malnutrition
- An "ecological diagnosis" must be made before planning prevention and control
KEY POINTS
- 7 methods - C A B F D V E (Clinical, Anthropometry, Biochemical, Functional, Dietary, Vital statistics, Ecological)
- Most important lab test = Haemoglobin estimation
- Most common dietary survey method in India = Weighment of raw foods (7-day cycle)
- Biochemical tests done on subsample only
Enumerate the major nutritional problems of india Define malnutrition Pem-risk factors and cause -classification - prevention and control to reduce pem in india "Long note "
NUTRITIONAL PROBLEMS OF INDIA, MALNUTRITION & PEM
(Long Note | As per Park's PSM)
I. ENUMERATE MAJOR NUTRITIONAL PROBLEMS OF INDIA
"From the nutritional point of view, the Indian society is a dual society - a small group of well fed and a very large group of undernourished." - Park
- Insufficiency of food - the "food gap" - is the chief cause
- Major health problem particularly in the first years of life
- About 80% are mild and moderate cases
- Incidence of severe cases is 1-2% in preschool age children
- Nutritional marasmus is more frequent than kwashiorkor in India
- India has probably the highest prevalence of nutritional anaemia in women and children
- About one-half of non-pregnant women and young children suffer from anaemia
- 50.3% of pregnant women are anaemic
- 19% of maternal deaths are attributed to anaemia
- According to NFHS-4: 53.1% women are anaemic; anaemia in children aged 6-59 months is 58.4%
- Most common cause: Iron deficiency; less frequently folate and Vitamin B12 deficiency
- About 28% of babies born in India are LBW (<2.5 kg)
- Maternal malnutrition and anaemia are mainly responsible
- According to NFHS-4: 18.5% children are born with LBW
- About 0.04% of total blindness in India attributed to Vitamin A deficiency
- Keratomalacia is the major cause of nutritional blindness in children usually between 1-3 years of age
- Subclinical deficiency of Vitamin A is widespread - associated with increased morbidity and mortality from respiratory and GI infections
- Goitre and IDD highly endemic in sub-Himalayan regions
- Problem is not restricted to the "goitre belt" - also prevalent in other parts of India
- 263 out of 324 districts surveyed in 29 states and all UTs are endemic (prevalence >10%)
- More than 71 million people are suffering from goitre and other IDD
- Lathyrism and endemic fluorosis in certain parts of the country
- Widespread adulteration of foodstuffs
II. DEFINITION OF MALNUTRITION
- The word "malnutrition" literally means "bad nutrition"
- It includes both undernutrition (deficiency of calories, protein, vitamins, minerals) and overnutrition (excess intake)
- WHO definition: "A pathological state resulting from a relative or absolute deficiency or excess of one or more essential nutrients"
- Malnutrition is said to be a "man-made disease" - it is a disease of human societies. It begins quite commonly in the womb and ends in the grave
- (a) Protein-Energy Malnutrition - deficiency of proteins and calories
- (b) Micronutrient malnutrition - deficiency of essential vitamins and minerals such as Vitamin A, calcium, iodine, iron and zinc; estimated ~2 billion people affected worldwide
- (c) Overnutrition - excess intake leading to obesity, diabetes, hypertension, cardiovascular disease
- Stunting - chronic malnutrition (low height-for-age)
- Wasting - acute malnutrition (low weight-for-height)
- Underweight - composite measure (low weight-for-age)
III. PROTEIN ENERGY MALNUTRITION (PEM)
- PEM has been identified as a major health and nutrition problem in India
- It occurs particularly in weaklings and children in the first years of life
- Characterized by: low birth weight (if mother malnourished), poor growth in children, high level of mortality in children between 12 and 24 months
- Estimated to be an underlying cause in 30% of deaths among children under age 5
A. RISK FACTORS AND CAUSES OF PEM
- In the 1970s it was widely held that PEM was due to protein deficiency ("protein gap")
- Over the years, the concept of "protein gap" has given place to "food gap"
- PEM is primarily due to:
- (a) Inadequate intake of food - both in quantity and quality
- (b) Infections - notably diarrhoea, respiratory infections, measles and intestinal worms which:
- Increase requirements for calories, protein and other nutrients
- Decrease their absorption and utilization
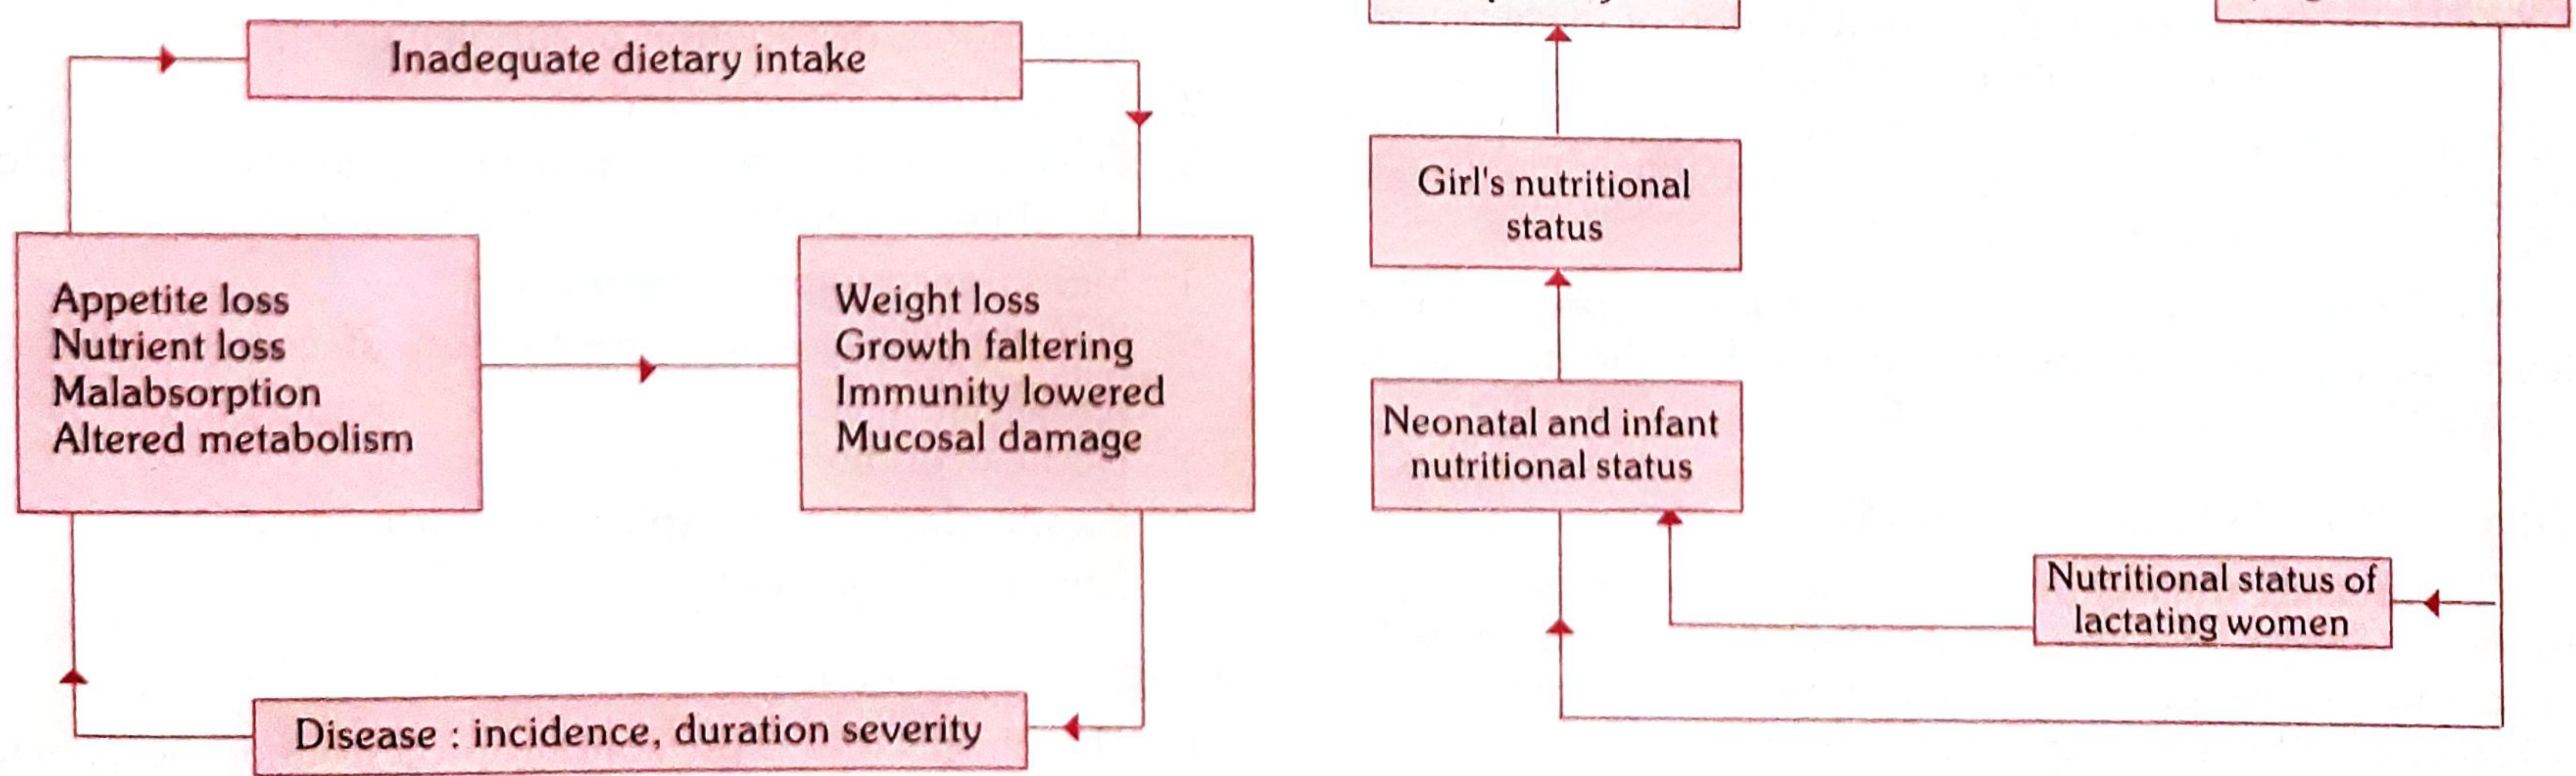
Infection contributes to malnutrition and malnutrition contributes to infection - both acting synergistically
- Poor environmental conditions
- Large family size
- Poor maternal health
- Failure of lactation
- Premature termination of breast-feeding
- Adverse cultural practices relating to child rearing and weaning:
- Use of over-diluted cow's milk
- Discarding cooking water from cereals
- Delayed supplementary feeding
- A child's nutritional status depends on past nutritional history
- This nutritional history is linked to the mother's health and nutritional status
- Which in turn was influenced by her own childhood living conditions and nutritional history
- Thus malnutrition is intergenerational
B. CLASSIFICATION OF PEM
| Condition | Index Used | Definition |
|---|---|---|
| Underweight | Weight-for-Age | WFA Z-score < -2SD below WHO median; composite of stunting + wasting |
| Stunting | Height/Length-for-Age | HFA Z-score < -2SD; reflects chronic malnutrition |
| Wasting | Weight-for-Height | WFH Z-score < -2SD; reflects acute malnutrition |
- Each indicator expressed in Z-scores (SD units) from the median of the reference population
- Further classified as moderate (-2SD to -3SD) or severe (< -3SD)
- Develops in individuals on diets with low protein/energy ratio
- Main symptoms:
- Oedema (pitting)
- Wasting
- Liver enlargement (hepatomegaly)
- Hypoalbuminaemia
- Steatosis (fatty liver)
- Depigmentation of skin and hair (flag sign)
- Caused by inadequate intake of both protein and energy
- Form of severe cachexia with weight loss - wasting in infancy and childhood
- Main symptoms:
- Severe wasting (baggy pants appearance)
- Little or no oedema
- Minimal subcutaneous fat
- Severe muscle wasting
- Non-normal serum albumin levels
In India: Marasmus > Kwashiorkor in frequency
- First indicator of PEM = underweight for age
- Most practical method = Growth charts (can be employed by field health workers)
- Growth charts indicate at a glance whether the child is gaining or losing weight
| MUAC | Interpretation |
|---|---|
| > 13.5 cm | Satisfactory nutritional status |
| 12.5 - 13.5 cm | Mild-moderate malnutrition |
| < 12.5 cm | Severe malnutrition |
- Cannot be used before 1 year of age
- Between ages 1 to 5 years - hardly varies, making it a reliable screening tool
C. PREVENTION AND CONTROL OF PEM IN INDIA
"There is no simple solution to the problem of PEM. Many types of actions are necessary."
- Measures directed to pregnant and lactating women - education, distribution of supplements
- Promotion of breast-feeding
- Development of low cost weaning foods - child should eat more food at frequent intervals
- Measures to improve family diet
- Nutrition education - promotion of correct feeding practices
- Home economics
- Family planning and spacing of births
- Improvement of family environment
- Child's diet must contain protein and energy-rich foods - milk, eggs, fresh fruits should be given if possible
- Immunization - to prevent infections that trigger PEM
- Food fortification
- Periodic surveillance - growth monitoring
- Early diagnosis of any lag in growth
- Early diagnosis and treatment of infections and diarrhoea
- Development of programmes for early rehydration of children with diarrhoea
- Development of supplementary feeding programmes during epidemics
- Deworming of heavily infested children
- Nutritional rehabilitation services (NRC - Nutritional Rehabilitation Centres under NHM)
- Hospital treatment
- Follow-up care
National Programmes Addressing PEM in India:
- ICDS (Integrated Child Development Services) - supplementary nutrition, immunization, health check-up, nutrition education for children <6 years and pregnant/lactating women
- Mid-Day Meal Scheme - school children
- Pradhan Mantri Matru Vandana Yojana - maternity benefit scheme
- National Nutrition Mission (POSHAN Abhiyaan) - launched 2018, target to reduce stunting and undernutrition
- Janani Suraksha Yojana - promoting institutional delivery, addressing LBW
- NRC (Nutritional Rehabilitation Centres) - management of Severe Acute Malnutrition (SAM)
HIGH-YIELD EXAM POINTS:
- PEM = underlying cause in 30% of under-5 deaths
- Concept shifted from "protein gap" to "food gap" - primary cause is inadequate food intake + infections
- Marasmus > Kwashiorkor in India
- First indicator of PEM = underweight for age; detected by growth charts
- MUAC < 12.5 cm = severe malnutrition
- Kwashiorkor = low protein/energy ratio diet; oedema present
- Marasmus = both protein + energy deficient; no oedema, severe wasting
- Prevention follows Leavell & Clark's levels - health promotion, specific protection, early diagnosis, rehabilitation
Add More points to answer acc to park
NUTRITIONAL PROBLEMS OF INDIA, MALNUTRITION & PEM
(Long Note | As per Park's PSM - Updated with More Points)
I. MAJOR NUTRITIONAL PROBLEMS OF INDIA
"There are many nutritional problems which affect vast segments of our population." - Park
- Insufficiency of food - the "food gap" - is the chief cause
- Major health problem particularly in the first years of life
- About 80% are mild and moderate cases
- Incidence of severe cases is 1-2% in preschool age children
- Nutritional marasmus is more frequent than kwashiorkor in India
- PEM is an underlying cause in 30% of deaths among children under age 5
- As many as 27% of children in low income countries have stunting; 17% have low weight for height
- India has probably the highest prevalence of nutritional anaemia in women and children
- About one-half of non-pregnant women and young children suffer from anaemia
- 50.3% of pregnant women are anaemic
- 19% of maternal deaths are attributed to anaemia
- NFHS-4: 53.1% women are anaemic; children aged 6-59 months: 58.4% anaemic
- Most common cause: iron deficiency; less frequently folate and Vitamin B12 deficiency
- Even mild anaemia reduces resistance to fatigue; profound effect on psychological and physical behaviour
- LBW = birth weight less than 2500 g
- According to Rapid Survey Report on Children 2014: 18.6% of babies born in India are LBW
- Compared to only 4% in some developed countries
- In countries with high LBW proportion - majority have foetal growth retardation
- Significant risk factors: maternal malnutrition and anaemia
- Other causes: hard physical labour during pregnancy, infections, short maternal stature, very young age, high parity, smoking, close birth intervals
- Problem is multifactorial - no universal solution; interventions have to be cause-specific
- 0.04% of total blindness in India attributed to Vitamin A deficiency
- Keratomalacia is the major cause of nutritional blindness in children 1-3 years
- Most common in children 1-3 years, often related to weaning; younger the child, more severe the disease
- Often associated with PEM; mortality is high in this age group
- Victims belong to the poorest families
- States badly affected: Andhra Pradesh, Tamil Nadu, Karnataka, Bihar, West Bengal (predominantly rice-eating states; rice is devoid of carotene)
- North Indian states have relatively fewer cases
- Only 21% of children aged 12-35 months receive a Vitamin A dose (coverage is very low)
- An estimated 5.7% children in India suffer from eye signs of VAD
- In 1970, National Programme for Prevention of Nutritional Blindness was initiated; modified in 1992; now part of NRHM/RCH programme
- Highly endemic in sub-Himalayan regions (the "goitre belt")
- Problem is NOT restricted to the goitre belt - also found in other parts of India
- Out of 324 districts surveyed in 29 states and all UTs, 263 districts are endemic (prevalence >10%)
- More than 71 million people suffering from goitre and other IDD
- IDD globally affects 1.5 billion people living in iodine-deficient environments
- At least 30,000 babies are stillborn each year due to iodine deficiency; over 120,000 born mentally retarded, physically stunted, deaf-mute or paralysed
- Lathyrism and endemic fluorosis in certain parts of the country
- Widespread adulteration of foodstuffs
II. DEFINITION OF MALNUTRITION
"A pathological state resulting from a relative or absolute deficiency or excess of one or more essential nutrients"
- Malnutrition literally means "bad nutrition"
- Malnutrition is a "man-made disease" - a disease of human societies; begins commonly in the womb and ends in the grave
- Nutritional deficiencies not only lead to severe illnesses requiring long and costly treatment, but also influence physical development, psychic behaviour and susceptibility to infection
- (a) Protein-Energy Malnutrition - deficiency of proteins and calories
- (b) Micronutrient malnutrition - deficiency of Vitamin A, calcium, iodine, iron, zinc; estimated ~2 billion people affected worldwide
- Vitamin A deficiency - most common cause of preventable childhood blindness worldwide
- Iodine deficiency - causes goitre, cretinism and brain damage
- Anaemia - results from insufficient iron intake
- (c) Overnutrition - excess intake; leads to obesity, diabetes, hypertension, cardiovascular disease, liver and gall bladder disorders (diseases of affluence)
- Stunting - chronic malnutrition (low height-for-age)
- Wasting - acute malnutrition (low weight-for-height)
- Underweight - composite measure (low weight-for-age)
III. PROTEIN ENERGY MALNUTRITION (PEM)
- PEM is a major health and nutrition problem in India
- Occurs particularly in weaklings and children in the first years of life
- Characterized by:
- Low birth weight (if mother is malnourished)
- Poor growth in children
- High level of mortality in children between 12-24 months
- Estimated to be an underlying cause in 30% of deaths among children under age 5
- NFHS-4: 35.7% children are underweight, 38.4% are stunted, 21% are wasted
A. RISK FACTORS AND CAUSES OF PEM
- In the 1970s: PEM was thought to be due to "protein gap" (protein deficiency)
- Over the years: concept of "protein gap" has given place to concept of "food gap"
- PEM is primarily due to:
- (a) Inadequate intake of food - both in quantity and quality (food gap)
- (b) Infections - notably diarrhoea, respiratory infections, measles and intestinal worms, which:
- Increase requirements for calories, protein and other nutrients
- Decrease their absorption and utilization
Infection contributes to malnutrition and malnutrition contributes to infection - both acting synergistically - it is a vicious circle
- Poor environmental conditions
- Large family size
- Poor maternal health
- Failure of lactation
- Premature termination of breast-feeding
- Adverse cultural practices:
- Use of over-diluted cow's milk
- Discarding cooking water from cereals
- Delayed supplementary feeding
- A child's nutritional status at any point of time depends on past nutritional history
- This history is linked to the mother's health and nutritional status
- Which in turn was influenced by her own childhood living conditions and nutritional history
- Thus malnutrition perpetuates from generation to generation (Park's Fig. 3)
B. CLASSIFICATION OF PEM
1. Based on Anthropometric Indices (Z-scores / WHO)
| Condition | Index Used | Definition | Type |
|---|---|---|---|
| Underweight | Weight-for-Age (WFA) | Z-score < -2SD | Composite of stunting + wasting |
| Stunting | Height-for-Age (HFA) | Z-score < -2SD | Chronic malnutrition (past) |
| Wasting | Weight-for-Height (WFH) | Z-score < -2SD | Acute malnutrition (current) |
- Moderate: Z-score between -2SD and -3SD
- Severe: Z-score below -3SD
Key Details on Each Type:
- Recommended indicator to assess changes in magnitude of malnutrition over time
- Can result from either chronic or acute malnutrition, or both
- Even mildly underweight children have increased mortality risk
- Severely underweight children are at even greater risk
- Failure to achieve expected height/length compared to healthy well-nourished children of same age
- Indicator of past growth failure (linear growth retardation)
- Results from: chronic insufficient nutrient intake, frequent infections, sustained inappropriate feeding practices, poverty
- Associated with delayed psycho-social and cognitive development and poor school performance
- Can be exacerbated by recurrent and chronic illness
- Represents a recent (current) failure to receive adequate nutrition
- Very sensitive to - changes in food availability or disease prevalence
- Shows marked seasonal patterns
- Causes: inadequate food intake, incorrect feeding practices, disease, infection - frequently a combination
2. Severe Acute Malnutrition (SAM)
- Very low weight-for-height/length (Z-score below -3SD)
- OR mid-upper arm circumference (MUAC) < 115 mm (< 11.5 cm)
- OR presence of nutritional oedema
- SAM significantly increases risk of death in children under 5 years
- Can indirectly cause death by increasing case fatality rate in children with diarrhoea and pneumonia
- Children who are severely wasted are 9 times likely to die than well-nourished children
3. Clinical Forms of Severe PEM
- Develops on diets with low protein/energy ratio
- Features:
- Oedema (pitting)
- Wasting
- Liver enlargement (hepatomegaly)
- Hypoalbuminaemia
- Steatosis (fatty liver)
- Depigmentation of skin and hair (flag sign)
- Misery and apathy
- Caused by inadequate intake of both protein and energy
- Severe cachexia with weight loss - wasting in infancy and childhood
- Features:
- Severe wasting ("old man" appearance; "baggy pants")
- Little or no oedema
- Minimal subcutaneous fat
- Severe muscle wasting
- Non-normal serum albumin
In India: Marasmus > Kwashiorkor in frequency
4. Early Detection of PEM
- First indicator of PEM = underweight for age
- Most practical method detectable even by field health workers = Growth charts
- Growth charts indicate at a glance whether child is gaining or losing weight
- Arm circumference yields reliable estimation of the body's muscle mass
- Reduction of muscle mass is one of the most striking mechanisms by which the body adjusts to inadequate energy intake
- Cannot be used before 1 year of age
- Between ages 1-5 years - hardly varies (reliable screening tool)
| MUAC | Status |
|---|---|
| > 13.5 cm | Satisfactory nutritional status |
| 12.5 - 13.5 cm | Mild-moderate malnutrition |
| < 12.5 cm | Severe malnutrition |
C. PREVENTION AND CONTROL OF PEM IN INDIA
"There is no simple solution to the problem of PEM. Many types of actions are necessary."
- Measures directed to pregnant and lactating women - education, distribution of supplements
- Promotion of breast-feeding
- Development of low-cost weaning foods - child should eat more food at frequent intervals
- Measures to improve family diet
- Nutrition education - promotion of correct feeding practices
- Home economics
- Family planning and spacing of births
- Improvement of family environment
- Child's diet must contain protein and energy-rich foods - milk, eggs, fresh fruits if possible
- Immunization - to prevent infections that trigger and worsen PEM
- Food fortification
- Periodic surveillance - regular growth monitoring
- Early diagnosis of any lag in growth
- Early diagnosis and treatment of infections and diarrhoea
- Development of programmes for early rehydration of children with diarrhoea
- Development of supplementary feeding programmes during epidemics
- Deworming of heavily infested children
- Nutritional rehabilitation services (NRC)
- Hospital treatment
- Follow-up care
- ICDS - supplementary nutrition, immunization, health check-up, referral services, nutrition education for children <6 years + pregnant/lactating women
- Mid-Day Meal Scheme - school children
- POSHAN Abhiyaan (National Nutrition Mission) - launched 2018; target to reduce stunting, undernutrition, anaemia and LBW
- NRC (Nutritional Rehabilitation Centres) under NHM - management of Severe Acute Malnutrition (SAM)
- Pradhan Mantri Matru Vandana Yojana - maternity benefit
- Janani Suraksha Yojana - institutional delivery, addressing LBW
HIGH-YIELD EXAM POINTS
- Primary cause of PEM = Food gap (not protein gap - concept changed in 1970s)
- PEM = underlying cause of 30% under-5 deaths
- SAM defined by MUAC < 115 mm OR Z-score < -3SD OR nutritional oedema
- Severely wasted children = 9 times more likely to die
- Marasmus > Kwashiorkor in India
- Kwashiorkor = oedema present; Marasmus = no oedema, severe wasting
- MUAC < 12.5 cm = severe malnutrition; only valid 1-5 years of age
- First indicator of PEM = underweight for age, detected by growth charts
- Stunting = past failure; Wasting = current/acute failure
- Malnutrition is intergenerational - perpetuates from mother to child
Refer park textbook of spm Epidemiology of chd Long note
EPIDEMIOLOGY OF CORONARY HEART DISEASE (CHD)
(Long Note | As per Park's PSM)
DEFINITION
- CHD (syn: Ischaemic Heart Disease) has been defined as:
"Impairment of heart function due to inadequate blood flow to the heart compared to its needs, caused by obstructive changes in the coronary circulation to the heart"
- WHO has drawn attention to the fact that CHD is our modern "epidemic" - a disease that affects populations, not an unavoidable attribute of ageing
- It is the cause of 25-30% of deaths in most industrialized countries
CLINICAL PRESENTATIONS OF CHD
- (a) Angina pectoris of effort
- (b) Myocardial infarction (specific to CHD)
- (c) Irregularities of the heart
- (d) Cardiac failure
- (e) Sudden death
Myocardial infarction is specific to CHD; angina pectoris and sudden death are not. Rheumatic heart disease and cardiomyopathy are potential sources of diagnostic confusion. The natural history of CHD is very variable - death may occur in the first episode or after a long history of disease.
MEASURING THE BURDEN OF DISEASE
- (a) Proportional mortality ratio - CHD is responsible for about 30% of deaths in men and 25% of deaths in women in most western countries
- (b) Loss of life expectancy - CHD cuts short life expectancy; complete elimination of cardiovascular deaths would benefit men by 3.4 to 9.4 years
- (c) CHD incidence rate - sum of fatal and non-fatal attack rates; because of different manifestations, accurate incidence rates are difficult to compute; mortality rates can be used as a crude indicator
- (d) Age-specific death rates - essential when analysis is planned to throw light on aetiology; suggest a true increase in incidence
- (e) Prevalence rate - estimated from cross-sectional surveys using ECG for evidence of infarction and history of prolonged chest pain (reference: "Cardiovascular Survey Methods" by Rose and Blackburn)
- (f) Case fatality rate - defined as proportion of attacks that are fatal within 28 days of onset
- International Society and Federation of Cardiology: "sudden deaths" = deaths occurring instantly or within 24 hours of onset of acute symptoms
- 25-28% of patients who suffer a heart attack die suddenly
- In about 55% of all cardiac deaths, mortality occurs within the first hour
- (g) Measurement of risk factor levels - measurement of cigarette smoking, blood pressure, alcohol consumption and serum cholesterol in the community
- (h) Medical care - measurement of levels of medical care in the community
EPIDEMICITY (CHANGING TRENDS)
- "Epidemics" of CHD began at different times in different countries:
- USA - early 1920s; a steady decline evident by 1968; 25% fall in mortality (not morbidity) by 1980
- Britain - 1930s
- European countries - still later
- Developing countries - currently catching up
- Decline in mortality in US and other countries attributed to:
- Changes in life-styles and related risk factors (diet, serum cholesterol, cigarette use, exercise)
- Better control of hypertension
- WHO project MONICA (Multinational Monitoring of Trends and Determinants in Cardiovascular Diseases) was undertaken to elucidate the reasons for changing trends
- 41 centres in 26 countries participated; planned for 10 years ending in 1994
- Originally a disease of higher social classes in affluent societies; 50 years later, there is a strong inverse relation between social class and CHD in developed countries
- CHD is still the most frequent single cause of death among men under 65 in many developed countries
INTERNATIONAL VARIATIONS
- With 7.2 million deaths (earlier estimate) and 12.8% of total deaths, CHD is a worldwide disease
Park's TABLE 1 - Mortality due to CHD, Global Estimates for 2016
| Region | Deaths (000) | % of total CHD deaths |
|---|---|---|
| Africa | 512 | 5.8 |
| SEAR | 2,234 | 16.2 |
| Americas | 1,091 | 15.9 |
| East Mediterranean | 835 | 20.3 |
| Europe | 2,342 | 25.4 |
| Western Pacific | 2,393 | 17.4 |
| World | 9,433 | 100 |
- Highest coronary mortality = Western Pacific Region, followed by European Region
- Lower rates in Americas and Eastern Mediterranean countries
CHD IN INDIA
- CHD is assuming serious dimension in developing countries
- Considerable increase in prevalence of CHD in urban areas in India in the last decade
- Increase in rural areas also, but not as steep because life-style changes have affected urban people more
-
Urban areas: 6.4% overall; 6.1% males; 6.7% females
-
Rural areas: 2.5% overall; 2.1% males; 2.7% females
-
According to medical certification of cause of death data, 25.1% of total deaths in urban areas are attributable to diseases of the circulatory system
-
It was assumed that CHD mortality rates in rural areas are expected to be half of those in urban areas
-
Estimated 16,08,700 people died of CHD in 2016; crude death rate = 121.5/100,000 population
RISK FACTORS
"The aetiology of CHD is multifactorial" - Park
- Apart from obvious ones such as increasing age and male sex, several important "risk factors" have been identified
- Some are modifiable, others are immutable (non-modifiable)
- Presence of any one risk factor places individual in a high-risk category
- Greater the number of risk factors, the more likely one is to develop CHD
Park's TABLE 2 - Risk Factors for CHD
| Not Modifiable | Modifiable |
|---|---|
| Age | Cigarette smoking |
| Sex | High blood pressure |
| Family history | Elevated serum cholesterol |
| Genetic factors | Diabetes |
| Personality (?) | Obesity |
| Sedentary habits | |
| Stress |
1. SMOKING
- A major CHD risk factor with several possible mechanisms:
- Carbon monoxide induced atherogenesis
- Nicotine stimulation of adrenergic drive - raises blood pressure and myocardial oxygen demand
- Fall in protective HDL (lipid metabolism changes)
- Responsible for 25% of CHD deaths under 65 years of age in men (in countries where smoking is widespread)
- Cigarettes are particularly important in causing sudden death from CHD, especially in men under 50 years of age
- Risk of CHD is directly related to the number of cigarettes smoked per day
- Filter cigarettes are probably not protective
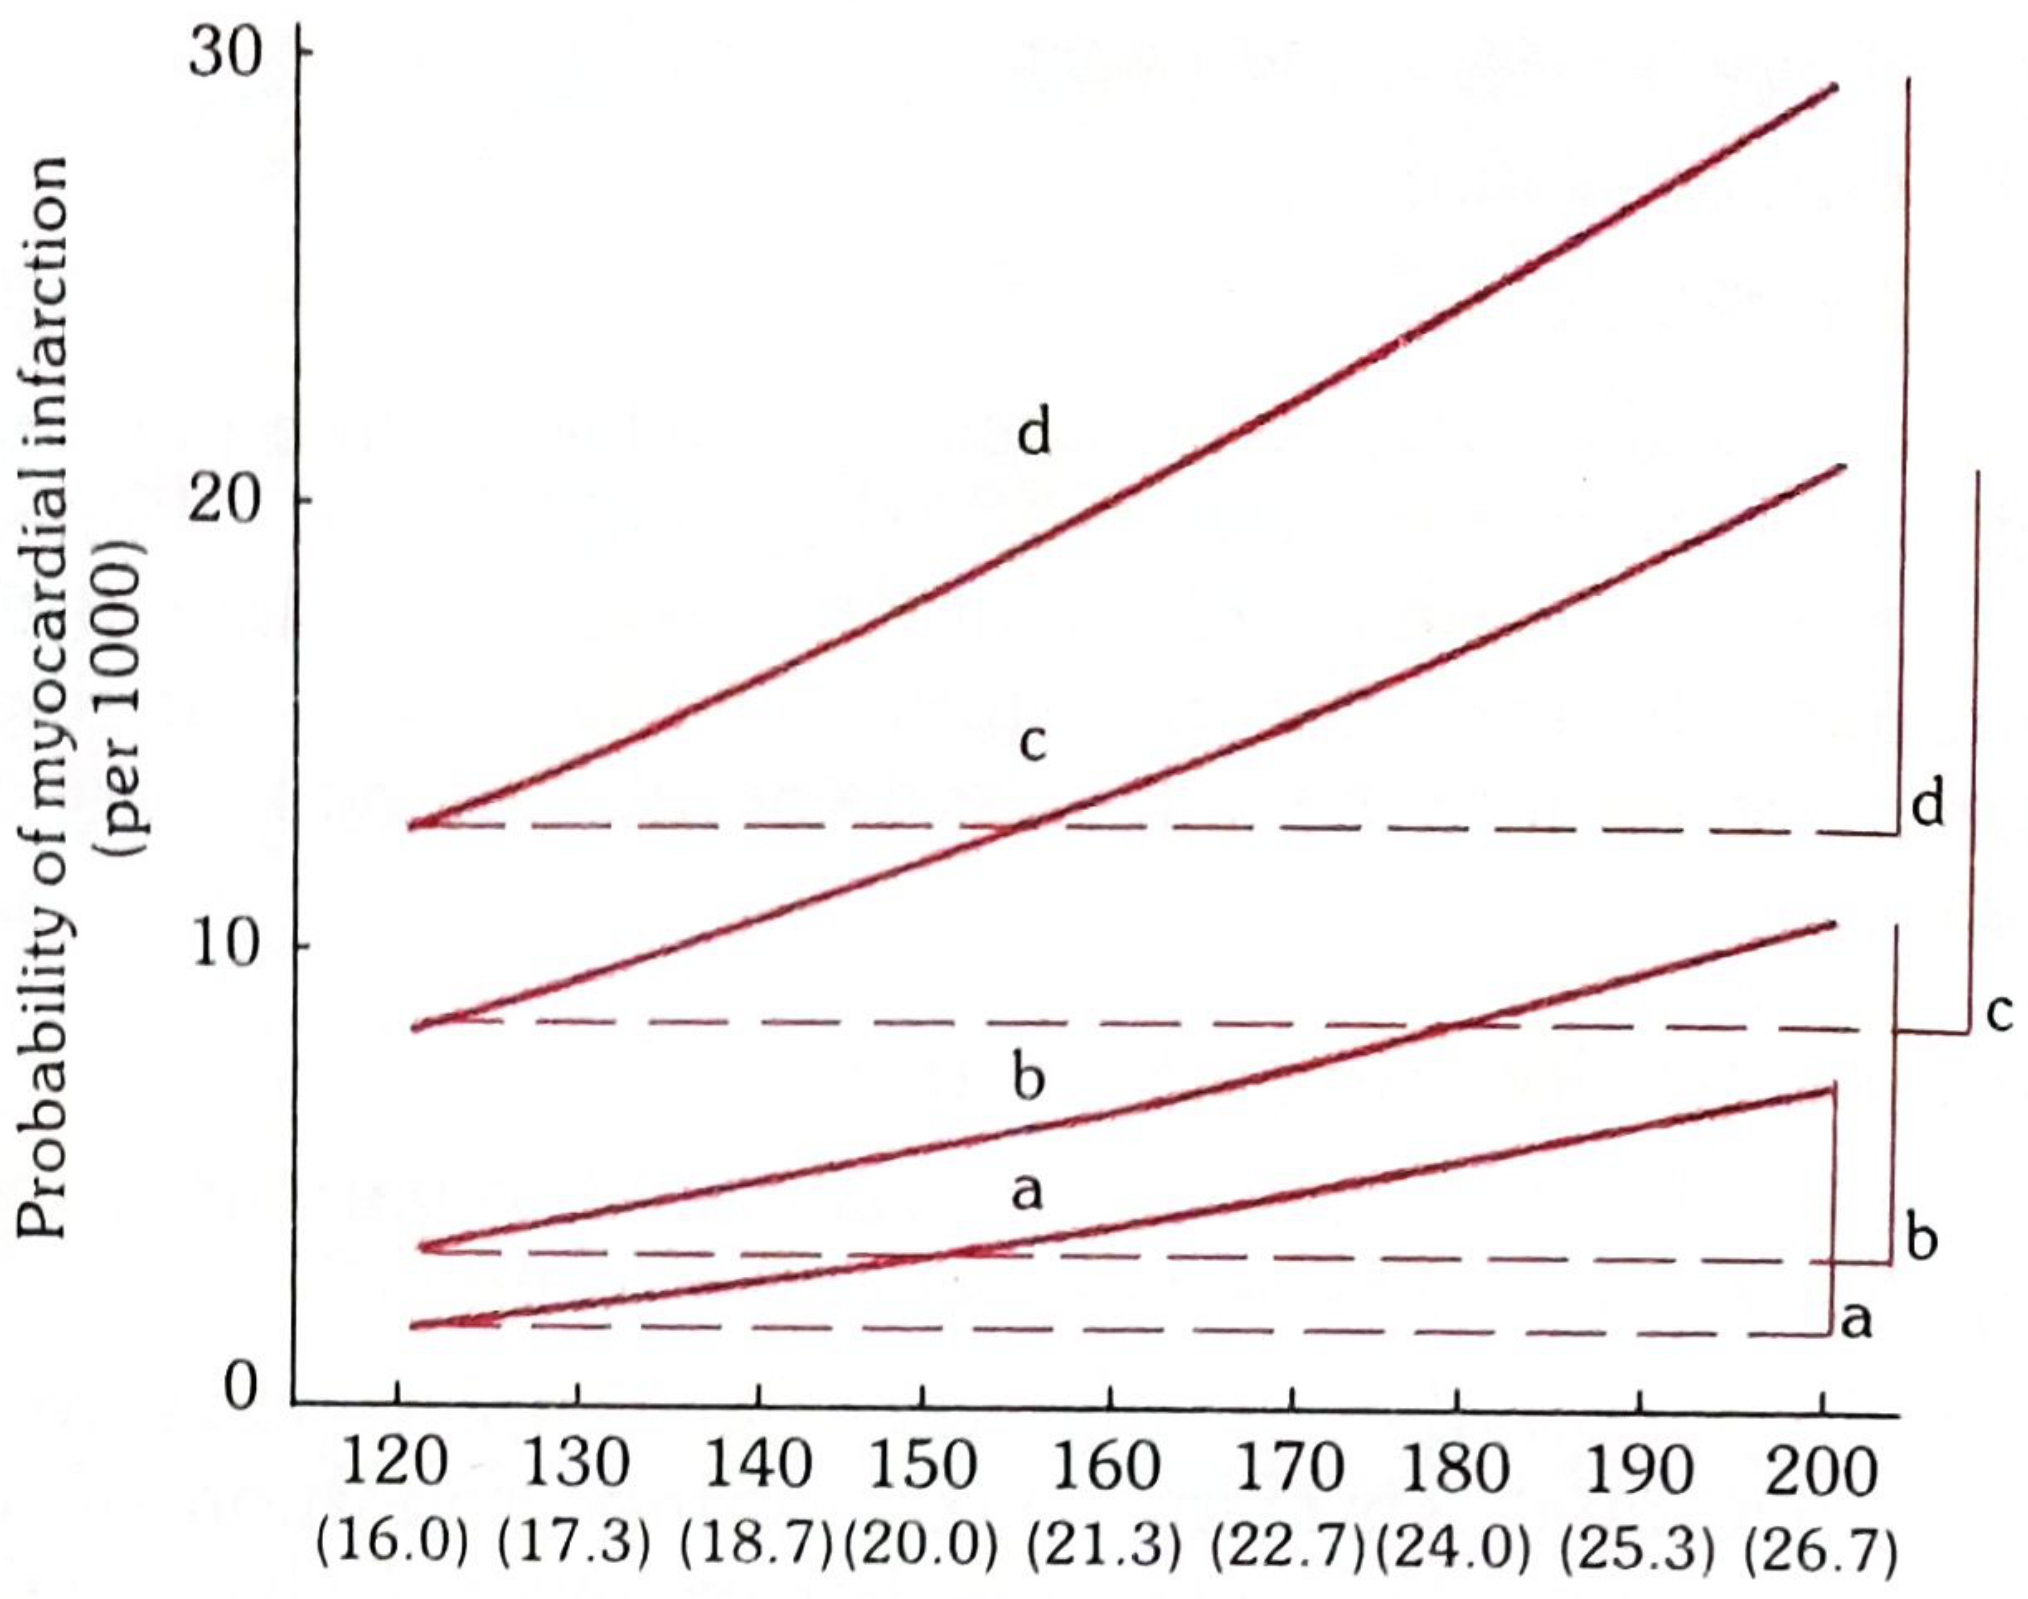
- Smoking is not only independent of, but also synergistic with other risk factors such as hypertension and elevated serum cholesterol (Fig. 1)
- Risk of CHD starts to fall soon after stopping smoking; reduced by 50% after giving up smoking
Park's FIG. 1 - Risk Factor Combinations & MI Risk
2. HYPERTENSION
- Blood pressure is the single most useful test for identifying individuals at high risk of developing CHD
- Hypertension accelerates the atherosclerotic process, especially if hyperlipidaemia is also present
- Both systolic and diastolic blood pressure are significant risk factors; many investigators feel systolic is a better predictor
- The risk role of "mild" hypertension is generally accepted
3. SERUM CHOLESTEROL
- There is a triangular relationship between habitual diet, blood cholesterol-lipoprotein levels and CHD - judged to be causal
- There is no population in which CHD is common that does not also have a relatively high mean level of cholesterol (i.e., greater than 200 mg/dL in adults)
- Seven Countries Study (14 years): Serum cholesterol is an important risk factor at levels of 220 mg/dL or more - supports the notion of a "threshold level"
- Japanese: low fat diets + low serum cholesterol + lowest incidence of CHD
- East Finns: high fat diets + high cholesterol + highest incidence of CHD
Park's FIG. 2 - Cultural Differences in Serum Cholesterol Levels
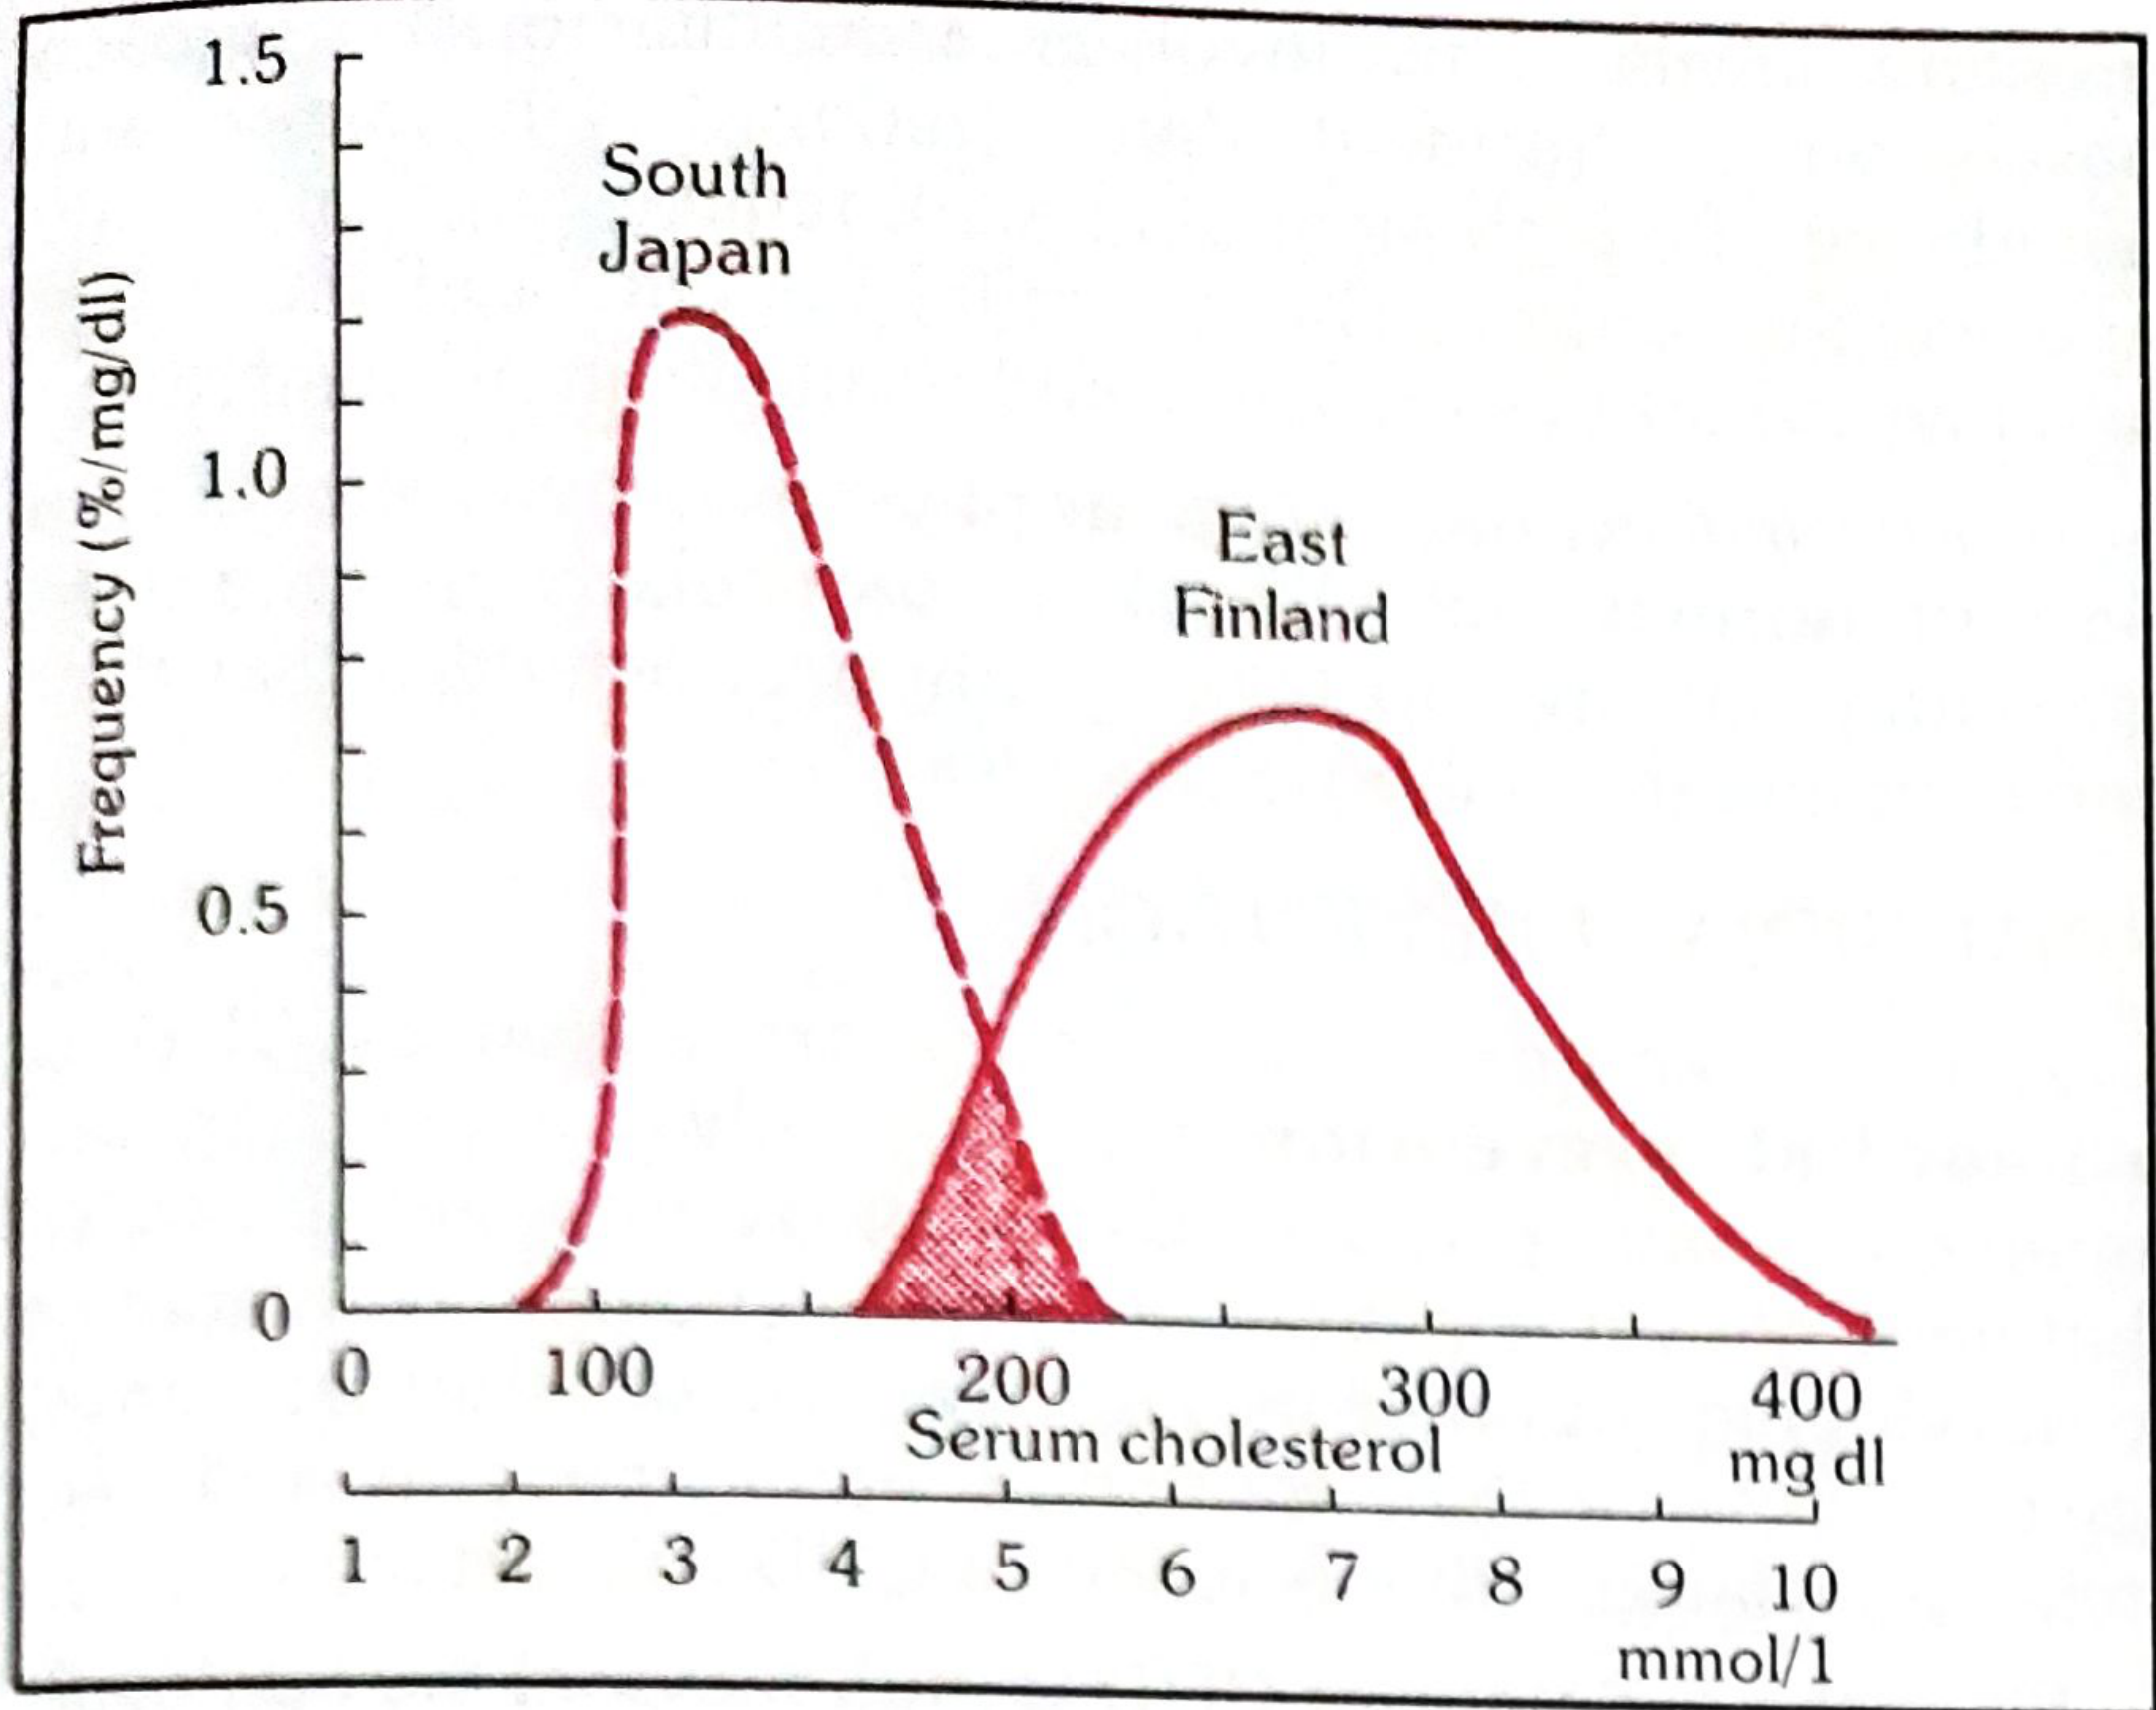
- Most serum cholesterol (close to 50%) is in LDL
- LDL - delivers cholesterol to body cells; excessive LDL leads to accumulation in smooth muscle cells of vascular system - atherogenic
- HDL - removes cholesterol from cells; protective against CHD; higher HDL = lower incidence of infarction; HDL should be >40 mg/dL
- VLDL - dominated by triglyceride content; associated with premature atherosclerosis and peripheral vascular disease
- Cholesterol/HDL ratio < 3.5 recommended as clinical goal for CHD prevention
- Measurement of apolipoproteins (Apo-AI for HDL, Apo-B for LDL) may replace lipoprotein cholesterol determinations in assessing CHD risk
- High intake of saturated fatty acids (C12, C14, C16) - raises plasma cholesterol
- Polyunsaturated fatty acids (PUFA) - lower plasma cholesterol; additionally inhibit platelet aggregation and prevent thrombus formation
- Arachidonic acid metabolizes in vascular endothelium to:
- Thromboxane - induces platelet aggregation (harmful)
- Prostacyclin - inhibits platelet aggregation + relaxes coronary blood vessels (protective)
- Linoleic acid (main precursor of arachidonic acid) = "body's best bulwark against CHD"
4. OTHER RISK FACTORS
- Risk of CHD is 2-3 times higher in diabetics than non-diabetics
- Responsible for 50% of deaths in diabetics over age 40 in industrialized countries
- Family history of CHD increases risk of premature death
- Genetic factors are probably the most important determinants of a given individual's TC and LDL levels
- Sedentary life-style associated with greater risk of early CHD
- Regular physical exercise:
- Increases HDL concentration
- Decreases body weight and blood pressure
- Pronounced difference in mortality rates between males and females suggests a hormonal basis
- Hyperestrogenemia may be the common underlying factor leading to atherosclerosis and complications (CHD, stroke, peripheral vascular disease)
- Women are relatively protected before menopause due to oestrogen
- Type A behaviour: competitive drive, restlessness, hostility, sense of urgency/impatience
- Type A individuals are more coronary prone than calmer, more philosophical Type B individuals
- High alcohol intake (≥75g/day) is an independent risk factor for CHD, hypertension and all cardiovascular diseases
- Evidence that moderate alcohol intake reduces risk of CHD is unsubstantiated
- Women using OCP have higher systolic and diastolic blood pressure
- Risk of myocardial infarction is increased by OCP; risk is compounded by cigarette smoking
- Possible role of dietary fibre, sucrose and soft water has been debated
- Dyspnoea on exertion and low vital capacity have also been cited as possible risk factors
PREVENTION OF CHD
Strategies (WHO Expert Committee):
a. POPULATION STRATEGY
- Principle: "small changes in risk factor levels in total populations can achieve the biggest reduction in mortality"
- Stop smoking - cessation of the habit should be encouraged
- Diet modification:
- Reduce total fat intake to <30% of total calories
- Reduce saturated fat to <10% of total calories
- Increase PUFA to 7-8% of total calories
- Dietary cholesterol intake should be <300 mg/day
- Increase complex carbohydrates and dietary fibre
- Reduce salt intake; avoid obesity
- Control of hypertension - detect and treat hypertension in community
- Regular physical activity - should be a part of normal daily life; important to encourage children to take up physical activities they can continue throughout their lives
- Involves preventing the emergence and spread of CHD risk factors and life-styles that have not yet appeared or become endemic
- Particularly applies to developing countries like India
- These countries should seek to preserve their traditional eating patterns and life-styles associated with low levels of CHD risk factors
- MRFIT (Multiple Risk Factor Intervention Trial) - USA
- Stanford Heart Disease Prevention Programme - California
- North Kerelia Project - Finland
b. HIGH RISK STRATEGY
- Simple tests: blood pressure measurement + serum cholesterol measurement
- Individuals at special risk: smokers, strong family history of CHD, diabetes, obesity, young women using oral contraceptives
- Bring high-risk individuals under preventive care
- Motivate them to take positive action against all identified risk factors:
- Elevated BP should be treated
- Help patient break smoking habit permanently (nicotine chewing gum can be tried)
- Reduce serum cholesterol in those in whom it is raised
- More than half of CHD cases occur in those who are not apparently at special risk - this is one limitation
- Intervention may reduce disease in a high-risk group but may not reduce disease to the same extent in the general population
- Oslo Heart Study
- Lipid Research Clinics Study (USA)
c. SECONDARY PREVENTION
- Secondary prevention must be seen as a continuation of primary prevention
- Aim: to prevent recurrence and progression of CHD
- Includes:
- Modification of all risk factors
- Beta-blockers after myocardial infarction
- Antiplatelet therapy (aspirin)
- Cardiac rehabilitation
- Regular follow-up
SUMMARY - HIGH-YIELD EXAM POINTS
- CHD definition = impairment of heart function due to inadequate blood flow caused by obstructive changes in coronary circulation
- WHO called CHD the modern "epidemic" - affects populations, not an unavoidable attribute of ageing
- Case fatality rate defined as proportion of attacks fatal within 28 days
- 55% of cardiac deaths occur within the first hour
- Highest global CHD mortality = Western Pacific Region
- In India, CHD prevalence: Urban = 6.4%; Rural = 2.5%
- Most important single risk factor for identifying individuals at high risk = Blood pressure
- Triangular relationship: Diet → Cholesterol → CHD (WHO Expert Committee - causal)
- LDL = atherogenic; HDL = protective (>40 mg/dL); Cholesterol/HDL ratio < 3.5 is clinical goal
- Linoleic acid = "body's best bulwark against CHD"
- Smoking responsible for 25% of CHD deaths under age 65; risk falls by 50% after stopping
- Type A personality = coronary prone
- Alcohol ≥ 75g/day = independent risk factor for CHD
- Primordial prevention = preventing emergence of risk factors before they appear (especially for developing countries)
- Prevention strategies: Population strategy (primordial + general) + High-risk strategy + Secondary prevention

Epidemiology in the patterns of the following picture
Which disease's epidemiology do you want written in this pattern? · How many marks?
Chd
CHD is an NCD - which pattern should I follow?
EPIDEMIOLOGY OF CORONARY HEART DISEASE (CHD)
(15 Marks | As per Park's PSM)
1. INTRODUCTION
- CHD (syn: Ischaemic Heart Disease) is defined as:
"Impairment of heart function due to inadequate blood flow to the heart compared to its needs, caused by obstructive changes in the coronary circulation"
- WHO called CHD the modern "epidemic" - it affects populations, not an unavoidable attribute of ageing
- Cause of 25-30% of deaths in most industrialized countries
2. PROBLEM STATEMENT
- With 9,433 thousand deaths, CHD accounts for 16.6% of all deaths globally (2016)
- Most frequent single cause of death among men under 65 in many developed countries
- Epidemic of CHD began in USA - early 1920s, Britain - 1930s, European countries - still later
- Developing countries are currently catching up
- USA showed a 25% fall in mortality (not morbidity) by 1980 - due to lifestyle changes + better hypertension control
- WHO MONICA Project (41 centres, 26 countries) was undertaken to study these trends
- Originally a disease of higher social classes in affluent societies
- Now there is a strong inverse relation between social class and CHD in developed countries
- 25-28% of patients who suffer a heart attack die suddenly
- 55% of all cardiac deaths occur within the first hour
- Case fatality rate = proportion of attacks fatal within 28 days of onset
3. CHD IN INDIA
- Considerable increase in prevalence in urban areas in the last decade
- Urban prevalence: 6.4% (male 6.1%, female 6.7%)
- Rural prevalence: 2.5% (male 2.1%, female 2.7%)
- 25.1% of total deaths in urban areas are attributable to diseases of the circulatory system
- 16,08,700 people died of CHD during 2016; crude death rate = 121.5/100,000 population
4. EPIDEMIOLOGICAL DETERMINANTS / RISK FACTORS
"The aetiology of CHD is multifactorial"
Park's TABLE 2 - Risk Factors for CHD
| Not Modifiable | Modifiable |
|---|---|
| Age | Cigarette smoking |
| Sex | High blood pressure |
| Family history | Elevated serum cholesterol |
| Genetic factors | Diabetes |
| Personality (?) | Obesity, Sedentary habits, Stress |
1. Smoking
- Responsible for 25% of CHD deaths under age 65 in men
- Mechanisms: CO-induced atherogenesis; nicotine raises BP + myocardial O₂ demand; fall in protective HDL
- Especially causes sudden death in men under 50 years
- Risk synergistic with hypertension and elevated cholesterol (Park's Fig. 1)
- Risk reduced by 50% after giving up smoking
2. Hypertension
- Single most useful test for identifying individuals at high risk of CHD
- Both systolic and diastolic BP are significant; systolic is considered a better predictor
- Accelerates atherosclerotic process, especially if hyperlipidaemia is also present
3. Serum Cholesterol
- Triangular relationship: Diet → Cholesterol → CHD (WHO Expert Committee - causal)
- No population in which CHD is common does NOT have high mean cholesterol (>200 mg/dL)
- Seven Countries Study: Japan (low fat, low cholesterol, low CHD) vs East Finland (high fat, high cholesterol, high CHD)
- LDL - atherogenic; delivers cholesterol to smooth muscle cells of vascular system
- HDL - protective (>40 mg/dL); removes cholesterol from cells
- Cholesterol/HDL ratio < 3.5 = clinical goal for CHD prevention
- Saturated fats (C12, C14, C16) - raise plasma cholesterol
- PUFA - lower plasma cholesterol; inhibit platelet aggregation
- Linoleic acid = "body's best bulwark against CHD"
- Arachidonic acid → Prostacyclin (protective) vs Thromboxane (harmful)
4. Other Risk Factors
- Diabetes - CHD risk is 2-3 times higher in diabetics
- Physical inactivity - sedentary lifestyle increases CHD risk; exercise increases HDL + reduces BP
- Type A personality - competitive, hostile, impatient - more coronary prone than Type B
- Alcohol - ≥75g/day is an independent risk factor for CHD
- Oral contraceptives - increase BP + MI risk; risk compounded by smoking
- Genetic factors - most important determinants of TC and LDL levels in an individual
5. PREVENTION AND CONTROL
a. Population Strategy
- Stop smoking - cessation encouraged at community level
- Diet modification:
- Total fat < 30% of total calories
- Saturated fat < 10% of total calories
- PUFA = 7-8% of total calories
- Dietary cholesterol < 300 mg/day
- Increase complex carbohydrates + dietary fibre; reduce salt; avoid obesity
- Control of hypertension - detect and treat at community level
- Regular physical activity - part of normal daily life; encourage children to adopt lifelong habits
- Prevent emergence and spread of risk factors before they become endemic
- Especially for developing countries like India
- Preserve traditional eating patterns and lifestyles associated with low CHD risk
- MRFIT (Multiple Risk Factor Intervention Trial) - USA
- Stanford Heart Disease Prevention Programme - California
- North Kerelia Project - Finland
b. High Risk Strategy
- Those at special risk: smokers, strong family history, diabetes, obesity, women on OCP
- Treat elevated BP
- Help break smoking habit (nicotine chewing gum)
- Reduce serum cholesterol in those with raised levels
c. Secondary Prevention
- Aim: prevent recurrence and progression of CHD
- Modify all risk factors; beta-blockers post-MI; antiplatelet therapy; cardiac rehabilitation; regular follow-up
HIGH-YIELD EXAM POINTS
- CHD = modern "epidemic" (WHO)
- Case fatality = attacks fatal within 28 days; 55% deaths within first hour
- India: Urban CHD = 6.4%; Rural = 2.5%
- Most useful single test for high-risk identification = Blood pressure
- LDL = bad; HDL = good (>40 mg/dL); Cholesterol/HDL ratio goal = <3.5
- Linoleic acid = "body's best bulwark against CHD"
- Smoking + hypertension + high cholesterol = synergistic risk
- Primordial prevention = most relevant concept for developing countries
- 3 strategies: Population (including primordial) + High-risk + Secondary prevention
Prevention in congugation with National Programme for Prevention and Control of Non-Communicable Diseases (NP-NCD)
PREVENTION OF CHD IN CONJUGATION WITH NP-NCD
(As per Park's PSM - NPCDCS Framework)
BACKGROUND
- India is experiencing a rapid health transition with a large and rising burden of chronic NCDs - especially cardiovascular disease, diabetes mellitus, cancer, stroke and chronic lung diseases
- NCDs accounted for 60% of deaths in India in 2016
- The existing health system was mainly focused on communicable diseases
- This led to the need for a dedicated national programme
NPCDCS - NATIONAL PROGRAMME FOR PREVENTION AND CONTROL OF CANCER, DIABETES, CARDIOVASCULAR DISEASES AND STROKE
- Started as National Programme for Prevention and Control of Diabetes, Cardiovascular Diseases and Stroke
- Later integrated with National Cancer Control Programme
- Resulting in NPCDCS
- During 11th Five Year Plan: 100 identified districts in 21 states covered
- During 12th Five Year Plan: Expanded to cover all districts of the country in a phased manner
DCS COMPONENT (Diabetes, Cardiovascular Disease and Stroke) under NPCDCS
- Health promotion
- Capacity building including human resource development
- Early diagnosis and management
- Integration with the primary health care system
OBJECTIVES OF NPCDCS
- Prevent and control common NCDs through behaviour and lifestyle changes
- Provide early diagnosis and management of common NCDs
- Build capacity at various levels of health care for prevention, diagnosis and treatment
- Train human resources within public health setup - doctors, paramedics, nursing staff
- Establish and develop capacity for palliative and rehabilitative care
STRATEGIES UNDER NPCDCS
- Implementation in 20,000 sub-centres and 700 CHCs in 100 districts across 21 States/UTs
- Promoting healthy lifestyle through massive health education and mass media at country level
- Opportunistic screening of persons above age of 30 years
- Establishment of NCD Clinic at CHC and District level
- Development of trained manpower
- Strengthening of tertiary level health facilities
- Service delivery through existing public health infrastructure for long-term sustainability
- Increased intake of healthy foods
- Increased physical activity
- Avoidance of tobacco and alcohol
- Stress management
ACTIVITIES AT EACH LEVEL
Sub-Centre Level
- Health promotion - camps, interpersonal communications, posters, banners for behaviour and lifestyle change
- Opportunistic screening of population above 30 years using BP measurement and blood glucose by strip method
- Suspected cases of diabetes and hypertension referred to CHC
- Glucometer, test strips and auto-disabled lancets procured centrally and provided to states
CHC Level (NCD Clinic at CHC)
- Diagnosis by required investigations:
- Blood sugar measurement
- Lipid profile
- Ultrasound, X-ray, ECG
- Management and stabilization of common CVD, diabetes and stroke cases (both outpatient and inpatient)
- One designated nurse undertakes home visits for bedridden cases and supervises health workers
- Complicated cases of diabetes, high BP referred upward to district hospital
District Hospital Level (NCD Clinic at District Hospital)
- Screen persons above 30 years for diabetes, hypertension, CVDs
- Identify individuals at high-risk warranting further investigation
- Detailed investigation of high-risk individuals and those referred from CHCs
- Regular management and annual assessment of persons with cancer, diabetes, hypertension
- Management of people with established cardiovascular diseases
- Provide home-based palliative care for chronic, debilitating and progressive patients
- Promote healthy lifestyle through health education and counselling to patients and attendants
URBAN HEALTH CHECK-UP SCHEME (for Diabetes and High Blood Pressure)
- Screen urban slum population for diabetes and high blood pressure
- Create database for prevalence of diabetes and high BP in urban slums
- Sensitize the urban slum population about healthy lifestyle
- Blood sugar and BP checked for all persons ≥30 years and all pregnant women of all ages
NCD CELLS (Administrative Framework)
- National NCD Cell - established at the Centre
- State NCD Cells - implement and monitor NPCDCS at state level
- District NCD Cells - monitor at district level
Park's TABLE 17 - Comparative Progress in Achievements (2014-2015)
| Facilities | 31st March 2014 | September 2015 |
|---|---|---|
| State NCD Cells | 21 | 36 |
| District NCD Cells | 96 | 195 |
| District NCD Clinics | 95 | 201 |
| District CCU Facilities | 51 | 65 |
| District Day Care Centres | 38 | 61 |
| CHC NCD Clinics | 204 | 1362 |
NEW INITIATIVES UNDER NPCDCS
- Intervention for prevention and control of Rheumatic Heart Disease under NPCDCS and Rashtriya Bal Swasthya Karyakram (RBSK)
- Integration of AYUSH with NPCDCS
- Integration of RNTCP with NPCDCS - to articulate a national strategy for management of TB and diabetes comorbidities in India
GUIDELINES FOR REFERRAL AND TREATMENT (Govt of India Operational Guidelines 2016)
- Systolic BP >140 mmHg OR diastolic BP >90 mmHg OR random blood sugar ≥140 mg/dL → referred to medical officer at nearest facility for confirmation and treatment
- Those positive for cancer/precancerous lesions → referred by ANM/Staff Nurse to PHC/CHC/District Hospital
- Once diagnosis of hypertension/diabetes is established → patient receives at least 1 month's drug supply from PHC; stable patients may receive 3-month supply
- First follow-up at PHC → end of first 3 months after diagnosis
- Annual specialist consultation at nearest nodal CHC with NCD clinic
- Community follow-up by ASHA - home visits, positive behaviour modifications, treatment compliance, encourage regular BP/blood glucose check-ups at sub-centre
- ASHA prioritizes households with treatment defaulters or complications
- Goal: minimize treatment defaulters + achieve hypertension and glycaemic control at individual and population level
- ANM also conducts regular home visits
WHO GLOBAL MONITORING FRAMEWORK FOR NCD PREVENTION AND CONTROL (2013-2020)
Park's TABLE 18 - Indicators and Targets for NCD Prevention and Control in India
| Framework Element | Target | 2020 | 2025 |
|---|---|---|---|
| Premature mortality from NCDs | Relative reduction in overall mortality from CVD, cancer, diabetes, chronic respiratory disease | 10% | 25% |
| Alcohol use | Relative reduction in alcohol use | 5% | 10% |
| Obesity and diabetes | Halt the rise in obesity and diabetes prevalence | No mid-term target | Halt the rise |
| Physical inactivity | Relative reduction in prevalence of insufficient physical activity | 5% | 10% |
| Raised blood pressure | Relative reduction in prevalence of raised blood pressure | 10% | 25% |
| Salt/sodium intake | Reduction in mean population intake of salt to <5 g/day | 20% | 30% |
| Tobacco use | Relative reduction in prevalence of tobacco use | 15% | 30% |
| Drug therapy (heart attacks and strokes) | Eligible people receiving drug therapy + counselling | 30% | 50% |
| Essential NCD medicines | Availability and affordability in public + private facilities | 60% | 80% |
INTERVENTIONS TO REDUCE CVD BURDEN (Park - WHO Recommendations)
Primary Prevention
- Comprehensive tobacco control policies
- Taxation to reduce intake of foods high in fat, sugar and salt
- Building walking and cycle paths to increase physical activity
- Strategies to reduce harmful use of alcohol
- Providing healthy school meals to children
- Targeted to those at high total cardiovascular risk or those with single risk factor above threshold (hypertension, hypercholesterolaemia)
- Targeting total CVD risk is more cost-effective than treating individual risk factors
- Feasible in primary care in low-resource settings, including by non-physician health workers
Secondary Prevention
- Aspirin
- Beta-blockers
- ACE inhibitors
- Statins
When used together with smoking cessation, nearly 75% of recurrent vascular events may be prevented
- Coronary artery bypass
- Balloon angioplasty (small balloon-like device threaded through artery to open blockage)
- Valve repair and replacement
- Heart transplantation
HIGH-YIELD EXAM POINTS
- NPCDCS = Cancer + Diabetes + Cardiovascular Diseases + Stroke
- NCDs caused 60% of deaths in India in 2016
- Opportunistic screening from age ≥30 years under NPCDCS
- Referral threshold: SBP >140, DBP >90, RBS ≥140 mg/dL
- NCD Cells: National → State → District level
- ASHA role = community follow-up, treatment compliance, home visits
- WHO target: Salt intake < 5 g/day; reduce tobacco use by 30% by 2025
- Secondary prevention drugs: Aspirin + Beta-blocker + ACE inhibitor + Statin
- These 4 drugs + smoking cessation = 75% reduction in recurrent vascular events

Add a note on National Programme for Prevention and Control of Non-Communicable Diseases (NP-NCD)
NP-NCD National Programme Prevention Control Non-Communicable Diseases India 2023 components objectives
NATIONAL PROGRAMME FOR PREVENTION AND CONTROL OF NON-COMMUNICABLE DISEASES (NP-NCD)
(Health Programme Template | As per Park's PSM + Updated Operational Guidelines 2023)
1. DISEASES COVERED UNDER THE PROGRAMME
- Cardiovascular Diseases (CVD) including Coronary Heart Disease
- Diabetes Mellitus
- Cancer (including oral, breast, cervical)
- Stroke
- Hypertension
- Chronic Kidney Disease (CKD)
- Non-Alcoholic Fatty Liver Disease (NAFLD)
- Chronic Respiratory Diseases
2. ORIGINS
- India experiencing rapid health transition with rising burden of NCDs
- NCDs accounted for 60% of deaths in India in 2016 (62% by ICMR data)
- Existing health system was mainly focused on communicable diseases
- Need was felt for a dedicated NCD programme
- Started as National Programme for Prevention and Control of Diabetes, Cardiovascular Diseases and Stroke
- Integrated with National Cancer Control Programme → became NPCDCS (2010)
- In May 2023 → renamed and upgraded to NP-NCD (2023-2030) by Ministry of Health and Family Welfare, Government of India
- NP-NCD better reflects the NCD burden by addressing a wider array of NCDs including CKD and NAFLD
3. TARGET POPULATION
- All persons ≥ 30 years - opportunistic screening for diabetes, hypertension and CVD
- All pregnant women of all ages - screening for diabetes and hypertension
- Persons with established NCDs - for management and follow-up
- Urban slum population (under Urban Health Check-up Scheme)
- High-risk individuals - family history, obesity, smokers
4. ORGANIZATIONAL FRAMEWORK
- Programme operated under National Health Mission (NHM)
- Funded under Common NCD Flexi-Pool of NHM
- Centre to State funding ratio = 60:40
- NCD Cells established at three levels:
- National NCD Cell - Central government level
- State NCD Cells - State level
- District NCD Cells - District level
- NCD Clinics established at:
- Community Health Centres (CHC)
- District Hospitals
- Cardiac Care Units (CCU) set up for emergency cardiac care
- Day Care Centres for cancer care
- States incorporate budget within State NHM Programme Implementation Plan (PIP)
5. COMPONENTS OF THE PROGRAMME
- (a) Diabetes, Cardiovascular Disease and Stroke (DCS) component
- (b) Cancer component - screening for oral, breast and cervical cancer
- (c) Urban Health Check-up Scheme - for diabetes and hypertension in urban slums
- (d) Capacity Building - training of doctors, paramedics, ANMs, ASHAs, NCD programme managers
- (e) NCD Surveillance - ongoing systematic collection, analysis and interpretation of data
- (f) IEC/BCC (Information, Education, Communication / Behavioural Change Communication)
- (g) Supply Chain Management - drugs, equipment, diagnostics at all levels
- (h) Monitoring and Evaluation - uniform ICT application across India
6. AIMS / GOALS
- Reduce premature mortality from CVD, cancer, diabetes and chronic respiratory disease by 25% by 2025 (WHO target)
- Halt the rise in obesity and diabetes prevalence
- Reduce tobacco use by 30% by 2025
- Reduce salt intake to <5 g/day
- Ensure 80% availability of essential NCD medicines in public and private facilities by 2025
- 50% eligible people receiving drug therapy and counselling for heart attacks and strokes by 2025
7. OBJECTIVES
- Health promotion through behaviour change with involvement of community, civil society, community-based organizations, media and development partners
- Screening, early diagnosis, management, referral and follow-up at each level of healthcare delivery to ensure continuum of care
- Build capacity of health care providers at various levels for prevention, early diagnosis, treatment, follow-up, rehabilitation, IEC/BCC, monitoring, evaluation and research
- Strengthen supply chain management for drugs, equipment and logistics for diagnosis and management at all health care levels
- Monitoring, supervision and evaluation of programme through proper implementation of uniform ICT application across India
- Multi-sectoral coordination - involving multiple sectors for NCD prevention
8. STRATEGIES ADOPTED
Surveillance
- Ongoing systematic collection, analysis, interpretation and timely dissemination of information for action
- Key objectives:
- Trigger public health control measures
- Monitor changes in chronic disease presentation and risk factors
- Facilitate planning and implementation of programme
- Enrolment with ABHA-ID (Ayushman Bharat Health Account) creation for tracking
Disease Management
- Opportunistic screening of all persons ≥30 years using:
- BP measurement
- Blood glucose by strip method (glucometer)
- Lipid profile
- ECG
- Screening at Sub-centre, CHC and District Hospital levels
- Cancer screening: oral, breast and cervical cancers
- Urban Health Check-up Scheme - screen urban slum population ≥30 years + all pregnant women
- Referral threshold: SBP >140 mmHg, DBP >90 mmHg, RBS ≥140 mg/dL
- Medical officer at PHC confirms diagnosis and initiates treatment
- Minimum 1 month drug supply from PHC; stable patients may get 3-month supply
- Secondary prevention drugs for established CVD: Aspirin + Beta-blocker + ACE inhibitor + Statin
- Surgical interventions when required: CABG, balloon angioplasty, valve repair, heart transplant
- Sub-centre → CHC (for suspected cases of diabetes, hypertension)
- CHC → District Hospital (for complicated cases)
- District Hospital → Tertiary care centre (for specialist care)
- First follow-up at PHC after 3 months of diagnosis; annual specialist consultation at CHC
- Cardiac Care Units (CCU) at district level for emergency cardiac care
- Day Care Centres for cancer chemotherapy
- STEMI (ST Elevation Myocardial Infarction) Project for rapid response to acute MI
Integrated Vector Management
- Not applicable (NCDs are non-communicable)
Supportive Interventions
- Patients on private treatment offered choice of taking drugs from public health system
- Monitored for compliance and recorded in health card
- Private practitioners coordinated with public health system
- Integration of AYUSH with NPCDCS/NP-NCD
- Integration of RNTCP with NPCDCS - national strategy for management of TB and diabetes comorbidities
- Integration with Rashtriya Bal Swasthya Karyakram (RBSK) for Rheumatic Heart Disease
- Co-ordination with food, agriculture, education sectors for lifestyle modification
- Massive health education and mass media efforts at country level
- Behavioural change messages:
- Increased intake of healthy foods
- Increased physical activity
- Avoidance of tobacco and alcohol
- Stress management
- Camps, interpersonal communications, posters, banners at Sub-centre level
- Essential NCD drugs provided free through public health system
- Drugs include anti-hypertensives, anti-diabetics, aspirin, statins, beta-blockers, ACE inhibitors
- Supply chain strengthened for drugs, equipment and diagnostics at all levels
9. INCENTIVES PROVIDED
- Free drugs for NCDs provided at PHC and above
- ASHA undertakes home visits for community follow-up and compliance monitoring (paid per visit)
- Free diagnostic services at CHC and District Hospital (blood sugar, lipid profile, ECG, X-ray, ultrasound)
- Cancer Diagnosis Vans in districts for rural cancer diagnosis
10. RECEPTION AND RESULTS
| Facilities | March 2014 | September 2015 |
|---|---|---|
| State NCD Cells | 21 | 36 |
| District NCD Cells | 96 | 195 |
| District NCD Clinics | 95 | 201 |
| District CCU Facilities | 51 | 65 |
| District Day Care Centres | 38 | 61 |
| CHC NCD Clinics | 204 | 1362 |
- Programme under implementation in all 36 States/UTs as of September 2015
- Expanded to cover all districts during 12th Five Year Plan
11. CASE CONTROL AND MANAGEMENT
- Community follow-up by ASHA - home visits for positive behaviour modifications, treatment compliance, encouraging regular BP/blood glucose check-ups
- ASHA prioritizes households with treatment defaulters or complications
- ANM conducts regular home visits
- Annual specialist consultation at nearest nodal CHC with NCD Clinic
- Monitoring for compliance with treatment/lifestyle changes
- Recording in health card maintained for each patient
- Aim: minimize treatment defaulters + achieve hypertension and glycaemic control at individual and population level
12. MISCELLANEOUS
- NP-NCD is funded under Common NCD Flexi-Pool of NHM; states have flexibility to assign funds within overall NCD allocation
- WHO Global Monitoring Framework for NCDs (2013-2020) endorsed by World Health Assembly in May 2013 - 9 voluntary targets adopted by India
- POSHAN Abhiyaan and Ayushman Bharat - Health and Wellness Centres (AB-HWC) are convergent programmes that address NCD risk factors at community level
- Tobacco taxation and COTPA (Cigarettes and Other Tobacco Products Act) are legislative measures supporting NP-NCD
- Target: Reduce premature mortality from major NCDs by 25% by 2025 and 33% by 2030
HIGH-YIELD EXAM POINTS
- NPCDCS → renamed NP-NCD in May 2023 (2023-2030)
- New NCDs added: CKD and NAFLD
- Screening starts from age ≥30 years
- Funding: 60:40 (Centre:State) under NHM NCD Flexi-Pool
- Referral threshold: BP >140/90, RBS ≥140 mg/dL
- Secondary prevention drugs: Aspirin + Beta-blocker + ACE inhibitor + Statin
- These 4 drugs + smoking cessation = 75% reduction in recurrent vascular events
- WHO target: Salt <5 g/day; reduce tobacco use by 30% by 2025
- Key new initiative: Integration of RNTCP + NPCDCS for TB-Diabetes comorbidity management
For 8 marks
NATIONAL PROGRAMME FOR PREVENTION AND CONTROL OF NON-COMMUNICABLE DISEASES (NP-NCD)
(8 Marks | Health Programme Template)
1. DISEASES COVERED
- Cardiovascular Diseases (CVD/CHD), Diabetes Mellitus, Cancer (oral, breast, cervical), Stroke, Hypertension, Chronic Kidney Disease (CKD), Non-Alcoholic Fatty Liver Disease (NAFLD), Chronic Respiratory Diseases
2. ORIGINS
- NCDs accounted for 60% of deaths in India in 2016
- Started as programme for Diabetes, CVD and Stroke → integrated with National Cancer Control Programme → became NPCDCS (2010)
- In May 2023, renamed and upgraded to NP-NCD (2023-2030) by MoHFW, Govt. of India
- Expanded to cover all districts during 12th Five Year Plan
3. TARGET POPULATION
- All persons ≥30 years - opportunistic screening
- All pregnant women of all ages
- Persons with established NCDs - for management and follow-up
- Urban slum population
4. ORGANIZATIONAL FRAMEWORK
- Under National Health Mission (NHM), funded under Common NCD Flexi-Pool
- Funding ratio = Centre: State = 60:40
- NCD Cells at National → State → District level
- NCD Clinics at CHC and District Hospital level
- Cardiac Care Units (CCU) for emergency cardiac care
- States incorporate budget within State NHM Programme Implementation Plan (PIP)
5. OBJECTIVES (NP-NCD Operational Guidelines 2023-2030)
- Health promotion through behaviour change - community, civil society, media and development partners
- Screening, early diagnosis, management, referral and follow-up at each level to ensure continuum of care
- Build capacity of health care providers at all levels
- Strengthen supply chain for drugs, equipment and logistics
- Monitoring, supervision and evaluation through uniform ICT application across India
- Multi-sectoral coordination
6. STRATEGIES ADOPTED
Surveillance
- Ongoing systematic collection, analysis and interpretation of data
- Enrolment with ABHA-ID creation for tracking
- Triggers public health control measures and facilitates planning
Disease Management
- Opportunistic screening ≥30 years using BP measurement, blood glucose (strip method), lipid profile, ECG
- Cancer screening: oral, breast and cervical cancers
- Urban Health Check-up Scheme for urban slum population
- Referral threshold: SBP >140 mmHg, DBP >90 mmHg, RBS ≥140 mg/dL → referred to Medical Officer
- Minimum 1 month drug supply from PHC; stable patients get 3-month supply
- Secondary prevention drugs for CVD: Aspirin + Beta-blocker + ACE inhibitor + Statin
- These 4 drugs + smoking cessation = 75% reduction in recurrent vascular events
- Sub-centre → CHC → District Hospital → Tertiary care (stepwise referral)
- First follow-up at PHC at 3 months; annual specialist consultation at CHC NCD Clinic
- Public Private Partnership - patients on private treatment offered free public system drugs
- Inter-sectoral convergence:
- Integration of AYUSH with NP-NCD
- Integration of RNTCP + NPCDCS for TB-Diabetes comorbidity management
- Linkage with RBSK for Rheumatic Heart Disease
- IEC/BCC (Drug Administration / Health Education):
- Healthy food intake, physical activity, avoidance of tobacco and alcohol, stress management
- Camps, posters, banners, interpersonal communication at Sub-centre level
7. RECEPTION AND RESULTS (Park's Table 17)
| Facilities | March 2014 | September 2015 |
|---|---|---|
| State NCD Cells | 21 | 36 |
| District NCD Clinics | 95 | 201 |
| CHC NCD Clinics | 204 | 1362 |
| District CCU Facilities | 51 | 65 |
- Programme under implementation in all 36 States/UTs
8. CASE CONTROL AND MANAGEMENT
- ASHA - community follow-up; home visits; treatment compliance; BP/blood glucose check-up at sub-centre
- ASHA prioritizes treatment defaulters and complicated cases
- ANM - regular home visits
- Health card maintained for each patient
- Goal: minimize defaulters + achieve hypertension and glycaemic control at individual and population level
9. MISCELLANEOUS
- WHO targets (2025): Reduce NCD premature mortality by 25%; salt intake <5 g/day; tobacco use reduction by 30%
- STEMI Project under NP-NCD for rapid response to acute MI
- Cancer Diagnosis Vans deployed in districts for rural cancer screening
HIGH-YIELD POINTS
- NPCDCS → NP-NCD from May 2023
- New additions: CKD and NAFLD
- Screening age: ≥30 years
- Funding: 60:40 Centre:State
- Referral threshold: BP >140/90, RBS ≥140 mg/dL
- Key integration: RNTCP + NPCDCS for TB-DM comorbidity
For 8 marks u can remove some headings and points to score me a full marks acc to park textbook of spm
NP-NCD (NPCDCS)
(8 Marks | As per Park's PSM)
ORIGINS
- India is experiencing rapid health transition with large and rising burden of NCDs - especially cardiovascular disease, diabetes mellitus, cancer, stroke and chronic lung diseases
- NCDs accounted for 60% of deaths in India in 2016
- Existing health system was mainly focused on communicable diseases
- Started as programme for Diabetes, CVD and Stroke → integrated with National Cancer Control Programme → became NPCDCS (2010)
- In May 2023 renamed to NP-NCD (2023-2030)
DISEASES COVERED
TARGET POPULATION
- All persons ≥30 years for opportunistic screening
- All pregnant women of all ages
- Urban slum population (Urban Health Check-up Scheme)
OBJECTIVES
- Prevent and control NCDs through behaviour and lifestyle changes
- Provide early diagnosis and management
- Build capacity at various levels of health care
- Train human resources - doctors, paramedics, nursing staff
- Establish capacity for palliative and rehabilitative care
STRATEGIES ADOPTED
Surveillance
- Ongoing systematic collection, analysis and interpretation of data linked to NP-NCD programme
- Triggers public health control measures; facilitates planning and implementation
Disease Management
- Opportunistic screening of persons ≥30 years using BP measurement and blood glucose by strip method
- Lipid profile, ECG, ultrasound, X-ray at CHC level
- Cancer screening at sub-centre and CHC level
- Referral threshold: SBP >140 mmHg, DBP >90 mmHg, RBS ≥140 mg/dL → referred to Medical Officer
- Minimum 1 month drug supply from PHC; stable patients get 3-month supply
- Secondary prevention drugs: Aspirin + Beta-blocker + ACE inhibitor + Statin
- Aspirin + Beta-blocker + ACE inhibitor + Statin + Smoking cessation = 75% reduction in recurrent vascular events
- Sub-centre → CHC → District Hospital → Tertiary care (stepwise)
- First follow-up at PHC at 3 months; annual specialist consultation at CHC NCD Clinic
Supportive Interventions
- Patients on private treatment offered choice of free drugs from public health system; monitored for compliance
- Integration of AYUSH with NP-NCD
- Integration of RNTCP + NPCDCS for TB-Diabetes comorbidity management
- Integration with RBSK for Rheumatic Heart Disease
- Behavioural change messages:
- Healthy food intake
- Increased physical activity
- Avoidance of tobacco and alcohol
- Stress management
- Camps, posters, banners, interpersonal communication at Sub-centre level
ORGANIZATIONAL FRAMEWORK
- Under NHM, funded under Common NCD Flexi-Pool; Centre:State = 60:40
- NCD Cells: National → State → District
- NCD Clinics at CHC and District Hospital
- CCU (Cardiac Care Units) for emergency cardiac care
- Implementation in 20,000 sub-centres and 700 CHCs across 100 districts in 21 States/UTs
CASE CONTROL AND MANAGEMENT
- ASHA - community follow-up; home visits; treatment compliance monitoring; regular BP/blood glucose checks
- ASHA prioritizes treatment defaulters and complicated cases
- ANM - regular home visits
- Health card maintained for each patient
- Goal: Minimize defaulters + achieve hypertension and glycaemic control at individual and population level
RECEPTION AND RESULTS (Park's Table 17)
| Facilities | March 2014 | September 2015 |
|---|---|---|
| State NCD Cells | 21 | 36 |
| District NCD Clinics | 95 | 201 |
| CHC NCD Clinics | 204 | 1362 |
| District CCU Facilities | 51 | 65 |
- Programme under implementation in all 36 States/UTs as of September 2015
KEY EXAM POINTS
- NPCDCS → NP-NCD (May 2023); new additions = CKD + NAFLD
- Screening from ≥30 years; funding 60:40
- Referral: BP >140/90, RBS ≥140 mg/dL
- Key integration: RNTCP + NPCDCS for TB-DM comorbidity
- Secondary prevention = Aspirin + Beta-blocker + ACE inhibitor + Statin
Epidemiology of hypertension for Long note