
Lets study about ECG from basics to the end, looking at everything in detail such as that a patient came to ED, ECG is taken and now where should i look what should i look from beginning to end, the calibration, the first lead to see what to see, how to count boxes and how to remember how many boxes means, we will extract each tiny piece of infomration from ECG today ready
The Full ECG Reading Journey (Topic Map)
- Patient/clinical context - why was this ECG taken, symptoms, vitals
- Calibration check - paper speed (25 mm/s standard), voltage gain (10 mm/mV), the little calibration box/spike at the start of the strip
- Box counting - small box (0.04s/1mm) vs big box (0.2s/5mm), how these translate to heart rate and interval measurement
Which part should we go deep on first?
The Full ECG Reading Journey (Topic Map)
- Patient/clinical context - why was this ECG taken, symptoms, vitals
- Calibration check - paper speed (25 mm/s standard), voltage gain (10 mm/mV), the little calibration box/spike at the start of the strip
- Box counting - small box (0.04s/1mm) vs big box (0.2s/5mm), how these translate to heart rate and interval measurement
ECG paper grid small box large box calibration standardization mark
ECG rate calculation 300 150 100 75 60 50 large box method
1. Before you read a single wave: Clinical context
2. Calibration - the part everyone glosses over
- Paper speed = 25 mm/sec (this is the time axis, horizontal)
- Amplitude/gain = 10 mm/mV (this is the voltage axis, vertical)
3. The grid itself - small box vs. big box
| Width | Time represents | Voltage represents | |
|---|---|---|---|
| Small box (1 mm) | 1 mm | 0.04 sec (40 ms) | 0.1 mV |
| Big box (5 mm = 5 small boxes) | 5 mm | 0.2 sec (200 ms) | 0.5 mV |
- Measuring a PR interval or QRS width = literally counting small boxes and multiplying by 0.04 sec
- Measuring ST elevation/depression = counting small boxes vertically and multiplying by 0.1 mV (2 small boxes up = 0.2 mV = 2 mm, the STEMI threshold in most limb leads)
- Measuring rate = counting big boxes between beats (next section)
4. Box counting for Heart Rate - the part you specifically asked about
1 big box  = 300 bpm
2 big boxes = 150 bpm
3 big boxes = 100 bpm
4 big boxes = 75 bpm
5 big boxes = 60 bpm
6 big boxes = 50 bpm
Quick mental anchor to lock this in
Continue with Rate & Rhythm assessment and how to identify regularity
Rate & Rhythm Assessment - Determining Regularity
Step 1: Is the rhythm regular?
- Regular: every R-R interval is essentially the same width, beat after beat
- Irregular: the R-R distances vary
Step 2: If irregular, which KIND of irregular?
- Sinus arrhythmia (rate speeds up with inspiration, slows with expiration - a normal finding, especially in younger patients)
- Grouped beating patterns like Wenckebach (Mobitz I) AV block, where the PR interval progressively lengthens until a beat drops, then the cycle resets
- Bigeminy (every other beat is a PVC)
- Atrial fibrillation (the classic and most common cause - ventricular response is chaotic because the AV node is being bombarded by disorganized atrial fibrillatory waves at 300-600/min and only conducting some of them unpredictably)
- Multifocal atrial tachycardia (MAT) - look for at least 3 distinct P-wave morphologies in a single lead, no consistent P-P, PR, or R-R intervals
- Atrial flutter or atrial tachycardia with variable AV conduction
- Multiple PVCs/extrasystoles scattered through the strip
- Wandering atrial pacemaker
Step 3: Once you know regular/irregular, ask - where does the impulse come from?
-
Is there a P wave before every QRS, and a QRS after every P wave? If yes, and the P wave is upright (positive) in leads I and aVF with normal morphology, that's normal sinus rhythm - the SA node is doing its job and conduction to the ventricles is 1:1 (Harriet Lane Handbook; Kaplan & Sadock's Comprehensive Textbook of Psychiatry).
-
Is a P wave present but not always followed by a QRS? (P present, but some P waves "drop" without a QRS after them) - this points toward an AV block (2nd or 3rd degree) rather than a primary rhythm disturbance in the atria.
-
Are P waves completely absent, replaced by a chaotic baseline? - think atrial fibrillation (fibrillatory/f waves, 300-600/min, no discrete P waves at all).
-
Do the P waves look abnormal or come from a different spot each time? - multifocal atrial tachycardia, wandering pacemaker, or an ectopic atrial focus.
-
If irregular, do the irregular beats all look identical to each other, or do some look different (wider, different shape)? Uniform irregular beats suggest an atrial-level problem (like AFib conducting variably); a beat that looks different (wide, bizarre, no preceding P) is more likely a PVC interrupting an otherwise normal rhythm.
- Is the rate appropriate for what you've identified? A "sinus rhythm" running at 160 bpm isn't just sinus rhythm anymore, it's sinus tachycardia, and you should be asking why (pain, fever, hypovolemia, PE, thyrotoxicosis). A fixed, very regular ventricular rate appearing underneath what should be atrial fibrillation's irregular pattern is actually suspicious for complete (3rd degree) heart block, not reassuring.
Quick mental checklist for Rate + Rhythm together
- Regular or irregular? (caliper walk the R-R intervals)
- If irregular - regularly irregular (patterned) or irregularly irregular (chaotic)?
- Is there a P wave for every QRS, and vice versa?
- Do P waves look normal and consistent, or do they vary/disappear?
- Does the rate make sense for what you're seeing?
Continue with Axis determination using the Lead I/aVF quadrant method
Axis Determination - The Lead I / aVF Quadrant Method
Why these two leads specifically
The four-quadrant lookup table
| Lead I | aVF | Quadrant | Axis | Interpretation |
|---|---|---|---|---|
| Positive (upright) | Positive (upright) | Normal | 0 to +90 degrees | Normal axis |
| Positive (upright) | Negative (inverted) | Left | 0 to -90 degrees | Left axis deviation (LAD) |
| Negative (inverted) | Positive (upright) | Right | +90 to +180 degrees | Right axis deviation (RAD) |
| Negative (inverted) | Negative (inverted) | Extreme/indeterminate | -90 to +/-180 degrees | Extreme (right superior) axis deviation - rare, "no man's land" |
- If Lead I is upright, aVF is inverted, AND Lead II is also inverted/negative -> true left axis deviation (more negative than -30 degrees)
- If Lead I is upright, aVF is inverted, but Lead II is still upright -> axis is between -30 and 0, which is still within normal limits
Quick memory anchor
- Both thumbs up (Lead I positive, aVF positive) = Normal, "everything's fine, going down and to the left"
- Lead I up, aVF down = "Leans left" = Left axis deviation
- Lead I down, aVF up = "Leans right" = Right axis deviation
- Both down = "Nowhere good" = Extreme axis deviation, get someone experienced to double check
The precision method (when you need an exact number, not just a quadrant)
-
Isoelectric/perpendicular lead trick: find the one limb lead where the QRS is isoelectric (equal positive and negative deflection, net near zero). The true axis must be perpendicular to that lead's axis. Then check which of the two perpendicular directions is correct by seeing which nearby lead shows the most positive deflection - the axis points toward that lead's positive pole.
-
Amplitude-matching method: if no lead is perfectly isoelectric, find two leads with similar-magnitude, same-sign deflections - the true axis sits roughly halfway between those two lead angles.
Why axis actually matters clinically
- Left axis deviation (more negative than -30 degrees): most often left ventricular hypertrophy from longstanding hypertension, or left anterior fascicular block, left bundle branch block (Harrison's Principles of Internal Medicine, "QRS COMPLEX"; Ganong's Review of Medical Physiology)
- Right axis deviation (more positive than +90 to +100 degrees): think right ventricular hypertrophy (e.g., from pulmonary hypertension or chronic lung disease), pulmonary embolism, left posterior fascicular block, or it can simply be a normal variant in a tall thin young person
- Extreme axis deviation: consider ventricular rhythms, severe hyperkalemia, or combined fascicular/bundle branch blocks
Continue with P wave, PR interval, and QRS morphology breakdown
P Wave, PR Interval, and QRS Morphology - The Wave-by-Wave Breakdown
P Wave - Atrial Depolarization
- Upright (positive) in lead II and aVF, negative in aVR - this confirms the impulse is coming from the SA node and traveling in the normal direction (down and to the left)
- Duration: should not exceed 0.12 sec (3 small boxes) in adults
- Amplitude: should not exceed roughly 2.5 mm in the limb leads
PR Interval - AV Conduction Time
- With a delta wave and widened QRS -> Wolff-Parkinson-White (WPW) syndrome - an accessory pathway (like the Bundle of Kent) bypasses the AV node entirely, pre-exciting the ventricle before the normal conduction system even arrives
- With a normal QRS complex -> could be a junctional rhythm, enhanced AV nodal conduction, or Lown-Ganong-Levine pattern (Ganong's Review of Medical Physiology; Symptom to Diagnosis)
QRS Complex - Ventricular Depolarization
- Normal: less than 0.12 sec (3 small boxes, 120 ms)
- Widened (≥0.12 sec): something is disrupting the normal rapid, coordinated spread of depolarization through the His-Purkinje system. Causes include bundle branch blocks, ventricular rhythms (PVCs, VT), hyperkalemia, sodium channel blocking drug toxicity, or paced rhythms.
-
Right Bundle Branch Block (RBBB): QRS ≥120 ms, with an "rSR'" or "M-shaped" pattern in V1 (small r, deep S, then a second tall R') and a wide, slurred S wave in lead I and V6. The terminal QRS vector points rightward and anteriorly because the right ventricle depolarizes late, unopposed by the already-finished left ventricle (Harriet Lane Handbook; Harrison's Principles of Internal Medicine; Goldman-Cecil Medicine). Mnemonic: "RaBBit ears" - the rabbit-ear-shaped RSR' complex in V1.
-
Left Bundle Branch Block (LBBB): QRS ≥120 ms, broad/notched R wave in V6 and lead I (no septal q wave allowed), and a deep, wide S wave in V1 with absence of a normal Q wave in the lateral leads. ST segments are typically downsloping with T waves discordant (opposite direction) to the QRS (Goldman-Cecil Medicine; ROSEN's Emergency Medicine). Mnemonic: "WiLLiaM" - W shape in V1, M shape in V6.
- Poor/delayed R-wave progression (R waves stay small across V1-V4): consider prior anterior MI (loss of viable myocardium), LBBB, RVH, or even something as benign as chronic lung disease/emphysema (lung hyperinflation and diaphragm displacement changing the heart's electrical position) (Barash Clinical Anesthesia; Harrison's Principles of Internal Medicine).
- Also always rule out limb/precordial lead placement error first before chasing a pathologic cause - a technician misplacing leads is a very common, very fixable reason for a "weird" R-wave progression pattern (Pfenninger and Fowler's Procedures for Primary Care).
- In leads V2-V3: any Q wave duration ≥0.02 sec, or a QS complex at all is abnormal (a small isolated Q in V1 alone, or in lead III alone, is normal)
- In other leads (I, II, aVL, aVF, V4-V6): Q wave duration ≥0.03 sec AND depth ≥1 mm (0.1 mV), present in two contiguous leads (Washington Manual of Medical Therapeutics)
Putting P + PR + QRS together as a quick triage pass
- Is there a P wave, and is it upright in II with normal size/shape? -> confirms sinus origin, rules out atrial enlargement
- Is the PR interval 0.12-0.20 sec? -> if long, think 1st degree block; if short, think WPW or junctional
- Is the QRS narrow (<0.12 sec) or wide? -> narrow means the impulse used the normal conduction system; wide means something (BBB, ventricular origin, toxin, hyperkalemia) disrupted it
- If wide, check V1/V6 for RBBB vs LBBB pattern
- Check R-wave progression V1 to V6, and scan for pathologic Q waves in any lead
Continue with ST segment, T wave, and QT interval breakdown
ST Segment, T Wave, and QT Interval Breakdown
ST Segment - Ventricular Repolarization Begins
- Transmural (full-thickness) ischemia shifts the ST vector outward toward the epicardium -> ST elevation over the ischemic zone
- Subendocardial ischemia (inner layer only) shifts the ST vector toward the ventricular cavity -> ST depression in the overlying leads, often with reciprocal ST elevation in aVR (Harrison's Principles of Internal Medicine, "MYOCARDIAL ISCHEMIA AND INFARCTION")
- ≥1 mm in most leads
- In V2-V3 specifically: ≥2 mm in men under 40, ≥1.5 mm in women (sex- and age-adjusted because normal early repolarization is more prominent in young men) (Symptom to Diagnosis)
| Leads with ST elevation | Territory | Usual culprit artery |
|---|---|---|
| V1-V4 (+ I, aVL for extension) | Anterior/anteroseptal/anterolateral | LAD (Left Anterior Descending) |
| II, III, aVF | Inferior | RCA (or LCx) |
| I, aVL, V5-V6 | Lateral | LCx (Left Circumflex) |
| V1, V3R-V4R (right-sided leads) | Right ventricular | Proximal RCA |
| ST depression V1-V3 with tall R waves (posterior "mirror image") | Posterior | RCA or LCx (posterior descending) |
- Anterior infarct -> reciprocal ST depression in II, III, aVF
- Inferior infarct -> reciprocal ST depression in I and aVL (Harrison's Principles of Internal Medicine, "ECG sequence with inferior ST-elevation")
T Wave - Ventricular Repolarization Completing
- Evolving/resolving MI (NSTEMI or post-STEMI reperfusion) - deep, symmetric inversions especially V1-V4 raise concern for Wellens syndrome (critical LAD stenosis, high risk of imminent anterior MI even with pain-free, biomarker-negative presentation)
- Right ventricular strain from acute PE - inferior T-wave inversion or inversion in V1-V4
- Normal variant, electrolyte disturbance, subarachnoid hemorrhage (deep, wide "cerebral T waves"), digoxin effect, or medication effects (antipsychotics, lithium) (Braunwald's Heart Disease; Kaplan & Sadock's Psychiatry)
- Tall, narrow, peaked T waves (earliest sign)
- Flattened P wave with prolonged PR, then P wave disappears entirely
- Widened QRS
- Sine-wave pattern -> impending cardiac arrest (ROSEN's Emergency Medicine, "Diagnostic Testing")
QT Interval - Total Ventricular Activity, Start to Finish
- R-R = 60/120 = 0.50 sec
- QTc = 0.37 / √0.50 = 0.37 / 0.707 = 0.523 sec (523 ms) - significantly prolonged, indicating serious cardiotoxicity (Roberts and Hedges' Clinical Procedures).
- Upper limit of normal: ≤440 ms in men, ≤460 ms in women (Tintinalli's gives slightly more conservative cutoffs at 0.44/0.46 sec, essentially the same numbers - women normally run a slightly longer QTc than men)
- Moderate risk of torsades de pointes increases progressively as QTc climbs above these thresholds
- Congenital long QT syndromes (channelopathies) -> risk of torsades de pointes and sudden cardiac death, often unmasked by exercise or startle (check family history of unexplained syncope/sudden death)
- Acquired/drug-induced - a long list of QT-prolonging drugs (many antipsychotics, antiarrhythmics, some antibiotics like macrolides/fluoroquinolones, methadone, SSRIs at high doses) (Kaplan & Sadock's Psychiatry; Tintinalli's Emergency Medicine)
- Electrolyte causes - hypokalemia, hypomagnesemia, hypocalcemia
- Practical tip: check crediblemeds.org type resources when reviewing a patient's medication list against a prolonged QTc, since the list of culprits changes constantly
Quick recent-evidence check
Create a systematic ECG interpretation checklist I can print and use in the ED
mkdir -p /tmp/workspace/ecg-checklist && ls -la /tmp/workspace/
~/ecg-checklist/build_checklist.py
from reportlab.lib.pagesizes import letter
from reportlab.lib.units import inch
from reportlab.lib import colors
from reportlab.platypus import (SimpleDocTemplate, Paragraph, Spacer, Table, TableStyle,
ListFlowable, ListItem, HRFlowable)
from reportlab.lib.styles import getSampleStyleSheet, ParagraphStyle
from reportlab.lib.enums import TA_CENTER, TA_LEFT
styles = getSampleStyleSheet()
title_style = ParagraphStyle('TitleX', parent=styles['Title'], fontSize=16, spaceAfter=2,
textColor=colors.HexColor('#0b3d5c'))
subtitle_style = ParagraphStyle('SubtitleX', parent=styles['Normal'], fontSize=9, spaceAfter=10,
textColor=colors.HexColor('#444444'), alignment=TA_CENTER)
h1 = ParagraphStyle('H1', parent=styles['Heading1'], fontSize=11.5, spaceBefore=8, spaceAfter=4,
textColor=colors.white, backColor=colors.HexColor('#0b3d5c'),
leftIndent=4, borderPadding=(4,4,4,4))
h2 = ParagraphStyle('H2', parent=styles['Heading2'], fontSize=10, spaceBefore=6, spaceAfter=2,
textColor=colors.HexColor('#0b3d5c'))
body = ParagraphStyle('Body', parent=styles['Normal'], fontSize=8.7, leading=11.5, spaceAfter=2)
small = ParagraphStyle('Small', parent=styles['Normal'], fontSize=7.8, leading=10, textColor=colors.HexColor('#333333'))
checkbox_style = ParagraphStyle('Check', parent=styles['Normal'], fontSize=8.7, leading=12, spaceAfter=3, leftIndent=2)
def cb(text):
return Paragraph(f"☐ {text}", checkbox_style)
story = []
story.append(Paragraph("SYSTEMATIC ECG INTERPRETATION CHECKLIST", title_style))
story.append(Paragraph("Emergency Department Bedside Reference — Start to Finish, Box by Box", subtitle_style))
story.append(HRFlowable(width="100%", thickness=1, color=colors.HexColor('#0b3d5c'), spaceAfter=6))
# STEP 0
story.append(Paragraph("STEP 0 — BEFORE YOU LOOK AT A SINGLE WAVE", h1))
story.append(cb("Patient identifiers correct? Date/time on strip matches encounter?"))
story.append(cb("Clinical context known — why was this ECG ordered? (chest pain, syncope, palpitations, etc.)"))
story.append(cb("Old ECG available for comparison? (A \"new\" finding only matters if it's actually new)"))
story.append(cb("Calibration mark present and standard? — 10 mm/mV (amplitude), 25 mm/sec (paper speed). If gain/speed altered, recalculate every measurement below accordingly."))
# STEP 1
story.append(Paragraph("STEP 1 — THE GRID (BOX COUNTING)", h1))
tbl_data = [
["", "Width", "= Time", "= Voltage"],
["Small box", "1 mm", "0.04 sec (40 ms)", "0.1 mV"],
["Big box (5 small)", "5 mm", "0.2 sec (200 ms)", "0.5 mV"],
]
t = Table(tbl_data, colWidths=[1.3*inch, 0.9*inch, 1.6*inch, 1.2*inch])
t.setStyle(TableStyle([
('BACKGROUND', (0,0), (-1,0), colors.HexColor('#e8eef2')),
('FONTSIZE', (0,0), (-1,-1), 8),
('GRID', (0,0), (-1,-1), 0.5, colors.grey),
('ALIGN', (1,0), (-1,-1), 'CENTER'),
('TOPPADDING', (0,0), (-1,-1), 3),
('BOTTOMPADDING', (0,0), (-1,-1), 3),
]))
story.append(t)
story.append(Spacer(1, 4))
story.append(Paragraph("5 big boxes = exactly 1 second.", small))
# STEP 2
story.append(Paragraph("STEP 2 — RATE", h1))
story.append(cb("Regular rhythm → find R wave on a heavy line, count big boxes to next R: <b>300, 150, 100, 75, 60, 50</b> for 1,2,3,4,5,6 big boxes"))
story.append(cb("Finer count → Rate = 1500 / (number of small boxes between R waves)"))
story.append(cb("Any rhythm → Rate = 60 / R-R interval in seconds"))
story.append(cb("Irregular rhythm → 6-second strip method: count QRS complexes in 6 sec (30 big boxes) × 10"))
# STEP 3
story.append(Paragraph("STEP 3 — RHYTHM & REGULARITY", h1))
story.append(cb("Walk calipers (or paper edge) across R-R intervals → Regular or Irregular?"))
story.append(cb("If irregular: Regularly irregular (patterned, e.g. sinus arrhythmia, Wenckebach, bigeminy) vs. Irregularly irregular (chaotic, e.g. AFib, MAT, variable block)"))
story.append(cb("Is there a P wave before every QRS, and a QRS after every P? → if yes + upright P in I/aVF = normal sinus rhythm"))
story.append(cb("P present but some dropped without QRS → consider AV block"))
story.append(cb("P waves absent, chaotic baseline → consider AFib"))
story.append(cb("Multiple P morphologies (≥3) → consider multifocal atrial tachycardia"))
story.append(cb("Does the rate make sense for the rhythm identified?"))
# STEP 4
story.append(Paragraph("STEP 4 — AXIS (Lead I / aVF Quadrant Method)", h1))
tbl2 = [
["Lead I", "aVF", "Quadrant"],
["Positive", "Positive", "Normal (-30° to +90°)"],
["Positive", "Negative", "Left Axis Deviation"],
["Negative", "Positive", "Right Axis Deviation"],
["Negative", "Negative", "Extreme/Indeterminate axis"],
]
t2 = Table(tbl2, colWidths=[1.5*inch, 1.5*inch, 2.0*inch])
t2.setStyle(TableStyle([
('BACKGROUND', (0,0), (-1,0), colors.HexColor('#e8eef2')),
('FONTSIZE', (0,0), (-1,-1), 8),
('GRID', (0,0), (-1,-1), 0.5, colors.grey),
('ALIGN', (0,0), (-1,-1), 'CENTER'),
('TOPPADDING', (0,0), (-1,-1), 3),
('BOTTOMPADDING', (0,0), (-1,-1), 3),
]))
story.append(t2)
story.append(Spacer(1,3))
story.append(Paragraph("If Lead I (+) / aVF (−): check Lead II — still upright = normal variant; inverted = true LAD.", small))
# STEP 5
story.append(Paragraph("STEP 5 — P WAVE", h1))
story.append(cb("Upright in II and aVF, negative in aVR? Duration ≤0.12 sec, amplitude ≤2.5-3 mm?"))
story.append(cb("Tall P (>2.5-3 mm) in lead II → consider Right Atrial Enlargement (P pulmonale)"))
story.append(cb("Broad/notched P (>0.12 sec) in I/II, or deep/wide terminal negative deflection in V1 (≥1mm × ≥40ms) → consider Left Atrial Enlargement (P mitrale)"))
# STEP 6
story.append(Paragraph("STEP 6 — PR INTERVAL", h1))
story.append(cb("Normal: 0.12–0.20 sec (3–5 small boxes)"))
story.append(cb("Prolonged (>0.20 sec) with every P followed by QRS → 1st degree AV block"))
story.append(cb("Short (<0.12 sec) + wide QRS + delta wave → WPW / pre-excitation"))
story.append(cb("Short (<0.12 sec) + normal narrow QRS → junctional rhythm / enhanced AV conduction"))
# STEP 7
story.append(Paragraph("STEP 7 — QRS COMPLEX", h1))
story.append(cb("Width: Normal <0.12 sec (3 small boxes). Widened ≥0.12 sec → BBB, ventricular rhythm, hyperkalemia, Na-channel blocker toxicity, paced rhythm"))
story.append(cb("Check V1 & V6: RSR' (\"rabbit ears\") in V1 + wide slurred S in I/V6 → RBBB"))
story.append(cb("Check V1 & V6: Broad/notched R in V6/I (no septal q) + deep wide S in V1 → LBBB"))
story.append(cb("R-wave progression V1→V6: should increase, transition ~V3-V4. Poor progression → prior anterior MI, LBBB, RVH, or lead misplacement"))
story.append(cb("Pathologic Q waves: V2/V3 ≥0.02 sec or any QS; other leads ≥0.03 sec AND ≥1mm deep, in 2 contiguous leads → prior MI / scar"))
# STEP 8
story.append(Paragraph("STEP 8 — ST SEGMENT", h1))
story.append(cb("Elevated ≥1mm (≥2mm/1.5mm in V2-V3 men<40/women) in 2 contiguous leads → STEMI criteria. Identify territory:"))
tbl3 = [
["Leads", "Territory", "Artery"],
["V1-V4 (±I, aVL)", "Anterior/septal/lateral", "LAD"],
["II, III, aVF", "Inferior", "RCA (or LCx)"],
["I, aVL, V5-V6", "Lateral", "LCx"],
["V3R-V4R", "Right ventricular", "Proximal RCA"],
["ST depression V1-V3 + tall R", "Posterior (mirror image)", "RCA/LCx"],
]
t3 = Table(tbl3, colWidths=[1.7*inch, 1.7*inch, 1.6*inch])
t3.setStyle(TableStyle([
('BACKGROUND', (0,0), (-1,0), colors.HexColor('#e8eef2')),
('FONTSIZE', (0,0), (-1,-1), 7.6),
('GRID', (0,0), (-1,-1), 0.5, colors.grey),
('ALIGN', (0,0), (-1,-1), 'CENTER'),
('TOPPADDING', (0,0), (-1,-1), 2.5),
('BOTTOMPADDING', (0,0), (-1,-1), 2.5),
]))
story.append(t3)
story.append(Spacer(1,3))
story.append(cb("Check reciprocal changes (confirms real ischemia): anterior MI → recip. depression II/III/aVF; inferior MI → recip. depression I/aVL"))
story.append(cb("Diffuse ST elevation (non-territorial) + PR depression, sparing/reciprocal in aVR → consider pericarditis, NOT STEMI"))
story.append(cb("ST depression with reciprocal elevation in aVR → subendocardial ischemia"))
# STEP 9
story.append(Paragraph("STEP 9 — T WAVE", h1))
story.append(cb("Tall, broad-based, peaked (hyperacute) → earliest sign of STEMI, can precede ST elevation"))
story.append(cb("Peaked + narrowing P wave/prolonged PR → check potassium NOW (hyperkalemia sequence: peaked T → flat/absent P → wide QRS → sine wave)"))
story.append(cb("Deep symmetric inversion V1-V4 → consider Wellens syndrome (critical LAD lesion) even if pain-free"))
story.append(cb("Inferior or V1-V4 inversion in context of dyspnea/tachycardia → consider PE / RV strain"))
# STEP 10
story.append(Paragraph("STEP 10 — QT / QTc INTERVAL", h1))
story.append(cb("Measure QT: start of QRS to end of T wave"))
story.append(cb("Correct for rate (Bazett): QTc = QT / √(R-R interval in seconds)"))
story.append(cb("Normal QTc: ≤440 ms (men), ≤460 ms (women)"))
story.append(cb("Prolonged → consider congenital long QT, drug-induced (antipsychotics, antiarrhythmics, macrolides, methadone, SSRIs), or electrolyte cause (low K/Mg/Ca) → torsades risk"))
story.append(cb("Watch for U waves inflating apparent QT — confirm manually if borderline"))
# FINAL SWEEP
story.append(Paragraph("FINAL SWEEP — PATTERN RECOGNITION", h1))
story.append(cb("S1Q3T3 (S in I, Q in III, inverted T in III) + sinus tach + RV strain → consider PE"))
story.append(cb("Diffuse ST elevation, all leads except aVR, + PR depression → pericarditis"))
story.append(cb("Peaked T, flat P, wide QRS, sine wave → hyperkalemia"))
story.append(cb("New LBBB or ST elevation V2-V3 pattern with matching symptoms → STEMI equivalent, activate cath lab pathway"))
story.append(cb("Compare against old ECG one final time before signing off"))
story.append(Spacer(1, 8))
story.append(HRFlowable(width="100%", thickness=0.75, color=colors.HexColor('#999999')))
story.append(Paragraph("Reference: derived from Harrison's Principles of Internal Medicine, Harriet Lane Handbook, Tintinalli's Emergency Medicine, ROSEN's Emergency Medicine, Goldman-Cecil Medicine, Braunwald's Heart Disease, Roberts & Hedges' Clinical Procedures, Medical Physiology. For education/reference use — always correlate with clinical context and institutional protocol.", small))
doc = SimpleDocTemplate("/tmp/workspace/ecg-checklist/ECG_Interpretation_Checklist.pdf",
pagesize=letter,
topMargin=0.35*inch, bottomMargin=0.35*inch,
leftMargin=0.45*inch, rightMargin=0.45*inch)
doc.build(story)
print("PDF built successfully")
Create a systematic ECG interpretation checklist I can print and use in the ED
cd /tmp/workspace/ecg-checklist && python3 build_checklist.py
ls -la /tmp/workspace/ecg-checklist/ && python3 -c " from pypdf import PdfReader r = PdfReader('/tmp/workspace/ecg-checklist/ECG_Interpretation_Checklist.pdf') print('Pages:', len(r.pages)) "
ECG Interpretation Checklist
PDF Document · PDF
- Step 0 - Pre-check (patient info, clinical context, old ECG, calibration)
- Step 1 - Grid/box counting reference table
- Step 2 - Rate (300-150-100-75-60-50 method, 6-second strip method)
- Step 3 - Rhythm & regularity (regular vs regularly/irregularly irregular)
- Step 4 - Axis quadrant table (Lead I / aVF)
- Step 5-6 - P wave and PR interval red flags
- Step 7 - QRS width, RBBB/LBBB patterns, R-wave progression, pathologic Q waves
- Step 8 - ST segment with the coronary territory/artery mapping table and STEMI-vs-pericarditis distinction
- Step 9-10 - T wave (hyperacute, hyperkalemia sequence, Wellens) and QTc calculation/thresholds
- Final sweep - quick pattern recognition (PE, pericarditis, hyperkalemia, STEMI equivalents)
Generate a practice ECG workbook with 20 cases to interpret
normal sinus rhythm 12-lead ECG
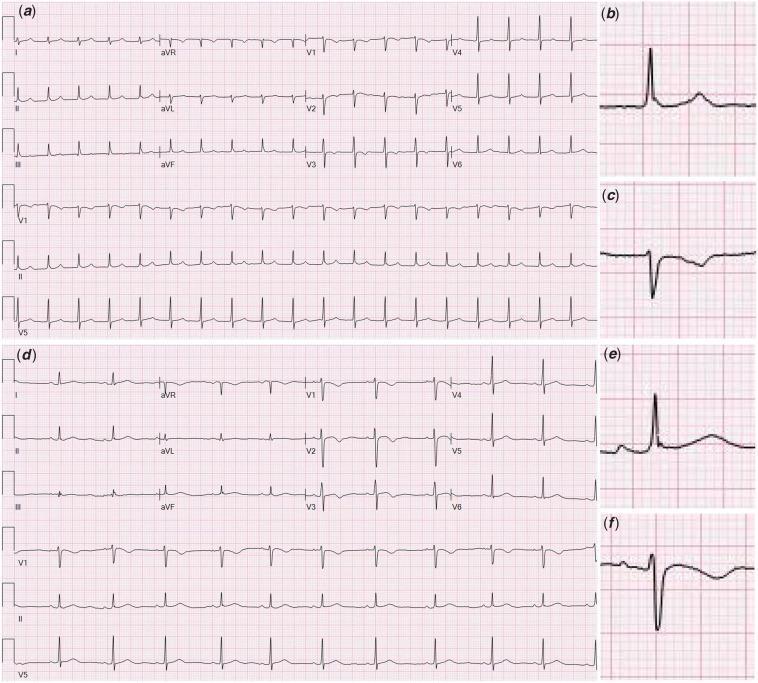
A multi-panel comparative electrocardiogram (ECG) demonstrating the diagnostic features of junctional tachycardia versus normal sinus rhythm. Panel (a) shows a 12-lead ECG of junctional tachycardia characterized by a rapid, narrow-complex rhythm with a rate exceeding 100 bpm and an absence of normal preceding P waves. Magnified inserts (b) and (c) highlight Lead II and V1 respectively, revealing retrograde (inverted) P waves occurring after the QRS complex, indicating atrial depolarization originating from the atrioventricular (AV) junction. Panel (d) displays a standard 12-lead ECG of normal sinus rhythm for comparison. Magnified inserts (e) and (f) for Lead II and V1 demonstrate normal morphology with upright P waves consistently preceding each QRS complex at a regular rate. This diagnostic image is intended for cardiology education to illustrate electrophysiological changes in junctional arrhythmias and the importance of P-wave morphology and timing in rhythm identification. This case is clinically relevant in the context of MIS-C and pediatric myocarditis where AV nodal inflammation may occur.
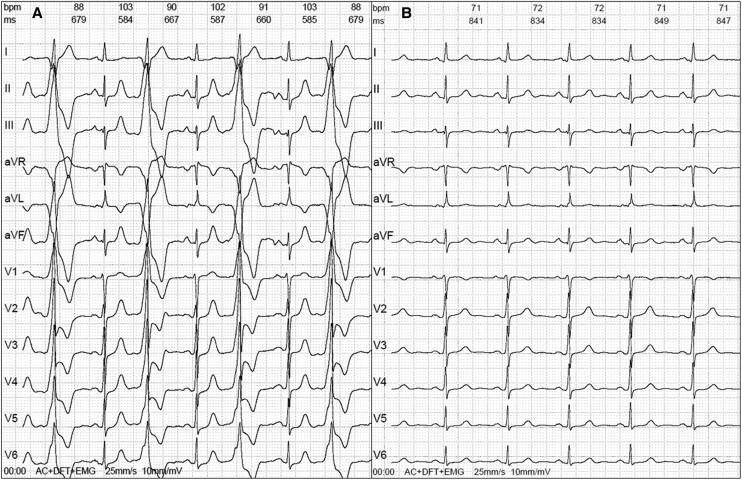
Comparison of two side-by-side 12-lead electrocardiograms (ECGs) representing pre- and post-intervention cardiac rhythms. Panel A displays a 12-lead ECG characterized by ventricular bigeminy, where every normal sinus beat is followed by a premature ventricular complex (PVC). These PVCs are wide, have a different morphology from the narrow sinus complexes, and exhibit discordant T waves. The heart rate fluctuates between 88 and 103 bpm. Panel B displays a subsequent 12-lead ECG showing a return to a stable normal sinus rhythm with a consistent heart rate of approximately 71-72 bpm. In Panel B, there is a regular presence of P waves before each QRS complex, and the QRS complexes are uniform in morphology across all leads (I, II, III, aVR, aVL, aVF, V1-V6). This clinical comparison illustrates the successful resolution of ventricular ectopy following catheter ablation. The educational focus is on identifying PVC patterns and the transition from bigeminy to stable sinus rhythm.
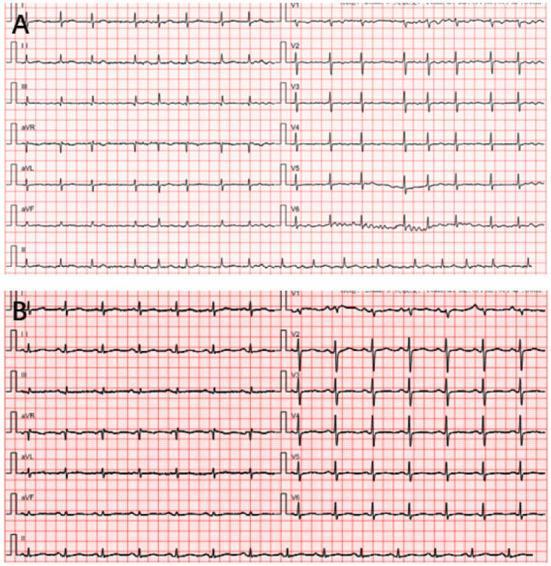
The image consists of two 12-lead electrocardiogram (ECG) tracings, labeled A and B, displayed on a standard grid. Panel A shows a pre-procedure ECG demonstrating atrial fibrillation, characterized by an irregularly irregular rhythm with varying R-R intervals and the absence of discernible P waves. The QRS complexes are narrow, and the baseline shows minor wandering artifact but no significant interference. Panel B shows a postoperative 12-lead ECG. This tracing displays a regular rhythm with a heart rate of approximately 120 beats per minute, consistent with sinus tachycardia. Each QRS complex is narrow and preceded by a discernible P wave in most leads, indicating a return to sinus rhythm following intervention (radiofrequency catheter ablation). The T waves in both tracings appear normal in morphology across the limb (I, II, III, aVR, aVL, aVF) and precordial (V1-V6) leads, with no obvious signs of acute ST-segment elevation or depression. This comparison serves as clinical documentation of rhythm conversion from atrial fibrillation to sinus tachycardia in a patient post-ablation.
sinus bradycardia ECG rhythm strip
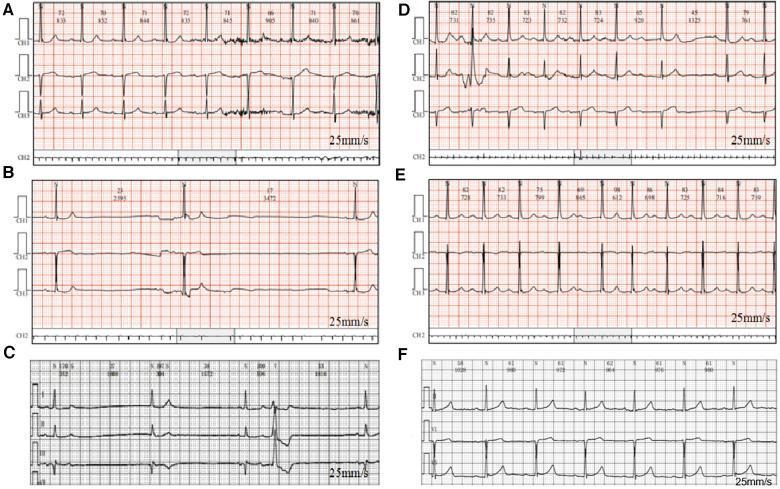
This diagnostic image consists of six 3-lead electrocardiogram (ECG) rhythm strips, labeled A through F, recorded at a paper speed of 25 mm/s. The series demonstrates the progression and resolution of drug-induced cardiac conduction disturbances in a patient. Strip A shows tachycardia with second-degree atrioventricular (AV) block Mobitz Type I (Wenckebach). Strip B illustrates severe sinus bradycardia and sinus arrest with a prolonged R-R interval. Strip C reveals persistent sinus arrest and first-degree AV block. Strip D displays a return to a more regular rhythm but with continued evidence of prolonged PR intervals and Mobitz Type I conduction patterns. Strip E shows intermittent first-degree AV block with improved heart rate during medical management. Finally, Strip F demonstrates a stable sinus rhythm with a residual first-degree AV block after the discontinuation of the suspected causative medication (escitalopram). These strips collectively highlight various arrhythmias including sinus node dysfunction, AV conduction delays, and rhythm changes associated with pharmacotherapy monitoring.
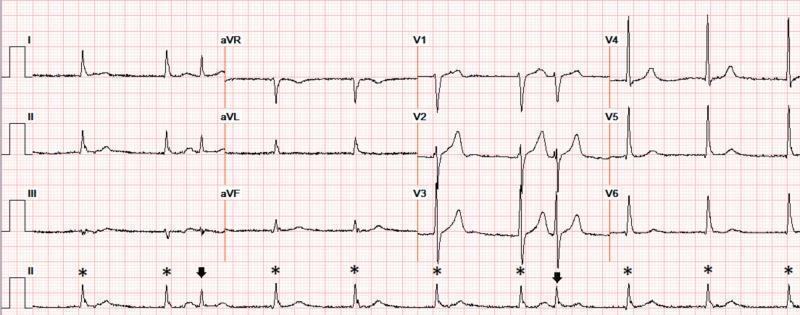
A 12-lead electrocardiogram (ECG) demonstrating severe sinus bradycardia with a heart rate of approximately 60 beats per minute. The rhythm exhibits atrial quadrigeminy, characterized by a repeating pattern where every fourth complex is a premature atrial complex (APC), marked by arrows in the rhythm strip (lead II). These APCs are followed by a compensatory pause and are coupled at an interval of approximately 550 ms. Several QRS complexes, marked with asterisks (*), lack preceding visible P-waves, suggesting a competing junctional escape rhythm or junctional beats emerging due to the underlying sinus bradycardia. The QRS complexes maintain a narrow morphology, and the ST segments and T-waves appear normal without signs of acute ischemia or electrolyte-induced peaking. This ECG illustrates complex rhythm disturbances including escape-capture sequences and ectopy in the clinical context of chronic kidney disease and electrolyte fluctuations.
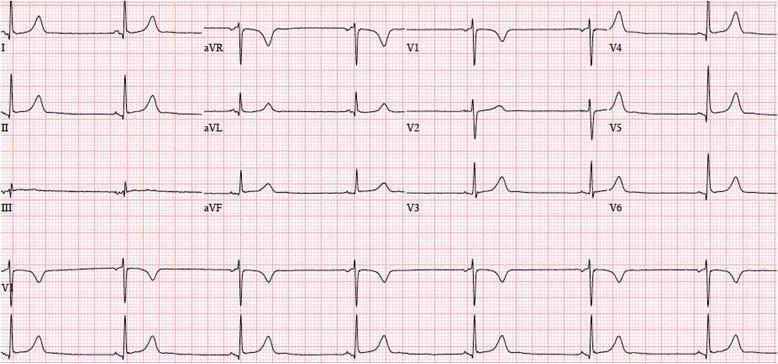
A standard 12-lead electrocardiogram (ECG) printed on red-grid thermal paper, illustrating marked sinus bradycardia. The tracing is organized into a four-column format: the first column displays leads I, II, and III; the second contains augmented limb leads (aVR, aVL, aVF); and the final two columns present precordial leads V1 through V6. Below the standard leads, continuous rhythm strips (specifically V1 and a rhythm strip likely corresponding to lead II) facilitate rhythm assessment. The heart rate is significantly reduced, calculated at approximately 42 beats per minute based on the wide R-R intervals. Despite the slow rate, the rhythm remains regular with a 1:1 P-wave to QRS complex ratio. Key intervals including the PR interval, QRS duration, and QTc appear within normal physiologic limits. This diagnostic image serves as a clinical example of sinus node-driven bradycardia without evidence of advanced heart block or acute ST-segment changes.
sinus tachycardia ECG rhythm strip
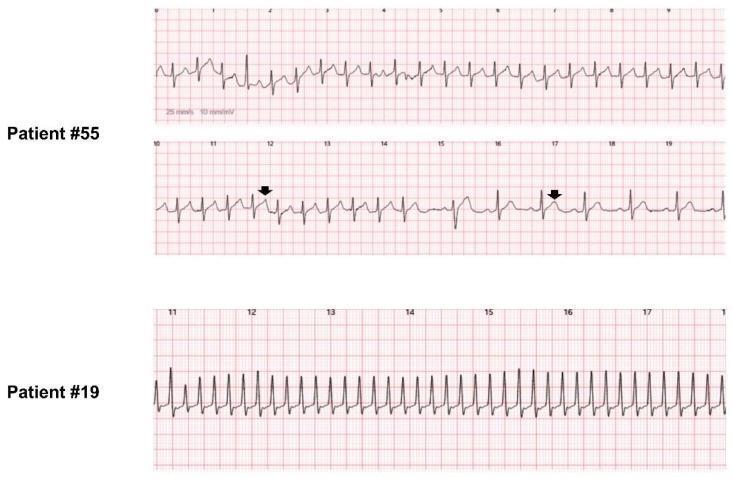
This diagnostic image displays three electrocardiography (ECG) rhythm strips recorded by a watch-type wearable device (w-ECG) for two different patients. The upper two strips (Patient #55) illustrate paroxysmal supraventricular tachycardia (PSVT), specifically atrioventricular nodal reentrant tachycardia (AVNRT), fast-slow type. Black arrows highlight distinct differences in T-wave morphology between tachycardia and sinus rhythm phases, indicating variations in ventricular repolarization. The middle strip captures the sudden termination of tachycardia with an 'A-no-V' mode of termination. The bottom strip (Patient #19) demonstrates a narrow QRS complex tachycardia characterized by a regular, rapid rhythm and consistent morphology, later diagnosed as atypical atrial flutter following radiofrequency catheter ablation for atrial fibrillation. The comparison demonstrates the clinical utility of w-ECG devices in discriminating QRS morphology, detecting P-waves, and identifying subtle repolarization changes in cardiac arrhythmias like SVT and atrial flutter for diagnostic and post-procedural monitoring.
This diagnostic image consists of six 3-lead electrocardiogram (ECG) rhythm strips, labeled A through F, recorded at a paper speed of 25 mm/s. The series demonstrates the progression and resolution of drug-induced cardiac conduction disturbances in a patient. Strip A shows tachycardia with second-degree atrioventricular (AV) block Mobitz Type I (Wenckebach). Strip B illustrates severe sinus bradycardia and sinus arrest with a prolonged R-R interval. Strip C reveals persistent sinus arrest and first-degree AV block. Strip D displays a return to a more regular rhythm but with continued evidence of prolonged PR intervals and Mobitz Type I conduction patterns. Strip E shows intermittent first-degree AV block with improved heart rate during medical management. Finally, Strip F demonstrates a stable sinus rhythm with a residual first-degree AV block after the discontinuation of the suspected causative medication (escitalopram). These strips collectively highlight various arrhythmias including sinus node dysfunction, AV conduction delays, and rhythm changes associated with pharmacotherapy monitoring.
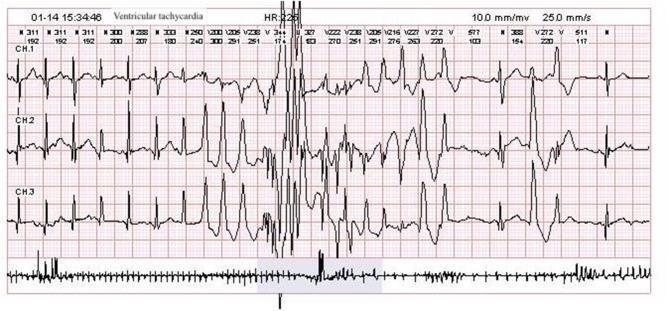
This diagnostic image is a 24-hour Holter monitoring ECG strip showing a transient episode of ventricular tachycardia (VT). The tracing is organized into three simultaneous channels (CH.1, CH.2, and CH.3) displaying cardiac electrical activity. The central portion of the strip captures a paroxysm of wide-complex tachycardia with a recorded heart rate (HR) of 225 bpm. The ventricular complexes exhibit marked pleomorphism (varying morphologies) and irregular R-R intervals, indicating a non-sustained, unstable ventricular rhythm. Preceding and following the VT episode, the tracing shows a return to a slower, more regular baseline rhythm with narrow QRS complexes, though some premature ventricular contractions are visible. Annotations at the top of the strip provide numerical data for R-R intervals and heart rate. This visual is clinically significant for demonstrating malignant arrhythmias that can occur post-seizure, serving as an educational example of polymorphic ventricular tachycardia and the transition from sinus rhythm to ventricular arrhythmia.
atrial fibrillation ECG irregularly irregular rhythm
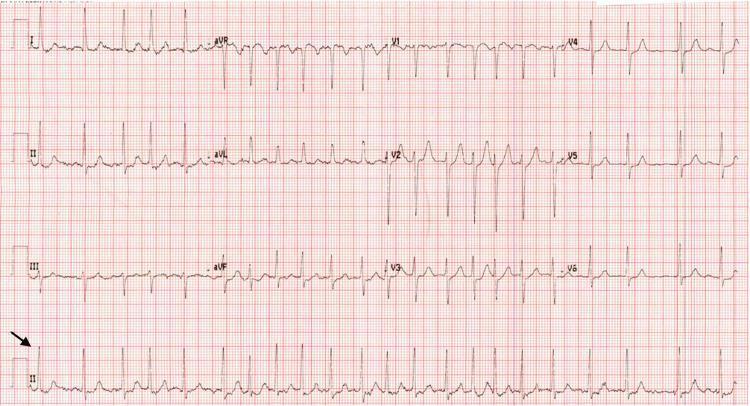
This diagnostic image is a 12-lead electrocardiogram (ECG) printed on standard grid paper, demonstrating new-onset atrial fibrillation. The ECG displays the standard limb leads (I, II, III), augmented limb leads (aVR, aVL, aVF), and precordial leads (V1-V6), with a rhythm strip for lead II at the bottom. The tracing is characterized by an irregularly irregular rhythm and the absence of discernible P waves. In their place, the baseline exhibits fine, irregular fibrillatory (f) waves, most prominently seen in lead V1 and the rhythm strip (indicated by a black arrow). The QRS complexes appear narrow and vary in their R-R intervals, a hallmark of irregular ventricular response in atrial fibrillation. Precordial leads V1 through V6 show a progression of R-wave amplitude. There is no evidence of significant ST-segment elevation or depression, suggesting an absence of acute myocardial infarction. This visual serves as a classic educational example of atrial fibrillation pathophysiology and diagnostic ECG features.
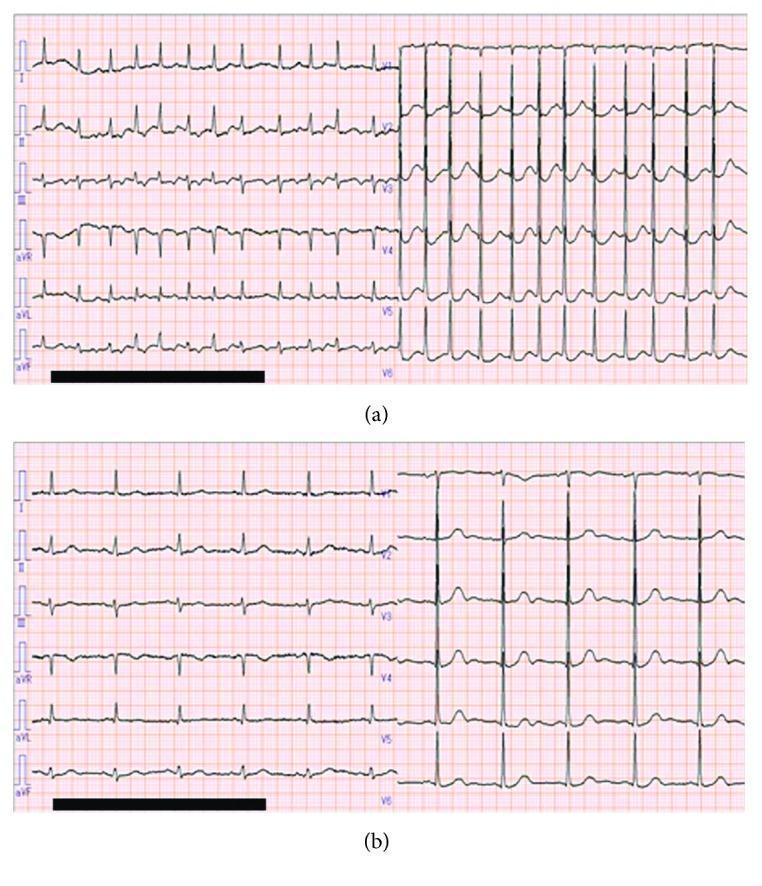
A comparative presentation of two 12-lead electrocardiogram (ECG) tracings from the same patient, demonstrating spontaneous rhythm alternation. (a) Top tracing: ECG showing atrial fibrillation (AF) characterized by an irregularly irregular rhythm, high ventricular rate, and the absence of discernible P waves. Fibrillatory waves are most prominent in the precordial leads (V1-V6), while the limb leads show inconsistent baseline morphology. (b) Bottom tracing: ECG demonstrating a return to normal sinus rhythm (SR). This tracing displays a regular rhythm with a slower heart rate, consistent R-R intervals, and clear P waves preceding each QRS complex across all leads (I, II, III, aVR, aVL, aVF, and V1-V6). The QRS complexes maintain similar morphology in both states. This visual comparison illustrates the diagnostic criteria for paroxysmal atrial fibrillation and its conversion to sinus rhythm in a clinical setting.
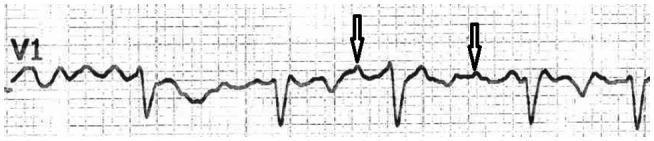
This diagnostic image shows a rhythm strip from an electrocardiogram (ECG) specifically recorded from lead V1. The tracing displays an irregular cardiac rhythm characteristic of atrial fibrillation. A key visual feature is the presence of coarse fibrillatory waves (F-waves), which are identified by vertical arrows. These coarse F-waves demonstrate an amplitude of ≥0.5 mm, creating a distinct, high-amplitude oscillatory baseline between the QRS complexes. The morphology of these waves is somewhat irregular and pointed compared to the smoother baseline oscillations seen in fine atrial fibrillation. The QRS complexes appear narrow and occur at irregular intervals (irregularly irregular), consistent with the underlying arrhythmia. This image serves as an educational example in cardiology for distinguishing coarse atrial fibrillation from other supraventricular tachyarrhythmias and for the quantification of fibrillatory wave voltage in clinical diagnostics.
atrial flutter ECG sawtooth pattern
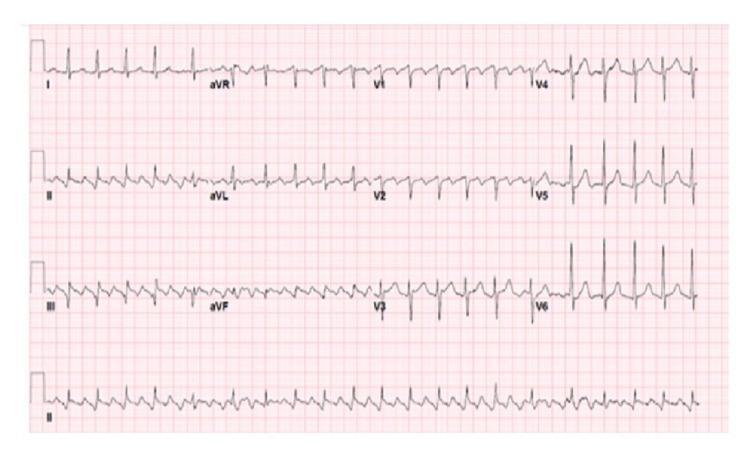
A 12-lead electrocardiogram (ECG) demonstrating typical atrial flutter with variable atrioventricular (AV) block. The tracing shows a classic 'sawtooth' baseline pattern, most prominent in the inferior leads (II, III, and aVF), representing rapid, regular macro-reentrant atrial activity (F-waves). The ventricular response (QRS complexes) is irregularly irregular because the AV node conducts atrial impulses at varying ratios (e.g., 2:1, 3:1, or 4:1 conduction). This diagnostic image is a key educational resource for cardiology, illustrating the distinction between atrial flutter and atrial fibrillation through the presence of organized, repetitive atrial waveforms. The QRS complexes appear narrow, indicating normal intraventricular conduction. This ECG provides a clinical example of supraventricular tachycardia and the importance of identifying baseline atrial morphology when assessing irregular rhythms.
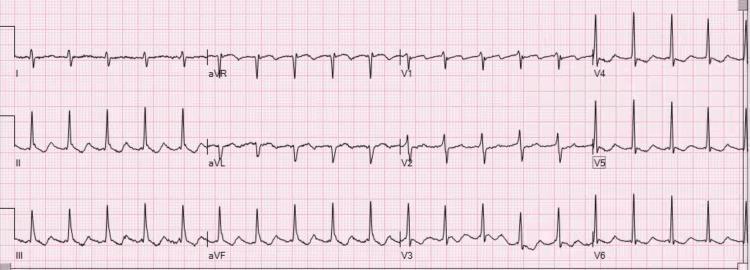
Diagnostic Image: This 12-lead electrocardiogram (ECG) demonstrates atrial flutter with a 2:1 atrioventricular (AV) conduction ratio. The tracing shows highly regular atrial activity with a characteristic sawtooth morphology. In the inferior leads (II, III, and aVF), the flutter waves are distinctly positive (upright), while in lead V1, the flutter waves exhibit a negative (inverted) polarity. This specific polarity pattern—upright flutter waves in the inferior leads and inverted in V1—is diagnostic of clockwise typical atrial flutter (atypical by counter-clockwise standards). The QRS complexes are regular and narrow, occurring at approximately half the frequency of the atrial rate (atrial rate ~300 bpm; ventricular rate ~150 bpm). In the precordial leads V4-V6, the QRS and T-wave morphologies are preserved, although discrete P waves are replaced by the undulating flutter baseline. The image illustrates a classic supraventricular tachycardia frequently encountered in cardiology and emergency medicine, serving as an educational example of macro-reentrant atrial rhythms.
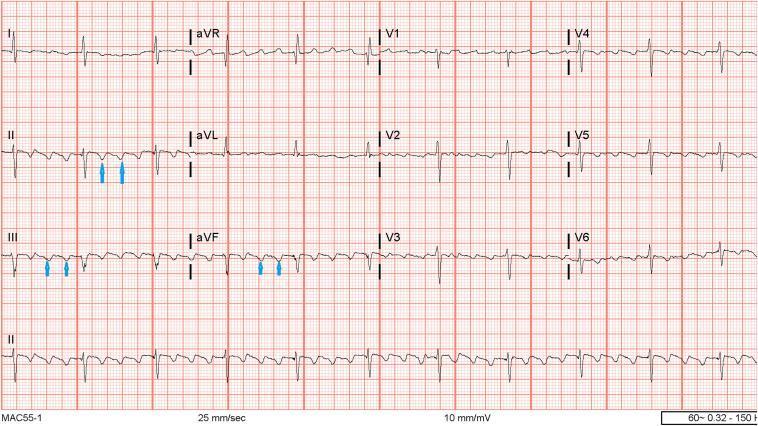
A standard 12-lead electrocardiogram (ECG) displayed on a traditional grid background (25 mm/sec, 10 mm/mV). The tracing demonstrates typical Atrial Flutter (AFL). The most prominent feature is the continuous 'sawtooth' baseline pattern, consisting of rapid, regular flutter waves (F waves). These F waves are most clearly visualized in the inferior leads (II, III, and aVF), where they exhibit a predominantly negative deflection. Blue arrows in leads II, III, and aVF highlight these recurring macro-reentrant atrial oscillations. The ventricular rhythm is regular, suggesting a fixed atrioventricular (AV) conduction ratio, likely 2:1 or 4:1 given the flutter rate. Normal QRS complexes and T waves are present across all leads but are superimposed upon the undulating flutter baseline. Precordial leads (V1-V6) show small, upright flutter waves in V1, typical for counterclockwise cavotricuspid isthmus-dependent atrial flutter. This diagnostic image serves as a classic educational example for identifying supraventricular tachyarrhythmias and understanding the morphology of counterclockwise atrial flutter.
paroxysmal supraventricular tachycardia ECG
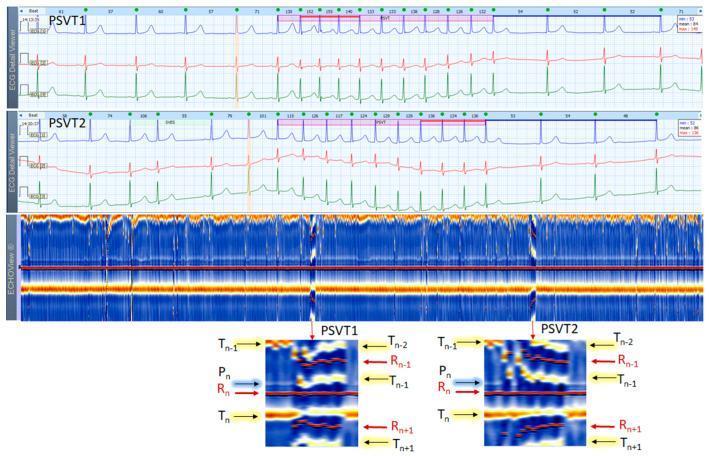
This composite medical image displays two 3-lead Holter ECG strips and a corresponding ECHOView color map from a 37-year-old female patient, illustrating paroxysmal supraventricular tachycardia (PSVT). The top panels show traditional ECG traces highlighting two PSVT episodes (PSVT1 and PSVT2) boxed in pink, characterized by rapid, narrow QRS complexes and heart rates between 115-155 bpm. The middle panel presents the ECHOView color map, which transforms ECG amplitudes into a color-coded visualization. A central horizontal red line represents the R-peaks (ventricular depolarization) used for beat alignment. Orange-white horizontal bands indicate T-waves (ventricular repolarization), while blue-white traces represent P-waves (atrial depolarization). The bottom zoomed sections specifically detail the PSVT episodes, showing the interruption of the normal P-wave band and the embedding of the P-wave (Pn) into the preceding T-wave (Tn-1). This visual evidence aids in differentiating between supraventricular tachycardia subtypes, such as atrioventricular reentrant tachycardia (AVRT) versus atrioventricular nodal reentrant tachycardia (AVNRT).
This diagnostic image displays three electrocardiography (ECG) rhythm strips recorded by a watch-type wearable device (w-ECG) for two different patients. The upper two strips (Patient #55) illustrate paroxysmal supraventricular tachycardia (PSVT), specifically atrioventricular nodal reentrant tachycardia (AVNRT), fast-slow type. Black arrows highlight distinct differences in T-wave morphology between tachycardia and sinus rhythm phases, indicating variations in ventricular repolarization. The middle strip captures the sudden termination of tachycardia with an 'A-no-V' mode of termination. The bottom strip (Patient #19) demonstrates a narrow QRS complex tachycardia characterized by a regular, rapid rhythm and consistent morphology, later diagnosed as atypical atrial flutter following radiofrequency catheter ablation for atrial fibrillation. The comparison demonstrates the clinical utility of w-ECG devices in discriminating QRS morphology, detecting P-waves, and identifying subtle repolarization changes in cardiac arrhythmias like SVT and atrial flutter for diagnostic and post-procedural monitoring.
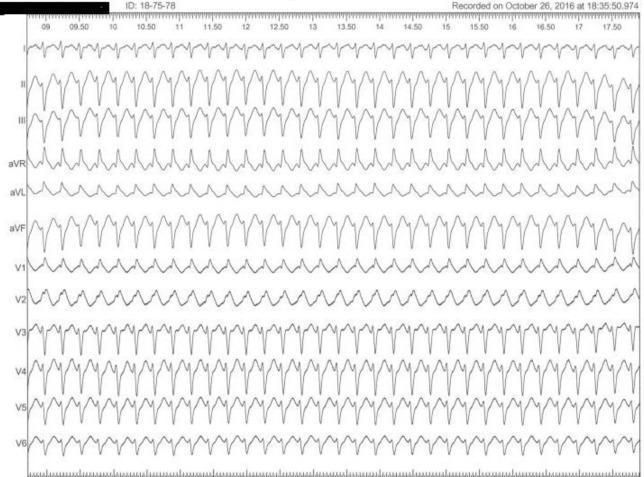
This diagnostic image shows a standard 12-lead surface electrocardiogram (ECG) recorded during a clinical episode of palpitations. The tracing displays a regular, narrow-complex supraventricular tachycardia (SVT). The rhythm is characterized by a rapid heart rate with consistent R-R intervals across all leads (I, II, III, aVR, aVL, aVF, and V1–V6). In the precordial leads V3–V6, the QRS complexes exhibit sharp peaks, while the limb leads (I, II, III, aVR, aVL, aVF) demonstrate relatively broader morphologies with steep ascents and descents. Leads V1 and V2 show lower voltage amplitude compared to the lateral leads. P-waves are not clearly discernible before each QRS complex, suggesting a tachyarrhythmia such as Atrioventricular Nodal Reentrant Tachycardia (AVNRT), which was later confirmed via electrophysiology study (EPS). The horizontal axis includes time markers from 09.00 to 17.50 seconds, indicating a stable morphology throughout the recording period. This ECG is a key educational tool for identifying supraventricular tachycardias in patients with structurally normal hearts complaining of paroxysmal palpitations.
first degree AV block prolonged PR interval ECG
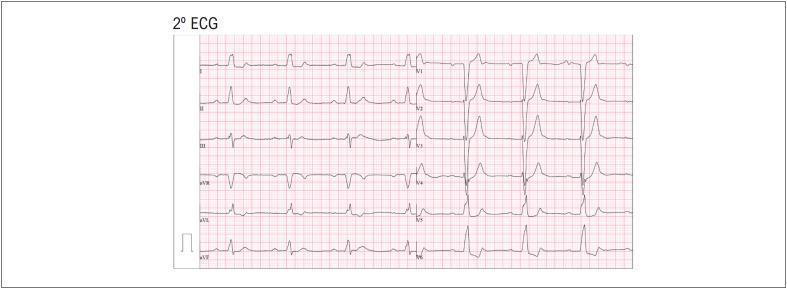
A 12-lead diagnostic electrocardiogram (ECG) demonstrating a persistent left bundle branch block (LBBB) accompanied by a first-degree atrioventricular (AV) block. The ECG shows a regular rhythm with a prolonged PR interval measured at 320ms, consistent with first-degree AV delay. Key features of LBBB are present, including wide, prolonged QRS complexes throughout the tracing. Specifically, the precordial leads V1 and V2 exhibit deep, predominantly negative S waves, while the lateral leads V5 and V6 demonstrate tall, predominantly positive R waves with characteristic notching. This combination of conduction disturbances in an elderly patient suggests significant His-Purkinje system disease or structural cardiac changes such as fibrosis. The image serves as an educational example of intraventricular conduction delay and fixed AV nodal delay within the context of complex arrhythmias.
This diagnostic image consists of six 3-lead electrocardiogram (ECG) rhythm strips, labeled A through F, recorded at a paper speed of 25 mm/s. The series demonstrates the progression and resolution of drug-induced cardiac conduction disturbances in a patient. Strip A shows tachycardia with second-degree atrioventricular (AV) block Mobitz Type I (Wenckebach). Strip B illustrates severe sinus bradycardia and sinus arrest with a prolonged R-R interval. Strip C reveals persistent sinus arrest and first-degree AV block. Strip D displays a return to a more regular rhythm but with continued evidence of prolonged PR intervals and Mobitz Type I conduction patterns. Strip E shows intermittent first-degree AV block with improved heart rate during medical management. Finally, Strip F demonstrates a stable sinus rhythm with a residual first-degree AV block after the discontinuation of the suspected causative medication (escitalopram). These strips collectively highlight various arrhythmias including sinus node dysfunction, AV conduction delays, and rhythm changes associated with pharmacotherapy monitoring.
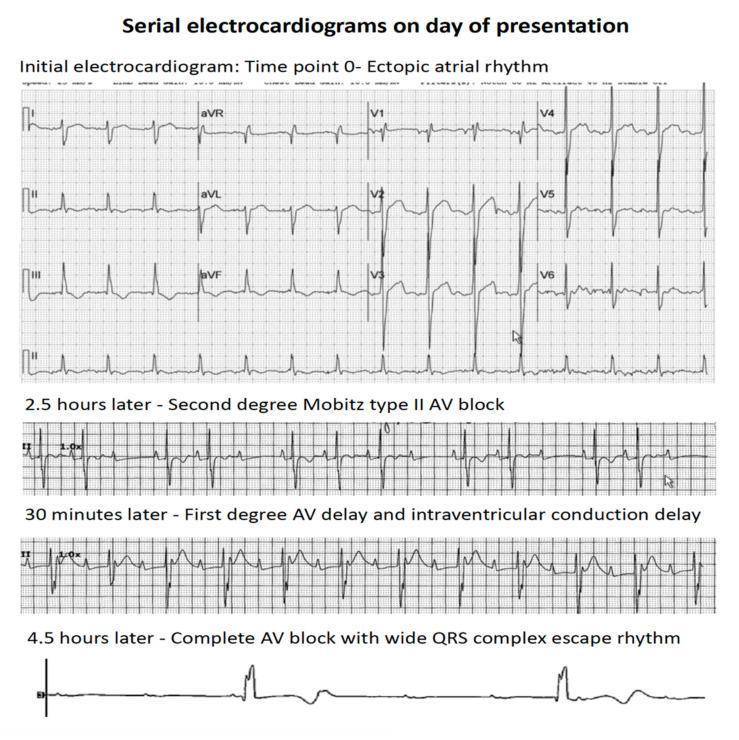
This diagnostic image consists of a series of four electrocardiogram (ECG) rhythm strips demonstrating the rapid clinical progression of atrioventricular (AV) conduction abnormalities over a period of 4.5 hours. The top panel, labeled 'Time point 0', shows an ectopic atrial rhythm with organized P-wave activity and narrow QRS complexes. The second strip, recorded 2.5 hours later, displays a second-degree Mobitz type II AV block, characterized by intermittently dropped QRS complexes without preceding PR interval lengthening. The third strip, 30 minutes later, indicates a first-degree AV delay (prolonged PR interval) and intraventricular conduction delay (widened QRS). The final rhythm strip at 4.5 hours shows third-degree (complete) AV block, characterized by complete AV dissociation and a slow, wide QRS complex ventricular escape rhythm. This progression illustrates acute cardiac conduction system failure, typically associated with myocardial infiltration or severe injury, as seen in patients with leukemic infiltration of the heart.
Mobitz type I Wenckebach second degree AV block ECG
This diagnostic image consists of six 3-lead electrocardiogram (ECG) rhythm strips, labeled A through F, recorded at a paper speed of 25 mm/s. The series demonstrates the progression and resolution of drug-induced cardiac conduction disturbances in a patient. Strip A shows tachycardia with second-degree atrioventricular (AV) block Mobitz Type I (Wenckebach). Strip B illustrates severe sinus bradycardia and sinus arrest with a prolonged R-R interval. Strip C reveals persistent sinus arrest and first-degree AV block. Strip D displays a return to a more regular rhythm but with continued evidence of prolonged PR intervals and Mobitz Type I conduction patterns. Strip E shows intermittent first-degree AV block with improved heart rate during medical management. Finally, Strip F demonstrates a stable sinus rhythm with a residual first-degree AV block after the discontinuation of the suspected causative medication (escitalopram). These strips collectively highlight various arrhythmias including sinus node dysfunction, AV conduction delays, and rhythm changes associated with pharmacotherapy monitoring.
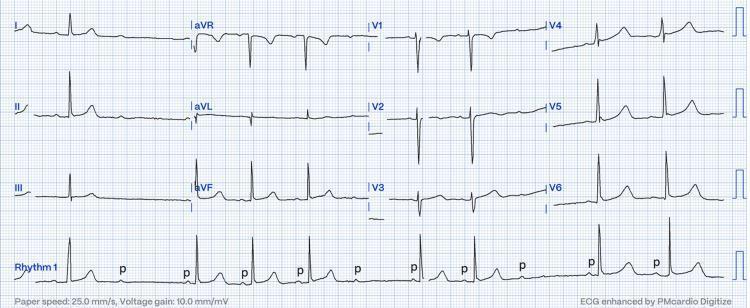
A standard 12-lead electrocardiogram (ECG) displayed on a traditional grid background with a continuous rhythm strip (Rhythm 1) along the bottom. The tracing illustrates Mobitz type II second-degree atrioventricular (AV) block. The diagnostic hallmark is visible in the rhythm strip: regular P waves are present, but there is an abrupt failure of AV conduction where a P wave (labeled with lowercase 'p') is not followed by a QRS complex. Unlike Mobitz type I (Wenckebach), the conducted beats show a constant and normal PR interval without progressive lengthening prior to the dropped beat. The ECG shows a slow heart rate (bradycardia) consistent with intermittent 2:1 or high-grade AV block. Waveform morphology includes narrow QRS complexes, suggesting the block is likely occurring at the level of the AV node or the Bundle of His. This clinical photograph serves as an educational tool for identifying advanced cardiac conduction system disease and distinguishing between subtypes of second-degree heart block in a clinical or obstetric setting.
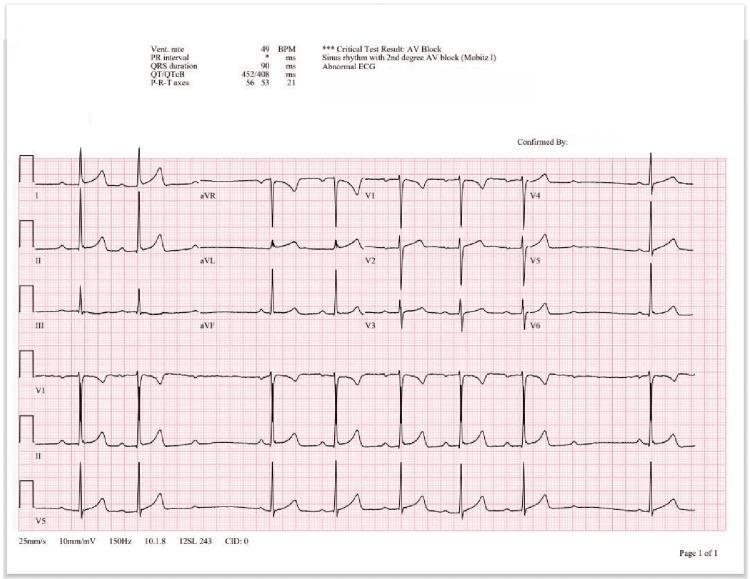
A standard 12-lead electrocardiogram (ECG) presented on a red-grid background, displaying leads I, II, III, aVR, aVL, aVF, and V1–V6. The ECG illustrates a classic Second-Degree Atrioventricular (AV) Block, specifically Mobitz Type I (Wenckebach phenomenon). The visual hallmark demonstrated is the progressive lengthening of the PR interval in successive beats until a P-wave is blocked and fails to conduct, resulting in a dropped QRS complex. The automated interpretation header identifies a bradycardic ventricular rate of 49 BPM, a QRS duration of 90 ms, and a diagnosis of sinus rhythm with Mobitz I AV block. The tracing shows normal QRS and T-wave morphology. Technical specifications noted at the footer include a paper speed of 25 mm/s, voltage calibration of 10 mm/mV, and a 150 Hz filter. This visual serves as a primary educational example for differentiating types of AV nodal conduction delays and recognizing non-linear cardiac rhythms.
Mobitz type II second degree AV block ECG
A standard 12-lead electrocardiogram (ECG) displayed on a traditional grid background with a continuous rhythm strip (Rhythm 1) along the bottom. The tracing illustrates Mobitz type II second-degree atrioventricular (AV) block. The diagnostic hallmark is visible in the rhythm strip: regular P waves are present, but there is an abrupt failure of AV conduction where a P wave (labeled with lowercase 'p') is not followed by a QRS complex. Unlike Mobitz type I (Wenckebach), the conducted beats show a constant and normal PR interval without progressive lengthening prior to the dropped beat. The ECG shows a slow heart rate (bradycardia) consistent with intermittent 2:1 or high-grade AV block. Waveform morphology includes narrow QRS complexes, suggesting the block is likely occurring at the level of the AV node or the Bundle of His. This clinical photograph serves as an educational tool for identifying advanced cardiac conduction system disease and distinguishing between subtypes of second-degree heart block in a clinical or obstetric setting.
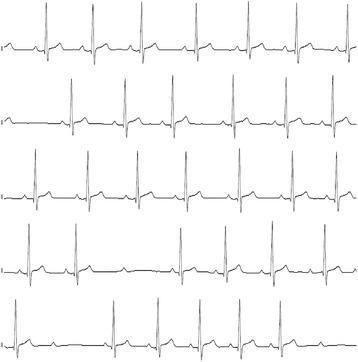
This diagnostic image consists of five continuous electrocardiogram (ECG) rhythm strips demonstrating a second-degree atrioventricular (AV) block, specifically Mobitz Type II. The strips show a regular sinus rhythm with normal P-wave morphology. The PR interval remains constant for conducted beats; however, there are intermittent, non-conducted P-waves (dropped QRS complexes) that occur without prior PR interval lengthening, which is characteristic of Mobitz Type II block. In several sections, the rhythm displays a 2:1 conduction pattern. The QRS complexes appear narrow, suggesting the site of the block is likely at the level of the Bundle of His. This finding is clinically significant as it represents a failure of conduction below the AV node and can progress to complete heart block. In this specific educational context, the arrhythmia is associated with a severe hypothyroid state and bradycardia.
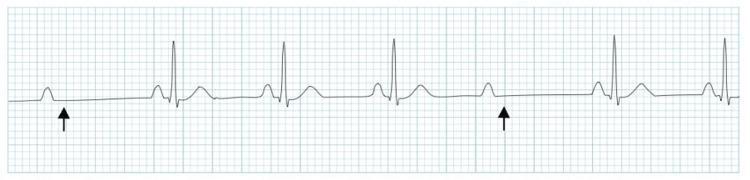
This diagnostic image is an electrocardiogram (ECG) rhythm strip illustrating Mobitz Type II second-degree atrioventricular (AV) block. The strip shows a series of P waves with a constant PR interval for conducted beats. Black arrows highlight specific P waves that are not followed by a QRS complex, indicating an intermittent failure of conduction through the AV node or His-Purkinje system. Unlike Mobitz Type I, there is no progressive lengthening of the PR interval before the dropped beat. The QRS complexes that are conducted appear narrow and maintain a consistent morphology. This rhythm strip is a classic clinical example used to teach cardiac conduction abnormalities, specifically distinguishing high-grade AV blocks that often require permanent pacemaker intervention due to the risk of progression to complete heart block.
complete heart block third degree AV block ECG
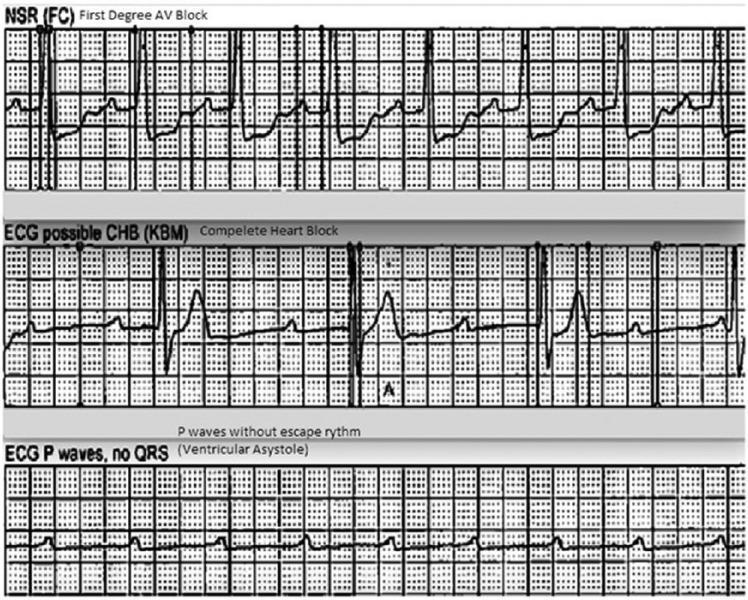
This diagnostic image displays a vertical comparison of three ECG rhythm strips demonstrating the progression and characteristics of different cardiac conduction abnormalities. The top strip, labeled 'NSR (FC) First Degree AV Block,' shows a sinus rhythm with a prolonged PR interval, indicating a delay in conduction between the atria and ventricles. The middle strip, labeled 'ECG possible CHB (KBM) Complete Heart Block,' illustrates third-degree atrioventricular (AV) block characterized by complete AV dissociation; P waves are present but occur independently of the slow, irregular QRS complexes (escape rhythm). The bottom strip, labeled 'ECG P waves, no QRS (Ventricular Asystole),' depicts a high-grade block where atrial activity (P waves) continues, but there is a total failure of ventricular conduction resulting in ventricular asystole. This sequence serves as an educational tool for identifying varying severity levels of heart blocks and the transition from conduction delay to lethal ventricular standstill.
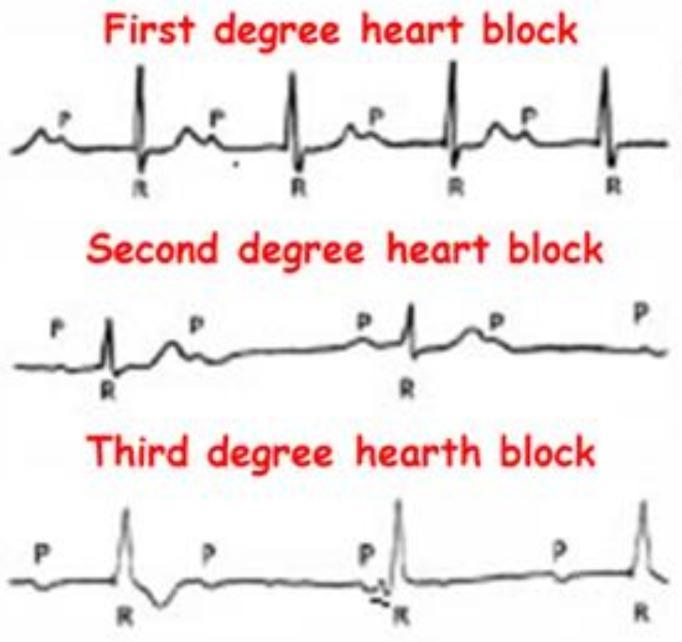
This Comparison Chart illustrates the electrocardiographic (ECG) characteristics of Atrioventricular (AV) blocks. It features three stacked rhythm strips categorized as First, Second, and Third-degree heart blocks, emphasizing the relationship between P waves (atrial depolarization) and QRS complexes (ventricular depolarization). The 'First degree heart block' panel demonstrates a consistent 1:1 P-to-QRS ratio with a fixed, prolonged PR interval. The 'Second degree heart block' panel shows intermittent conduction failure, where specific P waves are not followed by a QRS complex. The 'Third degree heart block' panel depicts complete AV dissociation, where P waves and QRS complexes occur independently and at different rates, indicating a total interruption of impulse transmission and the presence of a ventricular escape rhythm. This diagnostic illustration is designed for cardiovascular education to help students and clinicians distinguish between different stages of cardiac conduction system disease and their associated clinical significance.
This diagnostic image consists of a series of four electrocardiogram (ECG) rhythm strips demonstrating the rapid clinical progression of atrioventricular (AV) conduction abnormalities over a period of 4.5 hours. The top panel, labeled 'Time point 0', shows an ectopic atrial rhythm with organized P-wave activity and narrow QRS complexes. The second strip, recorded 2.5 hours later, displays a second-degree Mobitz type II AV block, characterized by intermittently dropped QRS complexes without preceding PR interval lengthening. The third strip, 30 minutes later, indicates a first-degree AV delay (prolonged PR interval) and intraventricular conduction delay (widened QRS). The final rhythm strip at 4.5 hours shows third-degree (complete) AV block, characterized by complete AV dissociation and a slow, wide QRS complex ventricular escape rhythm. This progression illustrates acute cardiac conduction system failure, typically associated with myocardial infiltration or severe injury, as seen in patients with leukemic infiltration of the heart.
~/ecg-workbook/build_workbook.py
import os, urllib.request
from reportlab.lib.pagesizes import letter
from reportlab.lib.units import inch
from reportlab.lib import colors
from reportlab.platypus import (SimpleDocTemplate, Paragraph, Spacer, Table, TableStyle,
                                 Image as RLImage, PageBreak, HRFlowable, KeepTogether)
from reportlab.lib.styles import getSampleStyleSheet, ParagraphStyle
from PIL import Image as PILImage

OUTDIR = "/tmp/workspace/ecg-workbook"
IMGDIR = os.path.join(OUTDIR, "images")
os.makedirs(IMGDIR, exist_ok=True)

styles = getSampleStyleSheet()
title_style = ParagraphStyle('TitleX', parent=styles['Title'], fontSize=18, textColor=colors.HexColor('#0b3d5c'))
subtitle_style = ParagraphStyle('SubtitleX', parent=styles['Normal'], fontSize=10, alignment=1, textColor=colors.HexColor('#444444'))
case_header = ParagraphStyle('CaseHeader', parent=styles['Heading1'], fontSize=13, textColor=colors.white,
                              backColor=colors.HexColor('#0b3d5c'), leftIndent=4, borderPadding=(5,5,5,5), spaceAfter=6)
vignette_style = ParagraphStyle('Vignette', parent=styles['Normal'], fontSize=10, leading=13, spaceAfter=6,
                                 backColor=colors.HexColor('#f2f2f2'), borderPadding=(6,6,6,6))
q_style = ParagraphStyle('Q', parent=styles['Normal'], fontSize=9.3, leading=15, spaceAfter=3)
ans_header = ParagraphStyle('AnsHeader', parent=styles['Heading2'], fontSize=11, textColor=colors.HexColor('#0b3d5c'), spaceBefore=10, spaceAfter=3)
ans_body = ParagraphStyle('AnsBody', parent=styles['Normal'], fontSize=9.3, leading=13, spaceAfter=4)
small = ParagraphStyle('Small', parent=styles['Normal'], fontSize=7.8, leading=10, textColor=colors.HexColor('#555555'))

QUESTIONS = [
    "1. Rate — what is the ventricular rate?",
    "2. Rhythm — regular or irregular? If irregular, regularly or irregularly irregular?",
    "3. Is there a P wave before every QRS, and a QRS after every P wave?",
    "4. Axis — normal, left, or right deviation? (Lead I / aVF)",
    "5. PR interval — normal, prolonged, or short?",
    "6. QRS — width and morphology (narrow/wide, any bundle branch block pattern)?",
    "7. ST segment — elevated, depressed, or isoelectric? Which leads/territory?",
    "8. T waves — normal, peaked, inverted, or hyperacute?",
    "9. QT/QTc — normal or prolonged?",
    "10. Your interpretation and immediate next step:",
]

cases = [
  dict(n=1, title="Normal Sinus Rhythm", vignette="A 34-year-old man presents for a pre-employment physical exam. He is asymptomatic with no cardiac history. A baseline ECG is obtained as part of the workup.",
       img="https://cdn.orris.care/cdss_images/pmc_clinical_VQA_17c9cbbfc656b3046696570fd4b151f959c895f498adcebe5ebecf4af15cbbe6.jpg",
       answer="Normal sinus rhythm. Upright P wave precedes every QRS in leads II and V1 at a regular rate; PR, QRS, and QTc all within normal limits. No ST-T abnormality. No intervention needed — this is the baseline you compare every abnormal tracing against."),
  dict(n=2, title="Sinus Bradycardia", vignette="A 68-year-old lifelong marathon runner comes in for a routine check-up. He is asymptomatic. Triage records a pulse of 42/min.",
       img="https://cdn.orris.care/cdss_images/pmc_clinical_VQA_4b690f72cb68c0bc42f5c8d8c8e28186b7b233133d43aa4a8ab9c1467dd1f114.jpg",
       answer="Marked sinus bradycardia at ~42 bpm. Rhythm remains regular with a 1:1 P-to-QRS ratio; PR, QRS, and QTc are all normal. In an asymptomatic athlete this reflects high resting vagal tone and is benign — treat the patient, not the number, and intervene only if symptomatic (syncope, fatigue, hypotension)."),
  dict(n=3, title="Sinus Tachycardia", vignette="A 52-year-old woman is recovering on the floor after catheter ablation for atrial fibrillation. She feels mildly anxious. Monitor shows a rate of ~120/min.",
       img="https://cdn.orris.care/cdss_images/pmc_clinical_VQA_45d89debeadae4f4c90e3d517c20ca473c462082986b38508ab6c99270c60b2a.jpg",
       answer="Sinus tachycardia at ~120 bpm — narrow QRS, discernible P wave before each complex, uniform morphology across all leads. This is not a primary arrhythmia; it is a physiologic response. Work the underlying cause: pain, anxiety, hypovolemia, fever, anemia, or thyrotoxicosis rather than treating the rate itself."),
  dict(n=4, title="New-Onset Atrial Fibrillation", vignette="A 77-year-old woman with hypertension presents with sudden palpitations. Her radial pulse is irregular and cannot be reliably counted.",
       img="https://cdn.orris.care/cdss_images/pmc_clinical_VQA_333b84c1869147154747f5916492705fa2c41fdebf5af80311f90637c65ab670.jpg",
       answer="Irregularly irregular narrow-complex rhythm with no discernible discrete P waves; fine fibrillatory (f) waves are seen best in V1 and the lead II rhythm strip. This is new-onset atrial fibrillation. Next steps: calculate CHA2DS2-VASc for anticoagulation, decide rate vs. rhythm control, and look for a precipitant (thyroid, sepsis, alcohol, ischemia)."),
  dict(n=5, title="Atrial Flutter with 2:1 Conduction", vignette="A 61-year-old man with COPD presents with palpitations. His pulse is regular at 150/min.",
       img="https://cdn.orris.care/cdss_images/pmc_clinical_VQA_6a856fdaf3eb67189da5ecd9d26daac349352488ca84359add5e70a2a8d6bbff.jpg",
       answer="Regular narrow-complex tachycardia at exactly ~150 bpm should always raise suspicion for atrial flutter with fixed 2:1 AV block — the atrial rate here is ~300/min conducting 2:1 to the ventricles. Classic sawtooth flutter waves are seen in the inferior leads. Any perfectly regular SVT at 150 deserves a very close look at the baseline between QRS complexes for flutter waves before calling it sinus tachycardia."),
  dict(n=6, title="Paroxysmal SVT (AVNRT)", vignette="A 29-year-old woman with no cardiac history reports sudden-onset palpitations that started while climbing stairs. Rate on the monitor is ~180/min.",
       img="https://cdn.orris.care/cdss_images/pmc_clinical_VQA_385dc777973f665d6a84d5b3a78b639377a2469111a7147035f7fdc493fba5cb.jpg",
       answer="Regular, narrow-complex tachycardia with no clearly visible P waves (likely buried within the QRS/T wave) — consistent with AV nodal reentrant tachycardia (AVNRT), later confirmed by electrophysiology study in the source case. Management: vagal maneuvers first, then IV adenosine; synchronized cardioversion if hemodynamically unstable."),
  dict(n=7, title="First-Degree AV Block with LBBB", vignette="An 80-year-old man has a routine ECG before elective surgery. He is asymptomatic. The PR interval measures 320 ms.",
       img="https://cdn.orris.care/cdss_images/pmc_clinical_VQA_57004f2a3218298375c037644183387512aaaf03609ba615763ba0341b297d31.jpg",
       answer="Markedly prolonged PR interval (320 ms) = first-degree AV block, occurring together with a left bundle branch block pattern (deep S waves V1-V2, tall notched R waves V5-V6). The combination suggests diffuse conduction system disease (AV node plus His-Purkinje). Warrants cardiology follow-up and monitoring for progression to higher-degree block, even though the patient is currently asymptomatic."),
  dict(n=8, title="Mobitz Type I (Wenckebach) AV Block", vignette="A 55-year-old man on a beta-blocker for hypertension has a routine ECG showing a heart rate of 49/min with occasional dropped beats.",
       img="https://cdn.orris.care/cdss_images/pmc_clinical_VQA_042c4a42fd6beefae8c56ee7f2370ec31a2662d09c762623de9dc985dcf03900.jpg",
       answer="Progressive lengthening of the PR interval across successive beats until a P wave fails to conduct and a QRS is dropped = Mobitz Type I (Wenckebach) second-degree AV block. The block is almost always at the level of the AV node itself. Often reversible — reassess/withdraw the offending drug (beta-blocker) and reassess; usually does not need a pacemaker unless symptomatic."),
  dict(n=9, title="Mobitz Type II AV Block", vignette="A 74-year-old woman with untreated hypothyroidism reports several episodes of presyncope. Her ECG shows intermittently dropped QRS complexes.",
       img="https://cdn.orris.care/cdss_images/pmc_clinical_VQA_41c9fd8ee718ad8d707a8aea89b4e3fd5b6e99512f0e82d05556e3a6e28f0af3.jpg",
       answer="Constant PR interval on conducted beats with an abrupt, unpredictable failure of a P wave to conduct (no progressive PR lengthening beforehand) = Mobitz Type II. This localizes to disease below the AV node (His-Purkinje system) and carries a real risk of progression to complete heart block. Generally an indication for permanent pacemaker even if currently only mildly symptomatic."),
  dict(n=10, title="Comparing All Three Degrees of AV Block", vignette="Use the reference chart below (three stacked strips) to identify first-, second-, and third-degree AV block and state the key distinguishing feature of each.",
       img="https://cdn.orris.care/cdss_images/pmc_clinical_VQA_11ac037ff7836678ddd7fad143600ed71c2a3910d226a34ea257a3618beab0a5.jpg",
       answer="Top strip (1st degree): every P conducts, but the PR interval is fixed and abnormally long. Middle strip (2nd degree): some P waves fail to conduct a QRS (dropped beats), while others still get through. Bottom strip (3rd degree/complete): P waves and QRS complexes occur completely independently of each other (AV dissociation) with a slow ventricular escape rhythm — complete heart block generally requires a pacemaker, especially if symptomatic or the escape rhythm is unstable."),
  dict(n=11, title="RBBB vs LBBB — Pattern Recognition", vignette="Study the reference figure comparing normal, RBBB, and LBBB morphology in leads V1 and V6, then state which pattern is which and why.",
       img="https://cdn.orris.care/cdss_images/HARRISON_1763035439284_67dcb557-7517-4e16-97b2-44078b873c5d.png",
       answer="RBBB: V1 shows an rSR' (\"rabbit ears\"/M-shaped) complex; V6 shows a broad terminal S wave (qRS). LBBB: V1 shows a broad, deep S wave with no rSR'; V6 shows a broad, notched R wave with no septal Q wave. Both blocks produce secondary T-wave inversion in the leads with the abnormal QRS — that T-wave discordance is expected and not itself a sign of ischemia."),
  dict(n=12, title="RBBB with Superimposed Hyperkalemia", vignette="A 63-year-old man with end-stage renal disease missed his last two dialysis sessions. He presents with generalized weakness. ECG shows a QRS >120 ms and tall, tented T waves in V4-V5.",
       img="https://cdn.orris.care/cdss_images/pmc_clinical_VQA_2f6a1f563ae840f18ba1b7b51fff72d6c9d10a0feee8aaa4a57a1346927947ca.jpg",
       answer="Widened QRS with an RSR' pattern in V1 (RBBB), a prolonged PR interval (first-degree AV block), and prominent symmetrically peaked/tented T waves in the precordial leads — the T-wave morphology is the giveaway for superimposed hyperkalemia on top of underlying conduction disease. Check potassium immediately and begin emergent treatment (calcium gluconate, insulin/dextrose, dialysis) regardless of exactly how the conduction abnormality is labeled."),
  dict(n=13, title="Monomorphic Ventricular Tachycardia", vignette="A 70-year-old man with a prior myocardial infarction presents with palpitations and a systolic blood pressure of 88 mmHg. The monitor shows a wide-complex tachycardia.",
       img="https://cdn.orris.care/cdss_images/HARRISON_1763032032490_3345f53e-5d66-412b-9256-ab003e6a5163.png",
       answer="Wide-complex tachycardia with occasional narrower fusion beats and evidence of ventriculoatrial (AV) dissociation — both are strong evidence for ventricular tachycardia rather than SVT with aberrancy. Scar-related reentry from the prior infarct is the classic mechanism. Any hemodynamically unstable wide-complex tachycardia should be treated as VT until proven otherwise and managed with synchronized cardioversion."),
  dict(n=14, title="Wolff-Parkinson-White Syndrome", vignette="A 22-year-old woman with a history of intermittent palpitations since her teenage years has an ECG obtained while asymptomatic.",
       img="https://cdn.orris.care/cdss_images/pmc_clinical_VQA_57a457581081cf127e4bce2cf0dff4f373983b861931a30669136410edcd6327.jpg",
       answer="Short PR interval with a delta wave (slurred initial upstroke of the QRS) = ventricular pre-excitation, Wolff-Parkinson-White syndrome. Note the negative delta waves in the inferior leads mimicking pathologic Q waves — a classic \"pseudoinfarction\" pattern that should NOT be mistaken for a prior MI. Clinically important: avoid pure AV-nodal blocking agents (adenosine, verapamil, digoxin) if this patient develops atrial fibrillation, since blocking the AV node can promote dangerously rapid conduction down the accessory pathway."),
  dict(n=15, title="Anterior STEMI", vignette="A 58-year-old man presents with 45 minutes of crushing substernal chest pain, diaphoresis, and nausea.",
       img="https://cdn.orris.care/cdss_images/pmc_clinical_VQA_2629b84958e209f333114e728f1604802149baa08b1df26907d6ab724945de69.jpg",
       answer="ST-segment elevation across V1-V4 with \"tombstoning\" morphology in V2-V3, plus reciprocal ST depression in the inferior leads (III, aVF) — an anteroseptal/anterior STEMI, LAD territory. This is a cath-lab-now diagnosis; do not wait for troponin to activate the STEMI pathway."),
  dict(n=16, title="Inferior STEMI", vignette="A 66-year-old man presents with chest pain radiating to the jaw, associated nausea, and a heart rate of 52/min.",
       img="https://cdn.orris.care/cdss_images/pmc_clinical_VQA_45e6159ca694f684efa9f491a17643e5e9da0870694f2324257ff36fbd36f575.jpg",
       answer="ST elevation in II, III, and aVF with reciprocal ST depression in I and aVL — inferior STEMI, RCA (or LCx) territory. Get right-sided leads (V4R) to screen for right ventricular involvement, and be cautious with nitrates/preload-reducing agents if RV infarction is present, since these patients are preload-dependent."),
  dict(n=17, title="Acute Pericarditis", vignette="A 27-year-old man reports sharp, stabbing chest pain that worsens lying flat and improves sitting forward, one week after a viral respiratory illness.",
       img="https://cdn.orris.care/cdss_images/pmc_clinical_VQA_550a74c11c6ca88307bb3a5a9f8c75af6ec6940529fbcd4176676549c936f725.jpg",
       answer="Diffuse, concave ST-segment elevation (most prominent in the lateral precordial leads) with PR-segment depression in leads I and II, plus two specific pearls: Spodick's sign (downsloping T-P segment, best seen in V3) and the \"knuckle sign\" in aVR (PR elevation with reciprocal ST depression). ST elevation in lead II greater than lead III also helps distinguish this from an inferior STEMI. This diffuse, non-territorial pattern with PR depression is the signature of acute pericarditis."),
  dict(n=18, title="Severe Hyperkalemia", vignette="A 45-year-old man with end-stage renal disease has missed three consecutive dialysis sessions. He presents with generalized weakness and mild confusion.",
       img="https://cdn.orris.care/cdss_images/pmc_clinical_VQA_0e4bd03ffc3858d2de708753614934bc362a034d58a5c5794a71656f8a47c44b.jpg",
       answer="Tall, peaked (\"tented\") T waves across the inferior and precordial leads, a widened QRS, and flattening P waves — the classic progression of severe hyperkalemia. This is a check-the-potassium-now, treat-before-the-lab-calls-back situation: IV calcium gluconate to stabilize the myocardium, insulin/dextrose and albuterol to shift potassium intracellularly, and urgent dialysis for definitive removal."),
  dict(n=19, title="Acquired Long QT with Torsades de Pointes", vignette="A 50-year-old woman is recovering from surgery on ondansetron and methadone. She suddenly becomes dizzy and is witnessed to collapse; the monitor shows a wide, twisting rhythm.",
       img="https://cdn.orris.care/cdss_images/pmc_clinical_VQA_6c323e8f5453670c5e2be001a8d1ebf41666fb138b01d3d6dc2aaeb6c4f16329.jpg",
       answer="Baseline QTc was already borderline (440 ms) and prolonged further postoperatively to 505 ms on QT-prolonging medications. A short-long-short R-R sequence precedes the onset of a polymorphic ventricular tachycardia with the classic \"twisting of the points\" QRS morphology around the isoelectric line — Torsades de Pointes from acquired (drug-induced) long QT syndrome. Treatment: IV magnesium sulfate, stop all QT-prolonging drugs, correct potassium/magnesium, and consider overdrive pacing or isoproterenol if recurrent."),
  dict(n=20, title="Pulmonary Embolism (S1Q3T3)", vignette="A 34-year-old woman, two weeks postpartum, presents with sudden dyspnea and pleuritic chest pain. Heart rate is 110/min.",
       img="https://cdn.orris.care/cdss_images/pmc_clinical_VQA_6dd4991f5443865f9dd7fb3cc081ab3b6aa5b843df822ef2d2ff58ebe1659dd9.jpg",
       answer="Sinus tachycardia with the S1Q3T3 pattern: a deep S wave in lead I, a Q wave in lead III, and an inverted T wave in lead III — a classic (though nonspecific and not very sensitive) sign of acute right ventricular strain. In this clinical context (postpartum, acute dyspnea, pleuritic pain), this should raise strong suspicion for pulmonary embolism. Next step: risk-stratify (Wells/PERC), obtain CT pulmonary angiography, and consider empiric anticoagulation if clinical probability is high while awaiting confirmation."),
]

def download(url, path):
    if os.path.exists(path):
        return True
    try:
        req = urllib.request.Request(url, headers={'User-Agent': 'Mozilla/5.0'})
        with urllib.request.urlopen(req, timeout=30) as resp, open(path, 'wb') as f:
            f.write(resp.read())
        return True
    except Exception as e:
        print("FAILED", url, e)
        return False

for c in cases:
    ext = ".png" if c["img"].lower().endswith(".png") else ".jpg"
    path = os.path.join(IMGDIR, f"case{c['n']:02d}{ext}")
    ok = download(c["img"], path)
    c["local_path"] = path if ok else None

story = []

# Cover page
story.append(Spacer(1, 1.2*inch))
story.append(Paragraph("ECG PRACTICE WORKBOOK", title_style))
story.append(Spacer(1, 0.15*inch))
story.append(Paragraph("20 Emergency Department Cases — From Vignette to Interpretation", subtitle_style))
story.append(Spacer(1, 0.3*inch))
story.append(HRFlowable(width="60%", thickness=1, color=colors.HexColor('#0b3d5c'), hAlign='CENTER'))
story.append(Spacer(1, 0.3*inch))
story.append(Paragraph(
    "How to use this workbook: For each case, read the short clinical vignette, examine the ECG image, "
    "and work through the 10 systematic questions before checking the Answer Key at the end of the book. "
    "Cover the Answer Key section while you work through the cases if practicing independently.",
    ParagraphStyle('Cover', parent=styles['Normal'], fontSize=10.5, leading=15, alignment=1, spaceAfter=6)))
story.append(Spacer(1, 0.4*inch))
toc_data = [["#", "Case"]] + [[str(c["n"]), c["title"]] for c in cases]
toc_table = Table(toc_data, colWidths=[0.5*inch, 5.5*inch])
toc_table.setStyle(TableStyle([
    ('BACKGROUND', (0,0), (-1,0), colors.HexColor('#0b3d5c')),
    ('TEXTCOLOR', (0,0), (-1,0), colors.white),
    ('FONTSIZE', (0,0), (-1,-1), 9),
    ('GRID', (0,0), (-1,-1), 0.4, colors.grey),
    ('TOPPADDING', (0,0), (-1,-1), 3),
    ('BOTTOMPADDING', (0,0), (-1,-1), 3),
]))
story.append(toc_table)
story.append(PageBreak())

MAX_W = 6.6*inch
MAX_H = 3.6*inch

def make_image_flowable(path):
    if not path or not os.path.exists(path):
        return Paragraph("[Image unavailable]", small)
    try:
        with PILImage.open(path) as im:
            w, h = im.size
        ratio = min(MAX_W / w, MAX_H / h)
        return RLImage(path, width=w*ratio, height=h*ratio)
    except Exception:
        return Paragraph("[Image could not be loaded]", small)

# Case pages
for c in cases:
    block = []
    block.append(Paragraph(f"CASE {c['n']} — {c['title']}", case_header))
    block.append(Paragraph(c["vignette"], vignette_style))
    block.append(make_image_flowable(c["local_path"]))
    block.append(Spacer(1, 8))
    story.append(KeepTogether(block))
    story.append(Spacer(1, 6))
    for q in QUESTIONS:
        story.append(Paragraph(q + " " + "_"*55, q_style))
    story.append(Spacer(1, 4))
    story.append(Paragraph("Working diagnosis: " + "_"*60, q_style))
    story.append(PageBreak())

# Answer key
story.append(Paragraph("ANSWER KEY", title_style))
story.append(Spacer(1, 0.15*inch))
story.append(HRFlowable(width="100%", thickness=1, color=colors.HexColor('#0b3d5c')))
story.append(Spacer(1, 0.1*inch))
for c in cases:
    story.append(Paragraph(f"Case {c['n']} — {c['title']}", ans_header))
    story.append(Paragraph(c["answer"], ans_body))

story.append(Spacer(1, 10))
story.append(HRFlowable(width="100%", thickness=0.75, color=colors.HexColor('#999999')))
story.append(Paragraph(
    "Cases are built from real, de-identified/educational ECG figures sourced from peer-reviewed case reports and "
    "Harrison's Principles of Internal Medicine, used for educational pattern recognition. Always correlate ECG "
    "findings with the full clinical picture and institutional protocol before making management decisions.",
    small))

doc = SimpleDocTemplate(os.path.join(OUTDIR, "ECG_Practice_Workbook.pdf"), pagesize=letter,
                         topMargin=0.4*inch, bottomMargin=0.4*inch, leftMargin=0.5*inch, rightMargin=0.5*inch)
doc.build(story)
print("DONE")
cd /tmp/workspace/ecg-workbook && python3 build_workbook.py 2>&1 | tail -50
ls -la /tmp/workspace/ecg-workbook/images/ | head -25 && echo "---" && ls -la /tmp/workspace/ecg-workbook/*.pdf && python3 -c " from pypdf import PdfReader r = PdfReader('/tmp/workspace/ecg-workbook/ECG_Practice_Workbook.pdf') print('Pages:', len(r.pages)) "
ECG Practice Workbook
PDF Document · PDF
- Cover page with a table of contents listing all 20 cases
- 20 case pages, each with: a short clinical vignette, the actual ECG image, and the same 10-question systematic checklist (rate, rhythm, P wave, axis, PR, QRS, ST, T, QT, working diagnosis) with blank lines to write your answers
- Answer key at the end with the interpretation, key findings, and a management pearl for every case
- Cover the answer key pages while working through cases if you want a real test.
- A few cases (7, 12, 13) deliberately stack two findings on one tracing (e.g., RBBB + hyperkalemia) since real ED strips rarely hand you just one clean abnormality.
- Case 10 and 11 are reference/comparison figures meant to drill pattern recognition side-by-side rather than a single-patient vignette.
Search PubMed for latest ECG interpretation guidelines and acute coronary syndrome updates
"electrocardiography"[MeSH Terms] AND "guideline"[pt]
"acute coronary syndrome"[MeSH Terms] AND "guideline"[pt]
"ST elevation myocardial infarction"[MeSH Terms] AND "diagnosis"[Subheading]
2024 2025 ACC AHA ESC acute coronary syndrome guideline update ECG
PMID: 40013745
PMID: 38382857
PMID: 39913187
https://www.heartfoundation.org.au/for-professionals/acs-gui…
Latest ACS Guidelines & ECG Interpretation Updates
1. The headline update: 2025 ACC/AHA/ACEP/NAEMSP/SCAI ACS Guideline
- A 12-lead ECG should be obtained and interpreted within 10 minutes of first medical contact for any patient with suspected ACS - this is now an explicit, guideline-anchored time target rather than a general aspiration.
- New terminology: "Acute Coronary Occlusion Myocardial Infarction" (ACOMI). This retires the strict STEMI-vs-NSTEMI binary in favor of recognizing that a true occlusive MI can present without classic ST elevation. ACOMI explicitly folds in patterns you already learned as "STEMI equivalents" - De Winter's T waves, posterior MI, and right ventricular/high lateral infarction patterns - as findings that should trigger emergent reperfusion consideration just like classic STE.
- Reperfusion timing tightened: <60 minutes from first medical contact at PCI-capable centers; <90 minutes if transfer to a PCI-capable center is needed.
- Greater use of high-sensitivity troponin-based rapid rule-out/rule-in pathways alongside the ECG, and expanded use of intravascular imaging-guided PCI for NSTE-ACS.
- Loading dose of aspirin and a P2Y12 inhibitor for all ACS patients, with at least 12 months of DAPT unless bleeding risk is high.
2. The evidence gap behind that terminology shift: OMI-NOMI
- Classic ST-elevation criteria had a pooled sensitivity of only 43.6% for detecting an actual acute coronary occlusion (ACO) on angiography, meaning over half of true occlusions don't show textbook ST elevation. Specificity was high (96.5%).
- Applying the OMI-NOMI framework (Occlusion MI / Non-Occlusion MI - reading the ECG holistically for occlusion patterns rather than a rigid ≥1mm threshold) raised sensitivity to 78.1% while keeping specificity similar (94.4%).
- This is the evidence base that is pushing guidelines and EM/cardiology practice toward the ACOMI concept above - i.e., don't rely on millimeter criteria alone; look for hyperacute T waves, De Winter's pattern, subtle posterior changes, and overall gestalt of occlusion.
3. Operational evidence: does rapid ECG triage actually help?
- Structured rapid-ECG triage protocols significantly cut door-to-ECG time by 6.45 minutes and door-to-balloon time by 24.4 minutes (both p<0.001), with more centers hitting benchmark targets.
- However, improvements in length of stay and in-hospital mortality were not statistically significant - a reminder that faster ECG acquisition improves process metrics reliably, but the downstream mortality benefit is harder to prove and likely diluted by other factors in the care pathway.
4. European perspective (still current/actively referenced)
Bottom line for your ECG interpretation practice
- Don't stop at "no ST elevation = not urgent." Actively screen for De Winter's T waves, isolated posterior changes (ST depression V1-V3 with tall R), and subtle high-lateral/RV patterns - these are now explicitly named ACOMI equivalents.
- Treat the 10-minute-to-ECG and 60/90-minute-to-PCI clocks as hard benchmarks, not soft goals.
- Hyperacute T waves (which you already flagged as "earliest STEMI sign" in our checklist) are exactly the kind of pre-ST-elevation finding this literature is pushing clinicians to act on rather than wait out.
Create a De Winter's T wave & STEMI-equivalent patterns reference card
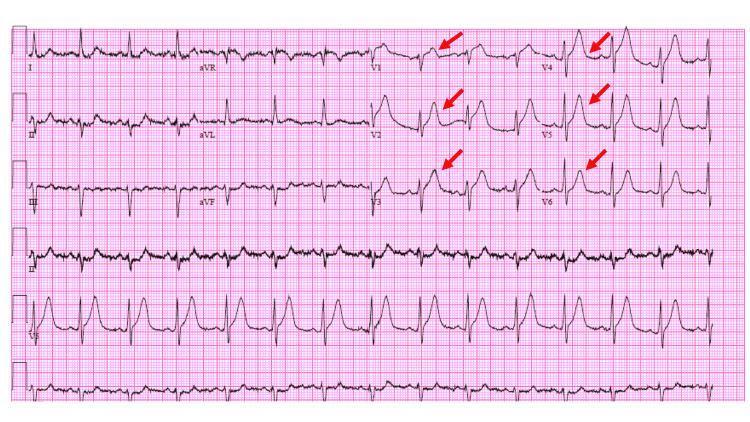
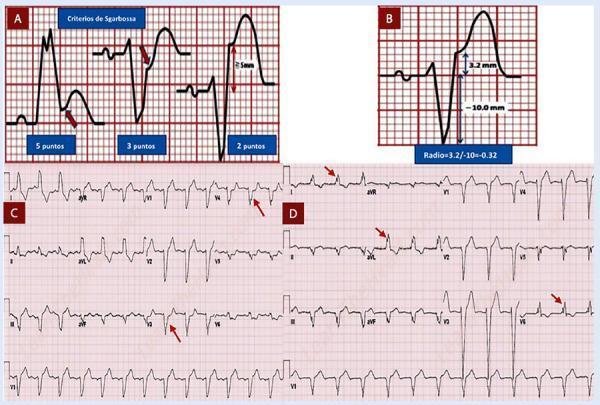
posterior myocardial infarction ECG ST depression V1-V3 tall R wave
aVR ST elevation diffuse ST depression left main coronary occlusion ECG
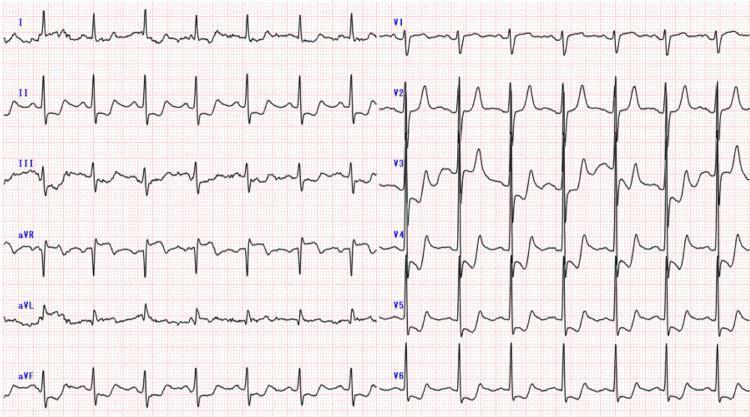
This diagnostic image is a 12-lead electrocardiogram (ECG) demonstrating signs of global subendocardial ischemia. The tracing shows a normal sinus rhythm with a heart rate of approximately 75 beats per minute. Significant visual findings include widespread horizontal or downsloping ST-segment depressions observed in the inferior leads (II, III, aVF), lateral leads (I, aVL), and the precordial leads (V2 through V6). Accompanying these findings is a prominent ST-segment elevation in lead aVR. This specific pattern—diffuse ST-segment depression with reciprocal ST elevation in lead aVR—is a critical clinical indicator often associated with left main coronary artery occlusion, triple-vessel disease, or severe global myocardial oxygen supply-demand mismatch, such as that seen in Stanford Type A aortic dissection involving the coronary ostia. The QRS complexes appear to have normal duration and morphology without evidence of pathological Q waves.
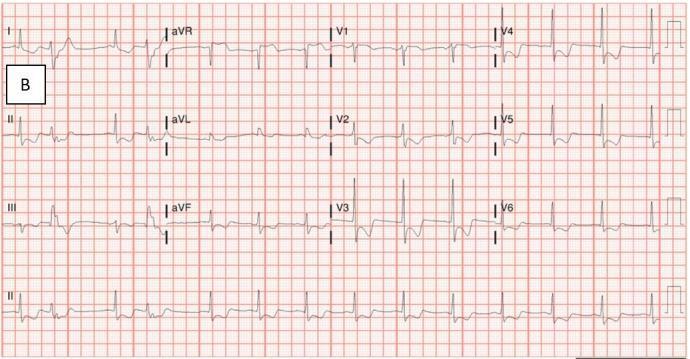
A standard 12-lead electrocardiogram (ECG) tracing on a red grid background, demonstrating significant electrophysiological abnormalities. The rhythm is sinus, but the tracing exhibits diffuse ST-segment depression prominently visible in the precordial leads (V2-V6) and limb leads (I, II, aVL), which is highly indicative of severe global subendocardial ischemia. Conversely, localized ST-segment elevation is noted in lead aVR (and to a lesser extent in aVF), a pattern often associated with left main coronary artery occlusion or multi-vessel disease. Temporal measurements show shortened PR intervals and noticeably prolonged QT intervals. This diagnostic image serves as a critical educational tool for identifying ischemic patterns, electrolyte imbalances, or acute coronary syndromes in cardiovascular medicine and emergency triage training.
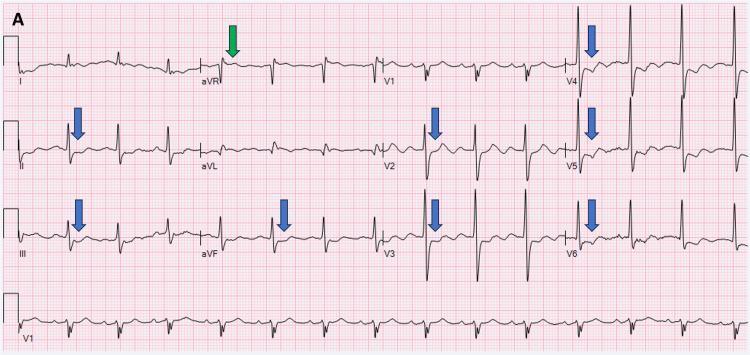
A 12-lead diagnostic electrocardiogram (ECG) demonstrating a critical pattern of diffuse myocardial ischemia. The tracing shows marked ST-segment elevation in lead aVR (indicated by a green arrow), which is a significant indicator of potential left main coronary artery (LMCA) occlusion or triple-vessel disease. This is accompanied by widespread, horizontal to down-sloping ST-segment depression (indicated by blue arrows) across multiple lead groups, specifically in the inferior leads (II, III, aVF) and the anterolateral leads (I, aVL, V2, V3, V4, V5, V6). Lead V1 remains relatively neutral compared to the other leads. The rhythm appears to be atrial fibrillation, characterized by an irregularly irregular rhythm and the absence of clear P-waves. This visual pattern is classically associated with severe subendocardial ischemia or global myocardial oxygen supply-demand mismatch, often seen in acute coronary syndrome. The image serves as a high-level educational resource for identifying high-risk ECG signatures that require urgent cardiovascular intervention.
Wellens syndrome biphasic T wave inversion V2 V3 anterior leads
This diagnostic image is a 12-lead electrocardiogram (ECG) printed on standard red-grid paper, demonstrating significant repolarization abnormalities. The tracing shows a normal sinus rhythm with specific T-wave morphology changes annotated by black arrows. Key findings include: deep, symmetric T-wave inversions in the lateral precordial leads (V4, V5, and V6); biphasic T-waves in leads V2 and V3; and T-wave flattening or subtle inversion in the limb leads (I, aVL, II, III, and aVF). These visual patterns, particularly the deep symmetric precordial T-wave inversions and biphasic morphologies in the absence of significant ST-segment elevation, are classic indicators of Wellens' syndrome or myocardial ischemia related to proximal left anterior descending (LAD) coronary artery stenosis. The ECG serves as a critical educational tool for identifying high-risk coronary syndromes and distinguishing ischemic T-wave changes from non-specific repolarization variants.
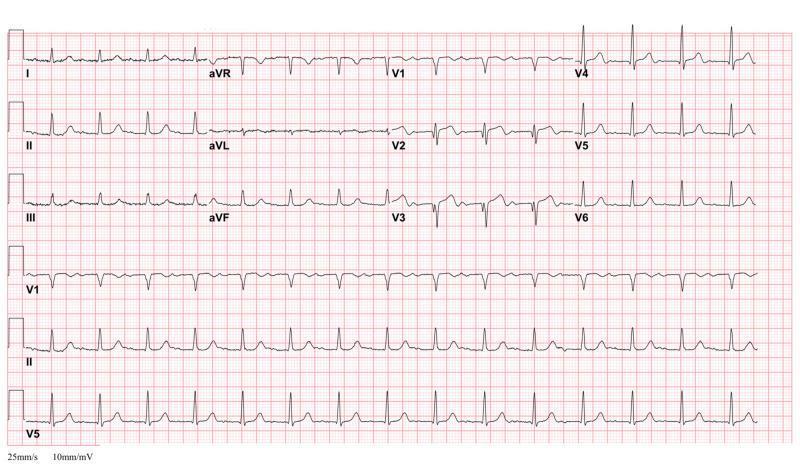
A 12-lead electrocardiogram (ECG) demonstrating the classic 'Type A' Wellens' Syndrome pattern. The recording shows a regular rhythm with normal QRS complexes; however, there is a pathognomonic T-wave morphology in the precordial leads, specifically V2 and V3. These leads exhibit biphasic T-waves characterized by an initial shallow positive deflection followed by a deep, terminal negative deflection. The terminal inversion is more prominent in amplitude than the initial upward phase. Such findings in the context of clinical stability are highly specific for critical stenosis of the proximal left anterior descending (LAD) coronary artery. The ECG also includes standard limb leads (I, II, III), augmented limb leads (aVR, aVL, aVF), and the full precordial series (V1-V6), with rhythm strips for V1, II, and V5 at the bottom. The paper speed is noted at 25mm/s with a sensitivity of 10mm/mV, providing a standard diagnostic reference for ischemic heart disease and acute coronary syndrome (ACS) evaluation.
right ventricular infarction ECG V4R ST elevation inferior MI
~/ecg-stemi-equivalents/build_card.py
import os, urllib.request
from reportlab.lib.pagesizes import letter
from reportlab.lib.units import inch
from reportlab.lib import colors
from reportlab.platypus import (SimpleDocTemplate, Paragraph, Spacer, Table, TableStyle,
Image as RLImage, PageBreak, HRFlowable, KeepTogether)
from reportlab.lib.styles import getSampleStyleSheet, ParagraphStyle
from PIL import Image as PILImage
OUTDIR = "/tmp/workspace/ecg-stemi-equivalents"
IMGDIR = os.path.join(OUTDIR, "images")
os.makedirs(IMGDIR, exist_ok=True)
NAVY = colors.HexColor('#0b3d5c')
LIGHT = colors.HexColor('#e8eef2')
RED = colors.HexColor('#a8281c')
GREY = colors.HexColor('#555555')
styles = getSampleStyleSheet()
title_style = ParagraphStyle('TitleX', parent=styles['Title'], fontSize=19, textColor=NAVY, spaceAfter=2)
subtitle_style = ParagraphStyle('SubtitleX', parent=styles['Normal'], fontSize=10.5, alignment=1, textColor=GREY)
pattern_header = ParagraphStyle('PatternHeader', parent=styles['Heading1'], fontSize=13.5, textColor=colors.white,
backColor=NAVY, leftIndent=6, borderPadding=(6,6,6,6), spaceAfter=6)
tag_style = ParagraphStyle('Tag', parent=styles['Normal'], fontSize=8.7, textColor=colors.white,
backColor=RED, borderPadding=(3,5,3,5), alignment=1)
body = ParagraphStyle('Body', parent=styles['Normal'], fontSize=9, leading=12.5, spaceAfter=3)
label = ParagraphStyle('Label', parent=styles['Normal'], fontSize=9, leading=12.5, textColor=NAVY, fontName='Helvetica-Bold')
small = ParagraphStyle('Small', parent=styles['Normal'], fontSize=7.6, leading=9.5, textColor=GREY)
caption = ParagraphStyle('Caption', parent=styles['Normal'], fontSize=7.3, leading=9, textColor=GREY, alignment=1, spaceAfter=4)
def dl(url, path):
if os.path.exists(path):
return True
try:
req = urllib.request.Request(url, headers={'User-Agent': 'Mozilla/5.0'})
with urllib.request.urlopen(req, timeout=30) as r, open(path, 'wb') as f:
f.write(r.read())
return True
except Exception as e:
print("FAIL", url, e)
return False
MAX_W = 4.6*inch
MAX_H = 2.5*inch
def img_flowable(path):
if not path or not os.path.exists(path):
return None
try:
with PILImage.open(path) as im:
w, h = im.size
ratio = min(MAX_W/w, MAX_H/h)
return RLImage(path, width=w*ratio, height=h*ratio)
except Exception:
return None
patterns = [
dict(n=1, name="Hyperacute T Waves", tag="EARLIEST SIGN",
img=None,
criteria=[
"Tall, broad-based, slightly peaked T waves, often with a wider T-wave base than a normal T wave.",
"Precedes ST elevation — may be the only finding in the first minutes of occlusion.",
"Best appreciated by comparing successive ECGs or against the patient's own baseline.",
],
pearl="If a T wave looks \"too fat\" for the QRS in front of it, treat it as ischemia until proven otherwise and repeat the ECG in 10-15 minutes.",
source="ROSEN's Emergency Medicine"),
dict(n=2, name="De Winter T-Wave Pattern", tag="PROXIMAL LAD OCCLUSION",
img="https://cdn.orris.care/cdss_images/pmc_clinical_VQA_2f76d16a0a59d370eb9565be557553e444c722b50f05ed4721d6147991d92d90.jpg",
criteria=[
"Upsloping ST-segment depression at the J-point in the precordial leads (V1-V6) that transitions into tall, prominent, symmetric T waves.",
"Little or no ST elevation — the classic STEMI criterion is absent by definition.",
"Often minimal (<0.5 mm) ST elevation in aVR; limb leads relatively unremarkable.",
],
pearl="This IS an occlusive anterior MI wearing a disguise. Do not let the absence of ST elevation delay cath lab activation — treat as STEMI-equivalent.",
source="J Electrocardiol 2016;49:76-80; ROSEN's Emergency Medicine"),
dict(n=3, name="Wellens Syndrome", tag="CRITICAL LAD STENOSIS",
img="https://cdn.orris.care/cdss_images/pmc_clinical_VQA_68fa91a20a6b982ea90ce41507c77d525a91d2700f326a74b650d75b4c0a76d7.jpg",
criteria=[
"Type A (~25%): biphasic T waves in V2-V3 (initial positive deflection, deeper terminal negative deflection).",
"Type B (~75%): deep, symmetric T-wave inversion in V2-V3 (can extend to V1-V4).",
"No pathologic Q waves, minimal/no ST elevation, preserved R waves — recorded during a pain-free interval after resolved chest pain.",
],
pearl="These patients look deceptively well because the pain has resolved. This is a warning sign of an unstable, critically narrowed proximal LAD about to re-occlude. Do NOT stress test — refer for early invasive management.",
source="Tintinalli's Emergency Medicine; Washington Manual"),
dict(n=4, name="Isolated True Posterior MI", tag="MIRROR-IMAGE STEMI",
img="https://cdn.orris.care/cdss_images/2ba6bbfc0f586e50246ab8131f1de0cbf91609fbe5fd84382b4f99695730bc57.png",
criteria=[
"Horizontal ST-segment depression with an upright T wave in V1-V3 (the standard 12-lead view captures the mirror image of injury, not the injury itself).",
"Tall, broad R wave in V1-V2 (R wave duration ≥0.04s, R/S ratio ≥1) with a positive T wave — the mirror image of a pathologic Q wave and ST elevation.",
"Confirm with posterior leads V7-V9: ST elevation ≥0.5 mm there clinches the diagnosis.",
],
pearl="Usually a circumflex (or distal RCA) occlusion. Any \"anterior ST depression\" in a patient with true ischemic chest pain deserves posterior leads before being called NSTEMI.",
source="ROSEN's Emergency Medicine; Goldman-Cecil Medicine; Washington Manual"),
dict(n=5, name="aVR ST Elevation with Diffuse ST Depression", tag="LEFT MAIN / TRIPLE-VESSEL",
img="https://cdn.orris.care/cdss_images/pmc_clinical_VQA_3758bc9403a247467205a3c32199d6a0dab260324565045777ed46a7c9f96975.jpg",
criteria=[
"ST-segment elevation in lead aVR, often >0.5 mm, sometimes exceeding the elevation seen in V1.",
"Widespread horizontal/downsloping ST depression across inferior, lateral, and precordial leads (a picture of global subendocardial ischemia).",
"May be accompanied by shock, pulmonary edema, or new bundle branch block — reflects a large ischemic burden.",
],
pearl="This is a high-risk pattern for left main coronary occlusion or severe triple-vessel disease. Treat as an emergency requiring urgent catheterization even though no single lead meets standard STEMI millimeter criteria.",
source="ROSEN's Emergency Medicine; Washington Manual; Harrison's Principles of Internal Medicine"),
dict(n=6, name="Right Ventricular Infarction", tag="CHECK V4R", img=None,
criteria=[
"Suspect in any inferior STEMI (ST elevation II, III, aVF), especially with hypotension or a poor response to nitrates.",
"Confirm with right-sided leads: ST elevation ≥1 mm in V4R is the single most sensitive/specific finding for RV infarction.",
"ST elevation in V1 out of proportion to V2-V3 on the standard 12-lead can be an additional clue.",
],
pearl="These patients are preload-dependent. Avoid nitrates, morphine, and other preload-reducing agents — they can precipitate profound hypotension. Treat with IV fluids first.",
source="Tintinalli's Emergency Medicine; ROSEN's Emergency Medicine"),
dict(n=7, name="Sgarbossa / Modified Sgarbossa Criteria", tag="STEMI BEHIND LBBB OR PACED RHYTHM",
img="https://cdn.orris.care/cdss_images/pmc_clinical_VQA_327576dce927fd64f9aa72d5c765668cbf4cac55ba94831a9e09ef7cd84d7afa.jpg",
criteria=[
"Concordant ST elevation ≥1 mm in any lead with a positive QRS (i.e., ST deviation in the same direction as the QRS) — 5 points, most specific finding.",
"Concordant ST depression ≥1 mm in V1-V3 — 3 points.",
"Discordant (opposite-direction) ST elevation ≥5 mm in a lead with a negative QRS — 2 points (original criteria); the Modified/Smith version instead uses an ST/S ratio ≤ -0.25 (excessive discordance), which is more sensitive.",
],
pearl="LBBB (and ventricular paced rhythm) normally produces its own discordant ST-T changes — don't mistake normal discordance for ischemia. Use the modified ST/S-ratio criterion; it catches more true occlusions than the original fixed 5 mm threshold.",
source="ROSEN's Emergency Medicine; Washington Manual; Am Heart J 2015;170:1255-1264"),
dict(n=8, name="South African Flag Sign", tag="DE WINTER VARIANT", img=None,
criteria=[
"A variant of the de Winter pattern with the addition of ST elevation in aVL and lead I, plus reciprocal ST depression in lead III.",
"Suggests occlusion at or proximal to the first septal perforator branch of the LAD, threatening a larger territory (septum + anterior + high lateral wall).",
"Named for the resemblance of the combined ST vectors to the South African flag when plotted on a limb-lead diagram.",
],
pearl="Recognize it as a de Winter pattern with extra high-lateral involvement — the more leads showing this ischemic signature, the larger the myocardium at risk. Treat with the same urgency as de Winter's pattern alone.",
source="ROSEN's Emergency Medicine; J Electrocardiol"),
]
for p in patterns:
if p["img"]:
ext = ".png" if p["img"].lower().endswith(".png") else ".jpg"
path = os.path.join(IMGDIR, f"pat{p['n']:02d}{ext}")
ok = dl(p["img"], path)
p["local"] = path if ok else None
else:
p["local"] = None
story = []
story.append(Spacer(1, 0.35*inch))
story.append(Paragraph("STEMI-EQUIVALENT PATTERNS", title_style))
story.append(Paragraph("De Winter's T Waves & Other Occlusion Patterns That Don't Meet Classic ST-Elevation Criteria", subtitle_style))
story.append(Spacer(1, 0.12*inch))
story.append(HRFlowable(width="100%", thickness=1.2, color=NAVY))
story.append(Spacer(1, 0.1*inch))
story.append(Paragraph(
"Roughly half of true acute coronary occlusions do NOT meet the classic millimeter-based ST-elevation "
"criteria on a standard 12-lead ECG. The 2025 ACC/AHA/ACEP/NAEMSP/SCAI ACS Guideline formalizes this gap "
"with the term <b>Acute Coronary Occlusion MI (ACOMI)</b> — recognizing that patterns like the ones on this "
"card represent real, urgent coronary occlusions and should trigger emergent reperfusion pathways just like "
"classic STEMI, even without meeting standard voltage criteria.",
ParagraphStyle('Intro', parent=body, fontSize=9.3, leading=13, backColor=LIGHT, borderPadding=(8,8,8,8))))
story.append(Spacer(1, 0.15*inch))
idx_data = [["#", "Pattern", "Key Clue"]]
for p in patterns:
idx_data.append([str(p["n"]), p["name"], p["tag"]])
idx_table = Table(idx_data, colWidths=[0.35*inch, 3.05*inch, 2.6*inch])
idx_table.setStyle(TableStyle([
('BACKGROUND', (0,0), (-1,0), NAVY),
('TEXTCOLOR', (0,0), (-1,0), colors.white),
('FONTSIZE', (0,0), (-1,-1), 8.6),
('GRID', (0,0), (-1,-1), 0.4, colors.grey),
('ROWBACKGROUNDS', (0,1), (-1,-1), [colors.white, LIGHT]),
('TOPPADDING', (0,0), (-1,-1), 3.5),
('BOTTOMPADDING', (0,0), (-1,-1), 3.5),
]))
story.append(idx_table)
story.append(PageBreak())
for p in patterns:
block = []
header_tbl = Table([[Paragraph(f"{p['n']}. {p['name']}", ParagraphStyle('H', parent=styles['Heading1'], fontSize=13.5, textColor=colors.white)),
Paragraph(p["tag"], tag_style)]],
colWidths=[4.5*inch, 2.0*inch])
header_tbl.setStyle(TableStyle([
('BACKGROUND', (0,0), (-1,-1), NAVY),
('VALIGN', (0,0), (-1,-1), 'MIDDLE'),
('LEFTPADDING', (0,0), (0,0), 8),
('TOPPADDING', (0,0), (-1,-1), 6),
('BOTTOMPADDING', (0,0), (-1,-1), 6),
]))
block.append(header_tbl)
block.append(Spacer(1, 8))
img_fl = img_flowable(p["local"])
if img_fl:
img_and_text = Table([[img_fl, Paragraph("<br/>".join(f"• {c}" for c in p["criteria"]), body)]],
colWidths=[2.9*inch, 3.6*inch])
img_and_text.setStyle(TableStyle([('VALIGN', (0,0), (-1,-1), 'TOP')]))
block.append(img_and_text)
else:
for c in p["criteria"]:
block.append(Paragraph(f"• {c}", body))
block.append(Spacer(1, 6))
pearl_tbl = Table([[Paragraph("<b>CLINICAL PEARL:</b> " + p["pearl"], ParagraphStyle('Pearl', parent=body, textColor=colors.HexColor('#7a2000')))]],
colWidths=[6.5*inch])
pearl_tbl.setStyle(TableStyle([
('BACKGROUND', (0,0), (-1,-1), colors.HexColor('#fdf0e6')),
('BOX', (0,0), (-1,-1), 0.6, colors.HexColor('#d98a4f')),
('TOPPADDING', (0,0), (-1,-1), 6),
('BOTTOMPADDING', (0,0), (-1,-1), 6),
('LEFTPADDING', (0,0), (-1,-1), 8),
('RIGHTPADDING', (0,0), (-1,-1), 8),
]))
block.append(pearl_tbl)
block.append(Spacer(1, 4))
block.append(Paragraph(f"Source: {p['source']}", small))
story.append(KeepTogether(block))
story.append(Spacer(1, 14))
story.append(HRFlowable(width="100%", thickness=0.5, color=colors.HexColor('#cccccc')))
story.append(Spacer(1, 14))
story.append(PageBreak())
story.append(Paragraph("QUICK RECALL", ParagraphStyle('QR', parent=title_style, fontSize=15)))
story.append(Spacer(1, 6))
story.append(Paragraph(
"\"No ST elevation\" does not mean \"no occlusion.\" Before calling a tracing NSTEMI or non-ischemic, "
"run through this list:", body))
story.append(Spacer(1, 4))
checklist_items = [
"Are the precordial T waves unusually tall/broad for the QRS (hyperacute)?",
"Is there upsloping ST depression feeding into tall symmetric T waves in V1-V6 (de Winter)?",
"Is there deep symmetric or biphasic T-wave inversion in V2-V3 in a now pain-free patient (Wellens)?",
"Is there ST depression in V1-V3 with a tall R wave and upright T (posterior MI - get V7-V9)?",
"Is aVR ST-elevated with diffuse ST depression elsewhere (left main/triple-vessel)?",
"Is there an inferior STEMI - did you check V4R for RV involvement?",
"Is there a LBBB or paced rhythm - did you apply (modified) Sgarbossa criteria?",
"Is there ST elevation in aVL/I with reciprocal III on top of a de Winter pattern (South African flag)?",
]
for it in checklist_items:
story.append(Paragraph("☐ " + it, body))
story.append(Spacer(1, 12))
story.append(HRFlowable(width="100%", thickness=0.75, color=colors.HexColor('#999999')))
story.append(Paragraph(
"Companion to the ECG Interpretation Checklist and ECG Practice Workbook. Sources: ROSEN's Emergency Medicine "
"Concepts and Clinical Practice; Tintinalli's Emergency Medicine; The Washington Manual of Medical Therapeutics; "
"Goldman-Cecil Medicine; Harrison's Principles of Internal Medicine; 2025 ACC/AHA/ACEP/NAEMSP/SCAI ACS Guideline "
"(JACC 2025); de Winter et al., J Electrocardiol 2016;49:76-80. For education only; correlate with full clinical "
"picture and institutional STEMI/ACOMI activation protocol.",
small))
doc = SimpleDocTemplate(os.path.join(OUTDIR, "STEMI_Equivalents_Reference_Card.pdf"), pagesize=letter,
topMargin=0.4*inch, bottomMargin=0.4*inch, leftMargin=0.5*inch, rightMargin=0.5*inch)
doc.build(story)
print("DONE")
cd /tmp/workspace/ecg-stemi-equivalents && python3 build_card.py 2>&1 | tail -50
ls -la /tmp/workspace/ecg-stemi-equivalents/images/ && echo "---" && ls -la /tmp/workspace/ecg-stemi-equivalents/*.pdf && python3 -c " from pypdf import PdfReader r = PdfReader('/tmp/workspace/ecg-stemi-equivalents/STEMI_Equivalents_Reference_Card.pdf') print('Pages:', len(r.pages)) "
STEMI Equivalents Reference Card
PDF Document · PDF
-
Intro banner explaining why this card exists — roughly half of true coronary occlusions don't meet classic ST-elevation criteria, and the 2025 ACC/AHA/ACEP/NAEMSP/SCAI guideline now formalizes this as "Acute Coronary Occlusion MI" (ACOMI).
-
Index table of all 8 patterns for quick navigation.
-
8 detailed pattern pages, each with: real ECG image (where available), the specific diagnostic criteria, an orange "Clinical Pearl" callout box with the action point, and a textbook source line:
- Hyperacute T waves — earliest sign, precedes ST elevation entirely
- De Winter's T-wave pattern — upsloping J-point depression into tall symmetric T waves, proximal LAD occlusion
- Wellens syndrome (Type A biphasic / Type B deep symmetric inversion) — critical LAD stenosis, don't stress test
- Isolated true posterior MI — mirror-image ST depression V1-V3 + tall R, confirm with V7-V9
- aVR ST elevation with diffuse ST depression — left main / triple-vessel disease
- Right ventricular infarction — check V4R on every inferior STEMI, avoid nitrates
- Sgarbossa / Modified Sgarbossa criteria — for STEMI hidden behind LBBB or a paced rhythm
- South African flag sign — de Winter variant with added aVL/I elevation, larger territory at risk
-
Quick Recall checklist page at the end — an 8-item screening list to run through before ever calling a tracing "just NSTEMI" or non-ischemic.
Search PubMed for latest troponin/biomarker-guided ACS risk stratification protocols
"high-sensitivity troponin"[MeSH Terms] AND "algorithm"[tiab] AND "myocardial infarction"[MeSH Terms]
"chest pain"[MeSH Terms] AND "risk assessment"[MeSH Terms] AND troponin
"HEART score" AND "acute coronary syndrome"
2025 ACC AHA ACS guideline high-sensitivity troponin 0/1 hour algorithm risk stratification pathway
PMID: 40154972
PMID: 39151818
PMID: 39313342
https://pmc.ncbi.nlm.nih.gov/articles/PMC12907536
Latest PubMed Evidence: Troponin/Biomarker-Guided ACS Risk Stratification
1. The current framework: hs-cTn-based Clinical Decision Pathways (CDPs)
- ECG first: if the tracing shows an ACOMI pattern (STEMI or STEMI-equivalent - see our reference card), skip the biomarker pathway entirely and go straight to reperfusion. Troponin-based CDPs are only for patients without immediately obvious occlusion on ECG.
- Two accepted serial-sampling strategies:
- 0/1-hour strategy: troponin at presentation and again at 1 hour. Achieves triage in ~75% of patients (60% ruled out, 15% ruled in) within an hour.
- 0/2-hour strategy: same concept, different cutoffs, sample at 2 hours instead of 1. In practice this is now described as "the most pragmatic option in most settings" because most hospital labs can't turn around a troponin fast enough to make the 0/1h strategy actually deliver a result within an hour.
- The UK High-STEACS algorithm is offered as an accepted alternative to either of these.
- Patients are sorted into low / intermediate / high risk buckets:
- Low risk: no further AMI workup needed - this is the main efficiency gain of hs-cTn pathways versus older contemporary-assay protocols.
- Intermediate risk: needs further evaluation (inpatient or outpatient depending on the troponin trajectory).
- High risk: admit for further evaluation/early invasive strategy.
- Critical caveat carried through the literature: cutoffs are assay-specific and sex-specific (separate 99th-percentile thresholds for men and women) - serial troponins are only interpretable if drawn on the same assay, which matters if a patient is transferred between institutions using different platforms.
2. Real-world implementation is still catching up to the guideline
3. Clinical scoring systems: HEART score remains central, and it's being simplified further
- A single initial hs-TnT measurement combined with the recalibrated HEART score (history, ECG, age, risk factors, troponin) achieved 94.4% sensitivity and 99.3% NPV for 30-day MACE, and 90.0% sensitivity / 99.3% NPV for AMI specifically.
- Excluding patients presenting within 3 hours of symptom onset (too early for a single troponin to be reliable) improved sensitivity to 97.0% (MACE) and 94.1% (AMI).
- Performance was similar for men and women using either a single fixed threshold (19 ng/L) or sex-specific thresholds (14 ng/L women, 22 ng/L men).
- Practical implication: for select patients presenting >3 hours after symptom onset, a single hs-TnT plus HEART score may be enough to rule out ACS - avoiding the need for serial draws altogether in the right population.
4. Where these tools don't work well yet: primary care
- Clinical decision rules without troponin, and strategies using conventional (non-high-sensitivity) troponin, had insufficient sensitivity to rule out ACS in primary care and are "not recommended as standalone tools" - notably, none of the CDRs outperformed unaided GP judgment.
- hs-cTn-based strategies were more promising (sensitivity 83.3-100%, NPV 98.8-100%) but the evidence base is still limited outside hospital/ED settings, and the review explicitly calls for further prospective validation before primary-care implementation.
- Takeaway: the hs-cTn CDP revolution is currently an ED phenomenon. It hasn't been proven to translate safely into a GP office or urgent care setting yet.
5. Overview reference tying it together
6. Emerging biomarker: copeptin (not yet mainstream)
Bottom line for your practice
- A single early troponin (<3h from symptom onset) is not reliable for rule-out even with rHEART - repeat it.
- hs-cTn elevation is not specific to ACS - always correlate with the clinical picture.
- These pathways are validated for the ED; don't assume the same NPV applies in primary care or urgent care.
Create a troponin/HEART-score decision pathway card, also tell me what is the cutoff of this troponin levels
ESC 0/1h hs-cTn algorithm cutoff values ng/L Elecsys hs-TnT Architect hs-TnI rule-out rule-in table
ESC 0/2h hs-cTn algorithm cutoff table rule-out rule-in ng/L Elecsys Architect
~/troponin-heart-card/build_card.py
import os
from reportlab.lib.pagesizes import letter
from reportlab.lib.units import inch
from reportlab.lib import colors
from reportlab.platypus import (SimpleDocTemplate, Paragraph, Spacer, Table, TableStyle,
PageBreak, HRFlowable, KeepTogether)
from reportlab.lib.styles import getSampleStyleSheet, ParagraphStyle
OUTDIR = "/tmp/workspace/troponin-heart-card"
os.makedirs(OUTDIR, exist_ok=True)
NAVY = colors.HexColor('#0b3d5c')
LIGHT = colors.HexColor('#e8eef2')
RED = colors.HexColor('#a8281c')
GREY = colors.HexColor('#555555')
ORANGE_BG = colors.HexColor('#fdf0e6')
ORANGE_BORDER = colors.HexColor('#d98a4f')
ORANGE_TXT = colors.HexColor('#7a2000')
GREEN = colors.HexColor('#1c6b3a')
GREEN_BG = colors.HexColor('#e9f5ee')
AMBER_BG = colors.HexColor('#fff6e0')
AMBER_TXT = colors.HexColor('#8a6300')
styles = getSampleStyleSheet()
title_style = ParagraphStyle('TitleX', parent=styles['Title'], fontSize=19, textColor=NAVY, spaceAfter=2)
subtitle_style = ParagraphStyle('SubtitleX', parent=styles['Normal'], fontSize=10.5, alignment=1, textColor=GREY)
section_header = ParagraphStyle('SectionHeader', parent=styles['Heading1'], fontSize=13, textColor=colors.white,
backColor=NAVY, leftIndent=6, borderPadding=(6,6,6,6), spaceAfter=6)
body = ParagraphStyle('Body', parent=styles['Normal'], fontSize=9, leading=12.5, spaceAfter=3)
small = ParagraphStyle('Small', parent=styles['Normal'], fontSize=7.5, leading=9.3, textColor=GREY)
cell = ParagraphStyle('Cell', parent=styles['Normal'], fontSize=8, leading=10)
cell_hdr = ParagraphStyle('CellHdr', parent=styles['Normal'], fontSize=8, leading=10, textColor=colors.white, fontName='Helvetica-Bold')
def pearl_box(text, bg=ORANGE_BG, border=ORANGE_BORDER, txtcolor=ORANGE_TXT, label="CLINICAL PEARL"):
t = Table([[Paragraph(f"<b>{label}:</b> " + text, ParagraphStyle('P', parent=body, textColor=txtcolor))]], colWidths=[6.5*inch])
t.setStyle(TableStyle([
('BACKGROUND', (0,0), (-1,-1), bg),
('BOX', (0,0), (-1,-1), 0.6, border),
('TOPPADDING', (0,0), (-1,-1), 6), ('BOTTOMPADDING', (0,0), (-1,-1), 6),
('LEFTPADDING', (0,0), (-1,-1), 8), ('RIGHTPADDING', (0,0), (-1,-1), 8),
]))
return t
story = []
# ---------- COVER ----------
story.append(Spacer(1, 0.3*inch))
story.append(Paragraph("TROPONIN & HEART SCORE", title_style))
story.append(Paragraph("Biomarker-Guided ACS Risk Stratification Decision Pathway", subtitle_style))
story.append(Spacer(1, 0.1*inch))
story.append(HRFlowable(width="100%", thickness=1.2, color=NAVY))
story.append(Spacer(1, 0.1*inch))
story.append(Paragraph(
"This card assumes the ECG has already been checked for STEMI/ACOMI patterns (see companion STEMI-Equivalents "
"card). It applies to hemodynamically stable patients with chest pain <b>without</b> diagnostic ST elevation on "
"the initial ECG.",
ParagraphStyle('Intro', parent=body, fontSize=9.3, leading=13, backColor=LIGHT, borderPadding=(8,8,8,8))))
story.append(Spacer(1, 0.15*inch))
story.append(Paragraph("STEP 0 — The 99th Percentile Concept", section_header))
story.append(Paragraph(
"The universal definition of myocardial infarction requires a cardiac troponin value above the "
"<b>99th percentile upper reference limit (URL)</b> of a healthy reference population, PLUS a rise and/or "
"fall pattern on serial testing in a clinical setting consistent with ischemia. A single elevated value without "
"a dynamic change is called <b>myocardial injury</b>, not infarction — the two are not the same thing.", body))
story.append(Paragraph("• The 99th-percentile threshold is <b>assay-specific and often sex-specific</b> — there is no single universal \"troponin cutoff.\" Every hs-cTn assay (Elecsys, Architect, Centaur, Access, Clarity, etc.) has its own validated number.", body))
story.append(Paragraph("• Serial troponins are only interpretable if drawn on the <b>same assay/platform</b> — do not mix values from different hospitals or analyzers.", body))
story.append(Paragraph("• Elevated troponin ≠ ACS. Myocarditis, PE, sepsis, heart failure, renal failure, tachyarrhythmia, and strenuous exercise can all elevate troponin without coronary occlusion.", body))
story.append(Spacer(1, 6))
story.append(pearl_box(
"\"Positive troponin\" is not a diagnosis. Ask: is there a genuine rise/fall pattern, and does the clinical "
"picture fit ischemia? If not, look for a non-ACS cause of myocardial injury before anchoring on ACS.",
label="PEARL"))
story.append(PageBreak())
# ---------- 0/1h ALGORITHM ----------
story.append(Paragraph("STEP 1 — ESC 0/1-Hour hs-cTn Algorithm", section_header))
story.append(Paragraph(
"Draw hs-cTn at presentation (0h) and again at 1 hour. Triages ~75% of patients within an hour "
"(~60% rule-out, ~15% rule-in); the remainder fall into an \"observe\" zone needing further testing. "
"<b>Cutoffs are assay-specific</b> — use your lab's validated table, not a memorized single number.", body))
story.append(Spacer(1, 6))
data01 = [
[Paragraph(x, cell_hdr) for x in ["Assay (Manufacturer)", "Rule-OUT\n0h (ng/L)", "Rule-OUT\n0h + Δ1h (ng/L)", "Rule-IN\n0h (ng/L)", "Rule-IN\nΔ1h (ng/L)"]],
["hs-cTnT (Elecsys, Roche)", "<5", "<12 / Δ<3", "≥52", "≥5"],
["hs-cTnI (Architect, Abbott)", "<4", "<5 / Δ<2", "≥64", "≥6"],
["hs-cTnI (Centaur, Siemens)", "<3", "<6 / Δ<3", "≥120", "≥12"],
["hs-cTnI (Access, Beckman Coulter)", "<4", "<5 / Δ<4", "≥50", "≥15"],
["hs-cTnI (Clarity, Singulex)", "<1", "<2 / Δ<1", "≥30", "≥6"],
]
t01 = Table(data01, colWidths=[1.9*inch, 1.0*inch, 1.5*inch, 1.0*inch, 1.0*inch])
t01.setStyle(TableStyle([
('BACKGROUND', (0,0), (-1,0), NAVY),
('GRID', (0,0), (-1,-1), 0.4, colors.grey),
('FONTSIZE', (0,1), (-1,-1), 8),
('ROWBACKGROUNDS', (0,1), (-1,-1), [colors.white, LIGHT]),
('VALIGN', (0,0), (-1,-1), 'MIDDLE'),
('TOPPADDING', (0,0), (-1,-1), 4), ('BOTTOMPADDING', (0,0), (-1,-1), 4),
]))
story.append(t01)
story.append(Spacer(1, 4))
story.append(Paragraph(
"\"0h rule-out\" applies only if symptom onset was >3 hours before the sample. \"0h + Δ1h rule-out\" combines a slightly higher baseline value with a small 1-hour change (Δ) and can be used even if onset was ≤3 hours. Rule-in requires either a high single value OR a large 1-hour rise.",
small))
story.append(Spacer(1, 8))
story.append(pearl_box(
"Patients ruled out by the 0/1h algorithm have reported 30-day MACE and all-cause death rates <0.5%, "
"with 5-year mortality similar to the age-matched general population — this pathway is safe for early discharge, not just a triage shortcut.",
label="EVIDENCE"))
story.append(PageBreak())
# ---------- 0/2h ALGORITHM ----------
story.append(Paragraph("STEP 1 (Alternative) — 0/2-Hour Algorithm", section_header))
story.append(Paragraph(
"The 0/2h strategy uses the same rule-out / observe / rule-in logic but draws the second sample at 2 hours "
"instead of 1. Guideline-endorsed (ESC Class IB) and often more practical than 0/1h, since most core "
"laboratories cannot turn around a troponin result fast enough to make a true 1-hour decision. The UK "
"<b>High-STEACS algorithm</b> is an accepted alternative to either ESC pathway.", body))
story.append(Spacer(1, 6))
example02 = Table([
[Paragraph(x, cell_hdr) for x in ["Example (hs-cTnT, Elecsys)", "Value"]],
["Rule-out: 0h (if onset >3h)", "<8 ng/L"],
["Rule-out: 0h AND Δ2h", "<18 ng/L AND <4 ng/L"],
["Rule-in: 0h", "≥112 ng/L"],
["Rule-in: Δ2h", "≥15 ng/L"],
], colWidths=[3.5*inch, 2.0*inch])
example02.setStyle(TableStyle([
('BACKGROUND', (0,0), (-1,0), NAVY),
('GRID', (0,0), (-1,-1), 0.4, colors.grey),
('FONTSIZE', (0,1), (-1,-1), 8.3),
('ROWBACKGROUNDS', (0,1), (-1,-1), [colors.white, LIGHT]),
('TOPPADDING', (0,0), (-1,-1), 4), ('BOTTOMPADDING', (0,0), (-1,-1), 4),
]))
story.append(example02)
story.append(Spacer(1, 4))
story.append(Paragraph(
"Numbers shown are one representative assay/generation example. Every manufacturer publishes its own "
"validated 0/2h cutoff table — always confirm against your lab's specific assay insert, since values "
"differ between assay generations (e.g., newer high-throughput Gen6-class assays use different absolute "
"numbers than earlier generations of the same platform).", small))
story.append(Spacer(1, 8))
story.append(pearl_box(
"0/3h and older \"delta troponin over 6 hours\" protocols are now downgraded (ESC moved from Class I to a lesser "
"recommendation) because they have a materially weaker rule-out performance than 0/1h or 0/2h strategies. "
"If your institution is still doing 6-hour serial troponins as the primary pathway, it is behind current evidence.",
label="PRACTICE GAP", bg=AMBER_BG, border=colors.HexColor('#c9a227'), txtcolor=AMBER_TXT))
story.append(PageBreak())
# ---------- HEART SCORE ----------
story.append(Paragraph("STEP 2 — The HEART Score", section_header))
story.append(Paragraph(
"Designed specifically for ED patients with possible ACS (not for use outside the ED population). "
"Five components, each scored 0, 1, or 2 points.", body))
story.append(Spacer(1, 6))
heart_data = [
[Paragraph(x, cell_hdr) for x in ["Variable", "0 points", "1 point", "2 points"]],
["History", "Nonspecific for ACS", "Mixed elements", "Specific/typical for ACS"],
["ECG", "Normal", "Nonspecific repolarization change (no significant ST deviation)", "Significant ST deviation (depression ± elevation), new or age unknown"],
["Age", "<45 years", "45-64 years", "≥65 years"],
["Risk Factors*", "None", "1-2 risk factors", "≥3 risk factors OR known atherosclerotic disease"],
["Troponin", "<1x local 99th-percentile URL", "1-3x local 99th-percentile URL", ">3x local 99th-percentile URL"],
]
theart = Table(heart_data, colWidths=[0.85*inch, 1.55*inch, 2.15*inch, 1.95*inch])
theart.setStyle(TableStyle([
('BACKGROUND', (0,0), (-1,0), NAVY),
('GRID', (0,0), (-1,-1), 0.4, colors.grey),
('FONTSIZE', (0,1), (-1,-1), 7.6),
('ROWBACKGROUNDS', (0,1), (-1,-1), [colors.white, LIGHT]),
('VALIGN', (0,0), (-1,-1), 'TOP'),
('TOPPADDING', (0,0), (-1,-1), 4), ('BOTTOMPADDING', (0,0), (-1,-1), 4),
]))
story.append(theart)
story.append(Spacer(1, 3))
story.append(Paragraph("*Risk factors: diabetes, current smoker, hypertension, hypercholesterolemia, obesity, family history of CAD, and/or prior MI/PCI/CABG/stroke/PAD.", small))
story.append(Spacer(1, 8))
risk_data = [
[Paragraph(x, cell_hdr) for x in ["Total Score", "Risk Category", "6-week MACE (approx.)", "Suggested Disposition"]],
["0-3", "Low risk", "~1-2%", "Early discharge candidate (with negative troponin)"],
["4-6", "Moderate risk", "~12-17%", "Observation, serial troponin, further testing/imaging"],
["7-10", "High risk", "~50-65%", "Admit; candidate for urgent/emergent intervention"],
]
trisk = Table(risk_data, colWidths=[0.9*inch, 1.2*inch, 1.7*inch, 2.7*inch])
trisk.setStyle(TableStyle([
('BACKGROUND', (0,0), (-1,0), NAVY),
('GRID', (0,0), (-1,-1), 0.4, colors.grey),
('FONTSIZE', (0,1), (-1,-1), 8),
('BACKGROUND', (0,1), (-1,1), GREEN_BG),
('BACKGROUND', (0,2), (-1,2), AMBER_BG),
('BACKGROUND', (0,3), (-1,3), colors.HexColor('#fbe4e1')),
('TOPPADDING', (0,0), (-1,-1), 4), ('BOTTOMPADDING', (0,0), (-1,-1), 4),
]))
story.append(trisk)
story.append(Spacer(1, 8))
story.append(pearl_box(
"The HEART Pathway operationalizes this: HEART 0-3 + two negative serial troponins (0h and 3h) → safe for "
"ED discharge without further cardiac testing. HEART 0-3 with a positive troponin, or HEART ≥4 regardless of "
"troponin, needs further workup/observation.",
label="HEART PATHWAY"))
story.append(PageBreak())
# ---------- rHEART ----------
story.append(Paragraph("STEP 2 (Update) — Recalibrated HEART (rHEART) with a Single hs-TnT", section_header))
story.append(Paragraph(
"Newer validation data support using a <b>single</b> initial hs-cTnT measurement (rather than serial draws) "
"combined with the recalibrated HEART score in appropriately selected patients (Suh et al., Am J Cardiol 2024).", body))
story.append(Spacer(1, 6))
rheart_data = [
[Paragraph(x, cell_hdr) for x in ["Population", "Sensitivity", "NPV (30-day MACE)"]],
["All comers, rHEART ≤3, single hs-TnT", "94.4%", "99.3%"],
["Presenting >3h after symptom onset", "97.0%", "—"],
["AMI specifically (all comers)", "90.0%", "99.3%"],
]
trh = Table(rheart_data, colWidths=[3.2*inch, 1.6*inch, 1.7*inch])
trh.setStyle(TableStyle([
('BACKGROUND', (0,0), (-1,0), NAVY),
('GRID', (0,0), (-1,-1), 0.4, colors.grey),
('FONTSIZE', (0,1), (-1,-1), 8.3),
('ROWBACKGROUNDS', (0,1), (-1,-1), [colors.white, LIGHT]),
('TOPPADDING', (0,0), (-1,-1), 4), ('BOTTOMPADDING', (0,0), (-1,-1), 4),
]))
story.append(trh)
story.append(Spacer(1, 4))
story.append(Paragraph(
"hs-TnT thresholds tested: a single fixed 99th-percentile cutoff of 19 ng/L, or sex-specific cutoffs of "
"14 ng/L (women) / 22 ng/L (men) — both performed similarly. Performance was weaker in patients drawn "
"≤3 hours after symptom onset, since troponin may not yet have risen — repeat testing is still needed "
"in that group.", body))
story.append(Spacer(1, 8))
story.append(pearl_box(
"A single hs-cTnT is only a safe shortcut if the patient is >3 hours from symptom onset. Early presenters "
"still need a second (serial) sample — don't skip the repeat draw just because the first troponin was low.",
label="PEARL"))
story.append(Spacer(1, 10))
story.append(Paragraph("Where hs-cTn CDPs have NOT been validated", ParagraphStyle('sub', parent=body, fontName='Helvetica-Bold', textColor=NAVY, fontSize=9.5)))
story.append(Paragraph(
"A 2024 systematic review of primary care/GP settings found clinical decision rules without troponin, and "
"strategies using conventional (non-high-sensitivity) troponin, had insufficient sensitivity to safely rule "
"out ACS outside the ED (van den Bulk et al., Ann Fam Med 2024). hs-cTn strategies looked promising but remain "
"under-validated in that setting — these pathways are currently an ED-specific tool.", body))
story.append(PageBreak())
# ---------- QUICK RECALL ----------
story.append(Paragraph("QUICK RECALL", ParagraphStyle('QR', parent=title_style, fontSize=15)))
story.append(Spacer(1, 6))
checklist = [
"ECG first: any ACOMI/STEMI-equivalent pattern? If yes, skip biomarker pathway — activate reperfusion now.",
"No occlusion pattern on ECG → draw hs-cTn at 0h. Use your lab's assay-specific 0/1h or 0/2h table, not a memorized number.",
"Onset ≤3h and first troponin low? You still need a repeat draw — too early to rule out.",
"Elevated troponin: confirm a genuine rise/fall pattern (injury vs infarction) before diagnosing ACS.",
"Calculate HEART score in parallel — History, ECG, Age, Risk factors, Troponin (0-2 points each).",
"HEART 0-3 + negative serial troponin = candidate for safe ED discharge.",
"HEART 4-6 = observation/further testing. HEART 7-10 = admit for urgent evaluation regardless of troponin.",
"Remember: elevated troponin is not synonymous with ACS — consider myocarditis, PE, sepsis, renal failure, tachyarrhythmia, heart failure.",
]
for c in checklist:
story.append(Paragraph("☐ " + c, body))
story.append(Spacer(1, 12))
story.append(HRFlowable(width="100%", thickness=0.75, color=colors.HexColor('#999999')))
story.append(Paragraph(
"Companion to the ECG Interpretation Checklist, ECG Practice Workbook, and STEMI-Equivalents Reference Card. "
"Sources: ROSEN's Emergency Medicine Concepts and Clinical Practice; Harrison's Principles of Internal Medicine "
"22e; 2025 ACC/AHA/ACEP/NAEMSP/SCAI ACS Guideline; National Heart Foundation of Australia/CSANZ 2025 ACS "
"Consensus; Suh et al., Am J Cardiol 2024 (rHEART validation, PMID 39151818); van den Bulk et al., Ann Fam Med "
"2024 (PMID 39313342); Bellolio et al., BMJ 2025 (PMID 40154972); assay cutoff tables per manufacturer package "
"inserts (Roche Elecsys, Abbott Architect, Siemens Centaur, Beckman Coulter Access, Singulex Clarity). "
"For education only — always use your institution's locally validated assay-specific thresholds and "
"protocol.",
small))
doc = SimpleDocTemplate(os.path.join(OUTDIR, "Troponin_HEART_Score_Decision_Card.pdf"), pagesize=letter,
topMargin=0.45*inch, bottomMargin=0.45*inch, leftMargin=0.55*inch, rightMargin=0.55*inch)
doc.build(story)
print("DONE")
cd /tmp/workspace/troponin-heart-card && python3 build_card.py 2>&1 | tail -50
Create a troponin/HEART-score decision flowchart card with hs-cTn cutoffs by sex and assay