
Demonstration of cell injury and necrosis using charts and models.
Reading File
Now let me search the medical library for cell injury and necrosis content in parallel.
Finding Sources
Finding Sources
Excellent results. Let me read the key sections from both Robbins textbooks in parallel, and also search for necrosis types.
Reading File
Reading File
Finding Sources
I found excellent content and images. Let me fetch the key diagrams and read more sections on necrosis types and causes.
Loading Image
Loading Image
Reading File
Reading File
Excellent content and images retrieved. Let me now get more on necrosis types and causes, plus the morphology images.
Reading File
Reading File
Loading Image
I now have very rich content. Let me fetch a few more key images - the necrosis type images and the causes of cell injury chart.
Finding Sources
Reading File
I now have all the essential content. Let me fetch a few more images - the necrosis types images and the causes of cell injury to round out the visual demonstration.
Finding Sources
Reading File
I have all the content needed. Let me fetch a few more images from the necrosis types section and then compile the comprehensive answer.
Reading File
Reading File
I now have comprehensive content and images. Let me fetch a few of the key pathology images to include in the final answer.
Loading Image
Loading Image
Loading Image
Loading Image
I now have a complete set of charts, diagrams, and pathology images. Let me compile the comprehensive, visually rich demonstration.
Cell Injury and Necrosis: A Visual Demonstration
Sources: Robbins & Kumar Basic Pathology (9th ed.) and Robbins, Cotran & Kumar Pathologic Basis of Disease (10th ed.)
1. The Fundamental Concept: Progression from Health to Death
When a cell encounters an injurious stimulus - whether hypoxia, toxins, radiation, or infection - it first enters a state of reversible injury. If the stimulus is removed in time, the cell can recover. If the injury persists or intensifies, the cell crosses the "point of no return" and undergoes irreversible injury, culminating in cell death.
Cell death occurs by two main pathways - Necrosis (pathologic, uncontrolled) or Apoptosis (regulated, programmed).
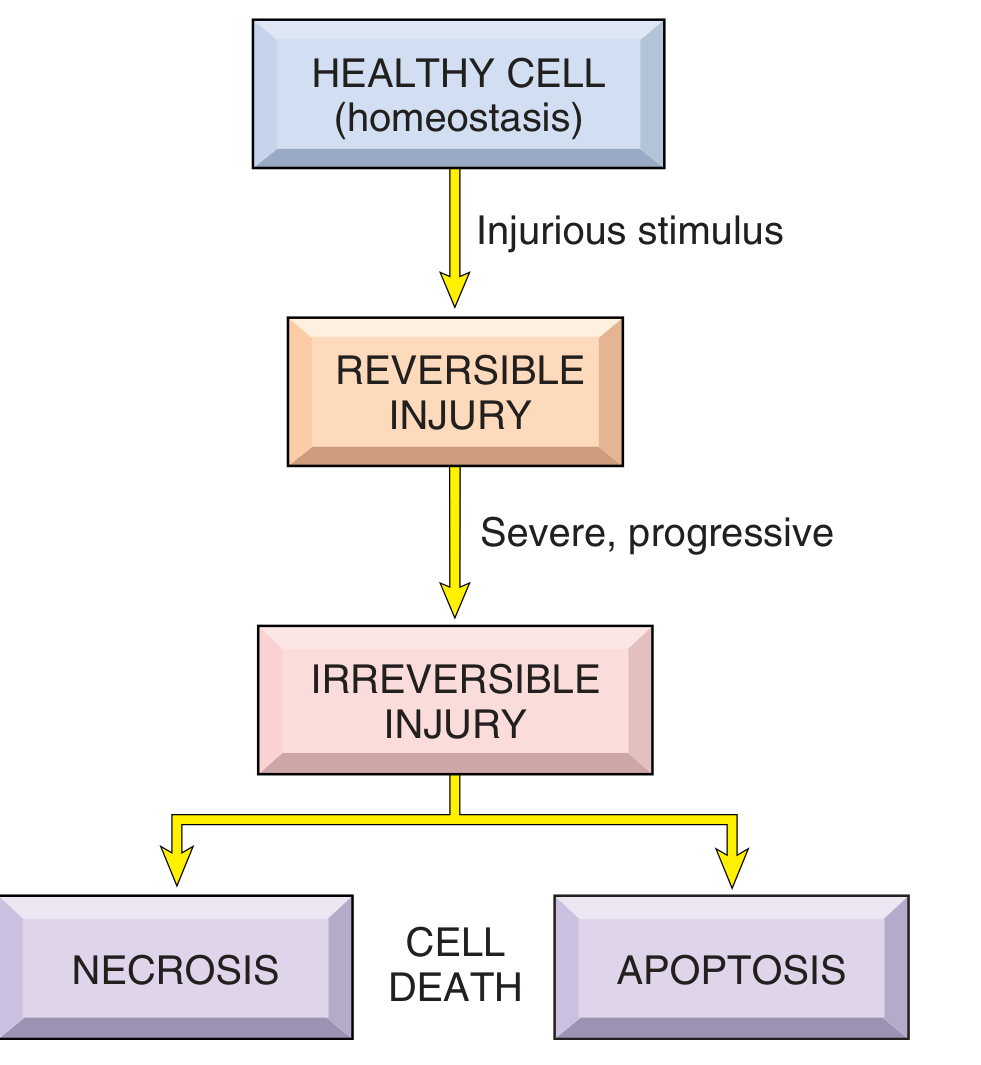
FIG. 1.2 - Sequence of reversible cell injury and cell death (Robbins Basic Pathology)
2. Timeline Chart: When Do Changes Appear?
A key teaching point is that functional loss precedes morphologic change. The chart below shows the sequence:
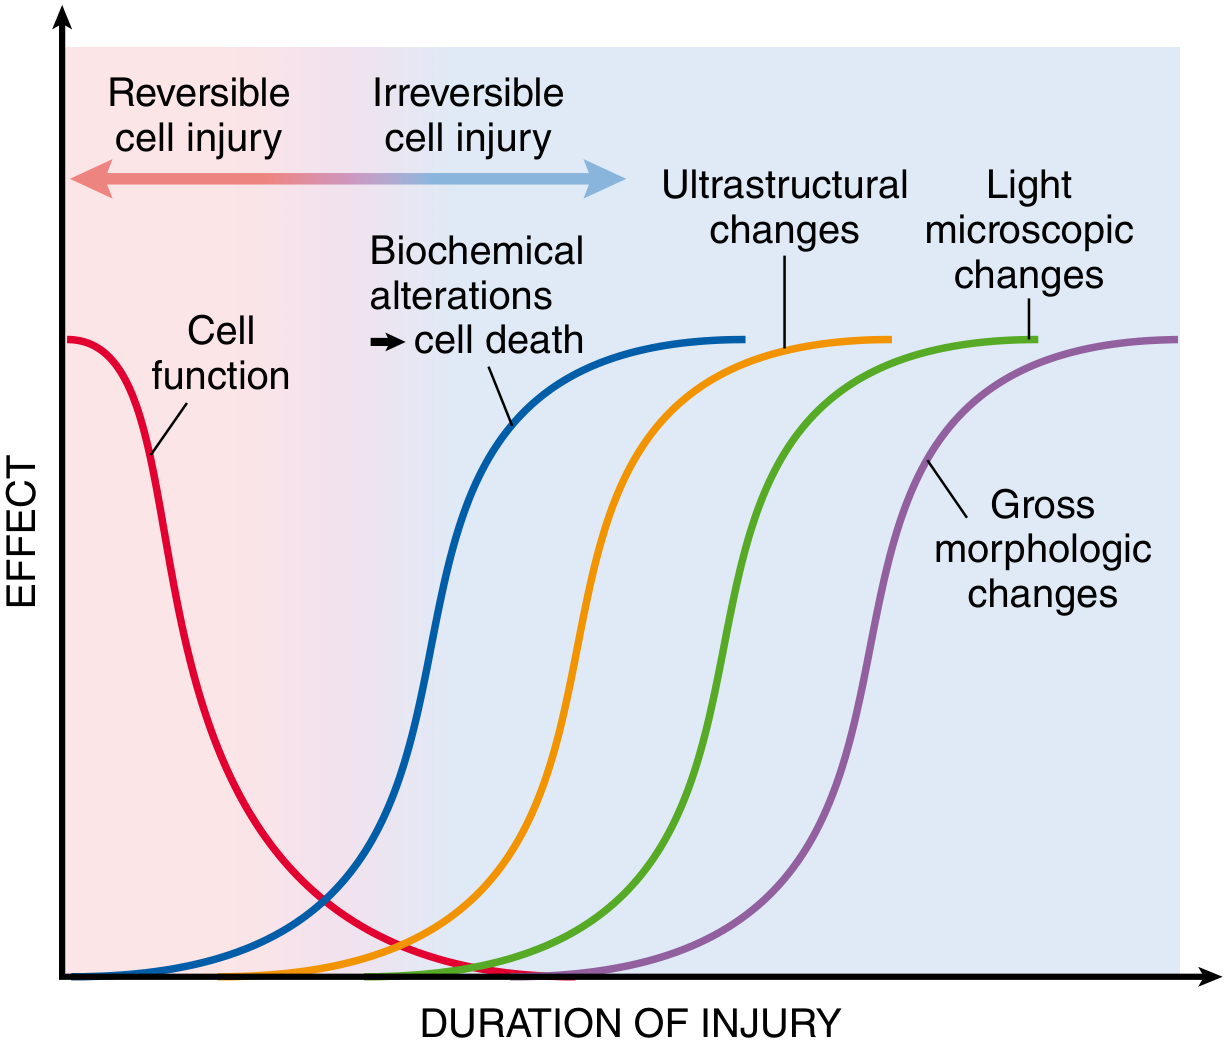
Fig. 2.6 - Sequential development of biochemical and morphologic changes in cell injury (Robbins PBD)
Key time points in myocardial ischemia (clinical example):
| Change | Time After Injury |
|---|---|
| Loss of cell function (non-contractile) | 1-2 minutes |
| Biochemical changes (ATP depletion) | Minutes |
| Ultrastructural changes (EM) | 2-3 hours after cell death |
| Light microscopic changes | 6-12 hours after cell death |
| Gross morphologic changes | Hours to days |
3. Model: Morphologic Changes in Reversible Injury vs. Necrosis
This is the central diagram of cell injury - comparing reversible injury (left) with necrosis and apoptosis (right):
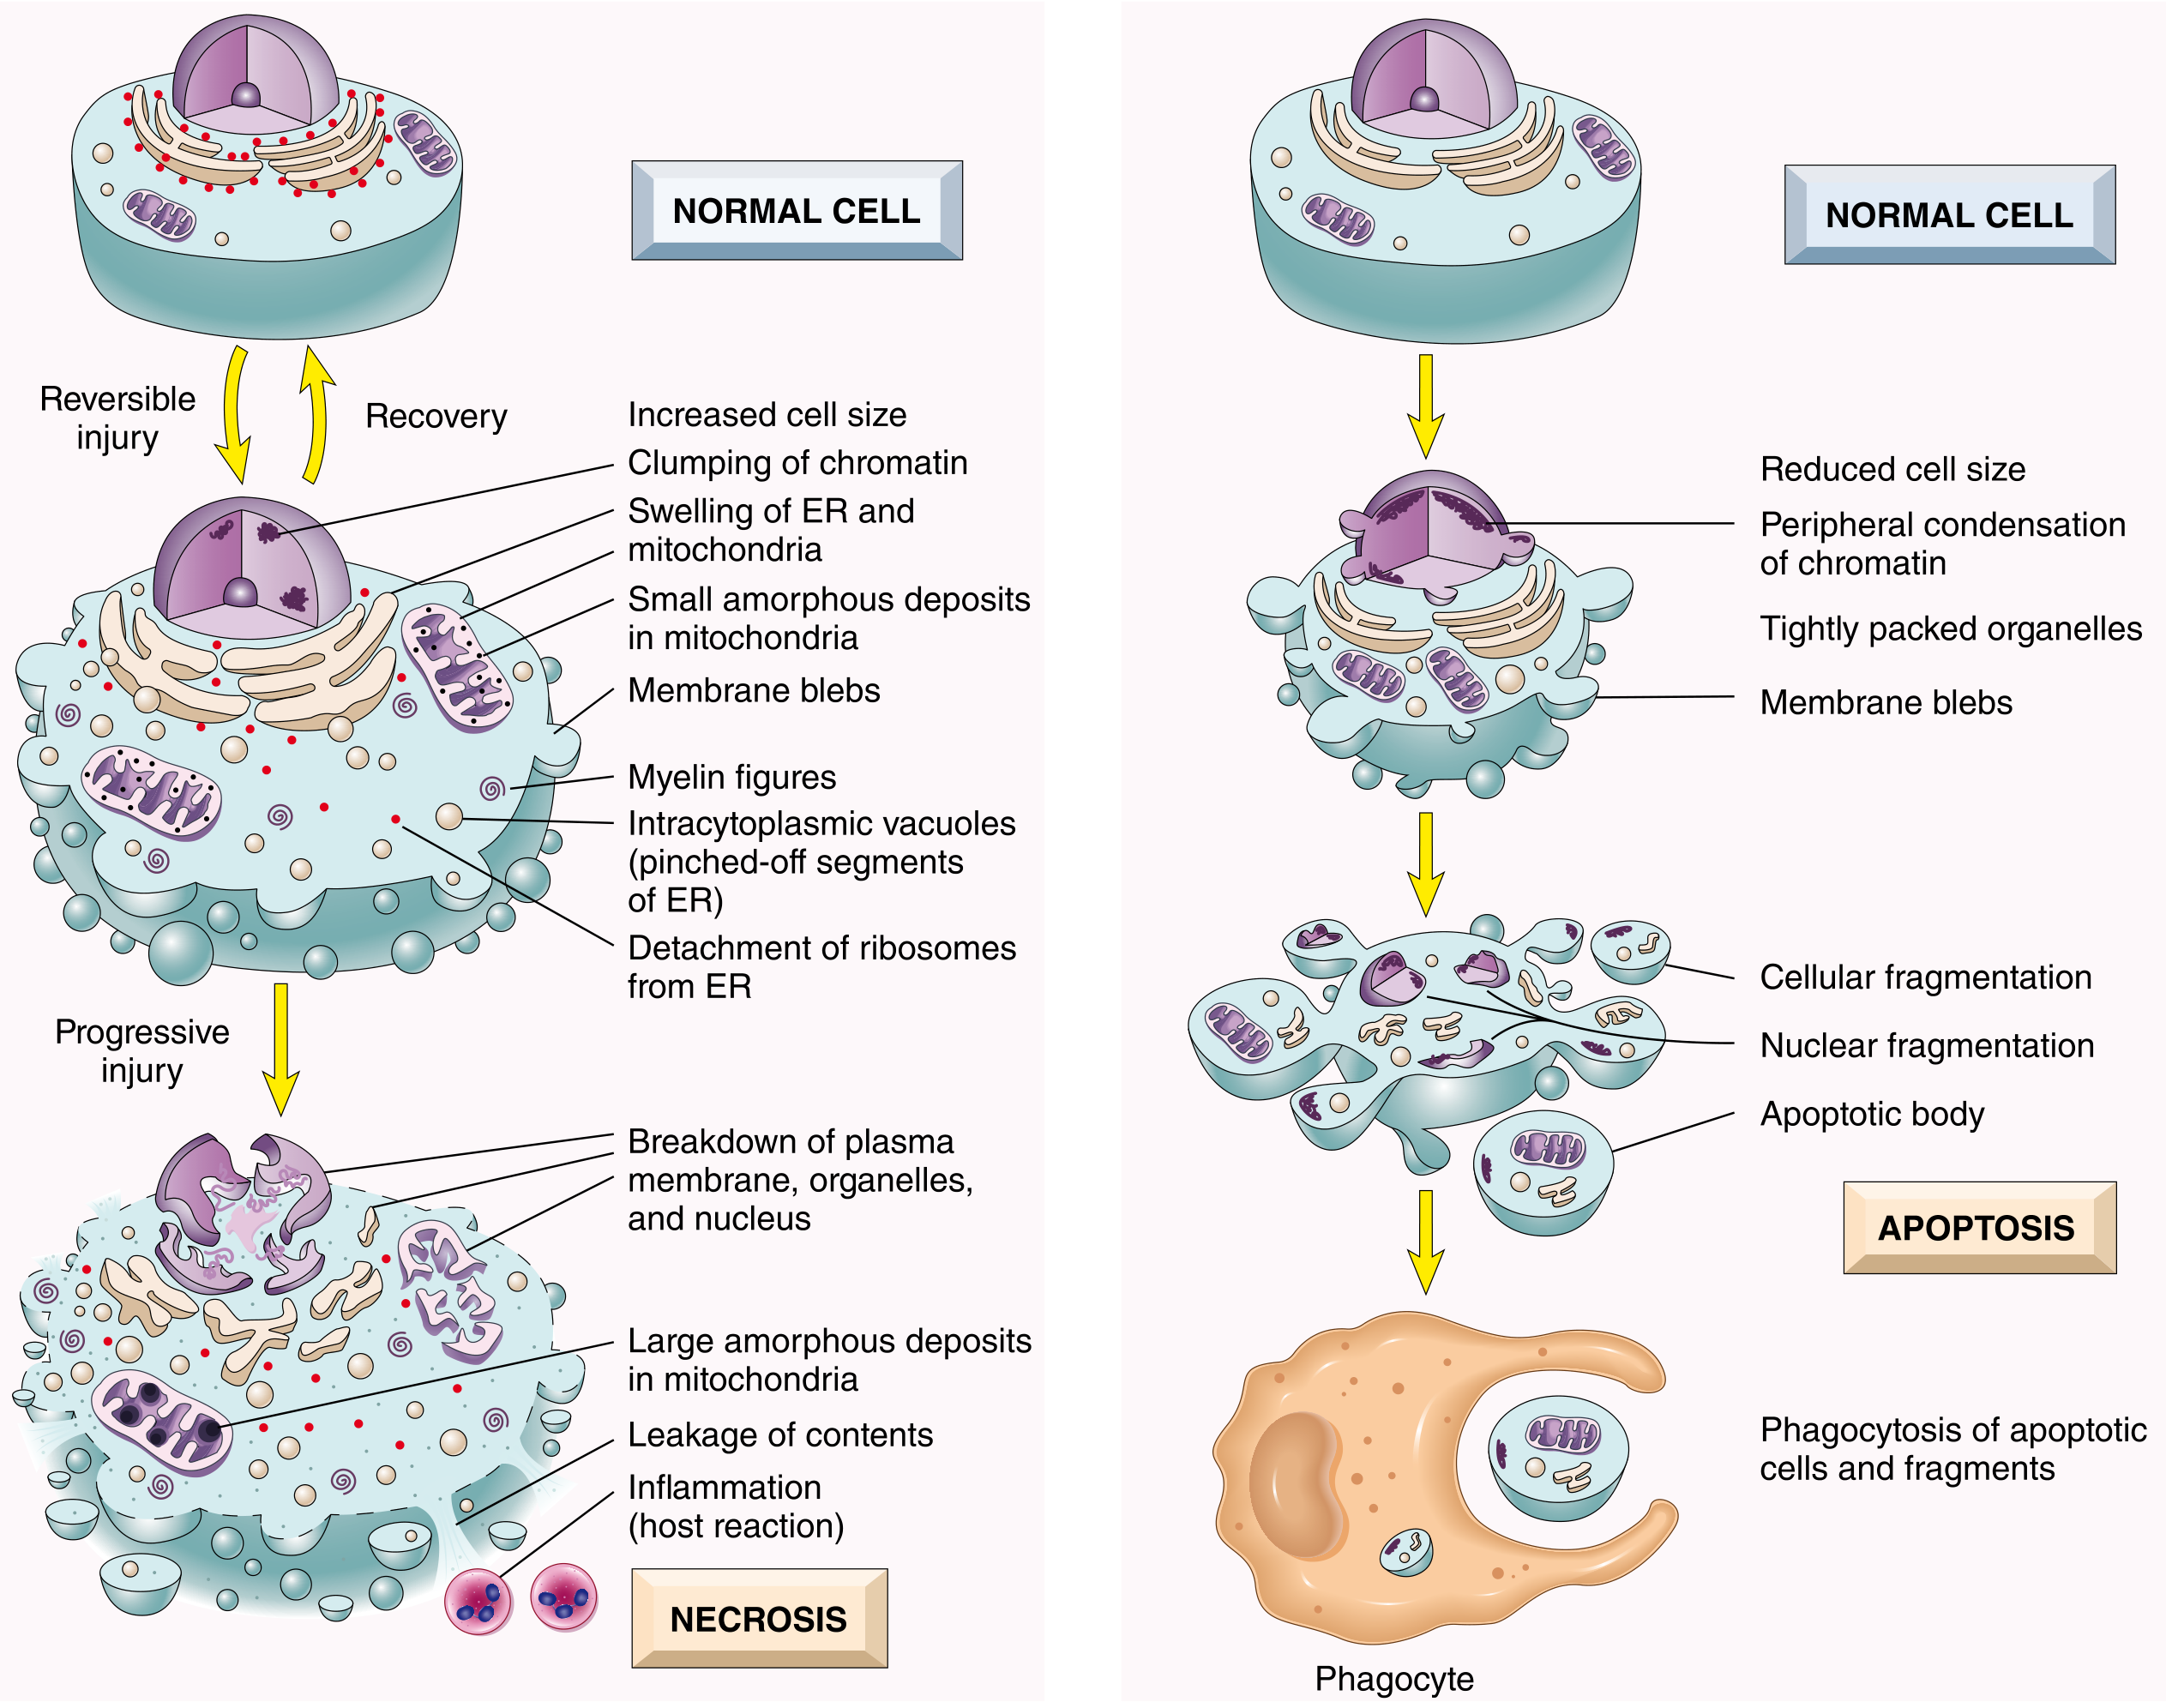
Fig. 2.7 - Morphologic changes in cell injury culminating in necrosis or apoptosis (Robbins PBD)
Reversible Injury - Features Summary:
| Feature | Description |
|---|---|
| Cellular swelling (hydropic change) | Influx of water due to failure of Na⁺-K⁺ ATPase pump |
| Fatty change | Lipid vacuoles appear, especially in liver |
| Plasma membrane blebs | Blebbing and loss of microvilli |
| Mitochondrial swelling | Small amorphous densities appear |
| ER dilation | Detachment of ribosomes, dissociation of polysomes |
| Nuclear chromatin clumping | Early nuclear change |
| Eosinophilia (cytoplasm) | Loss of basophilic RNA |
Irreversible Injury - The "Point of No Return" is defined by two phenomena:
- Inability to reverse mitochondrial dysfunction - ATP generation fails permanently
- Profound disturbances in membrane function - lysosomal membranes rupture, releasing digestive enzymes
4. Histology: Normal vs. Reversible Injury vs. Necrosis
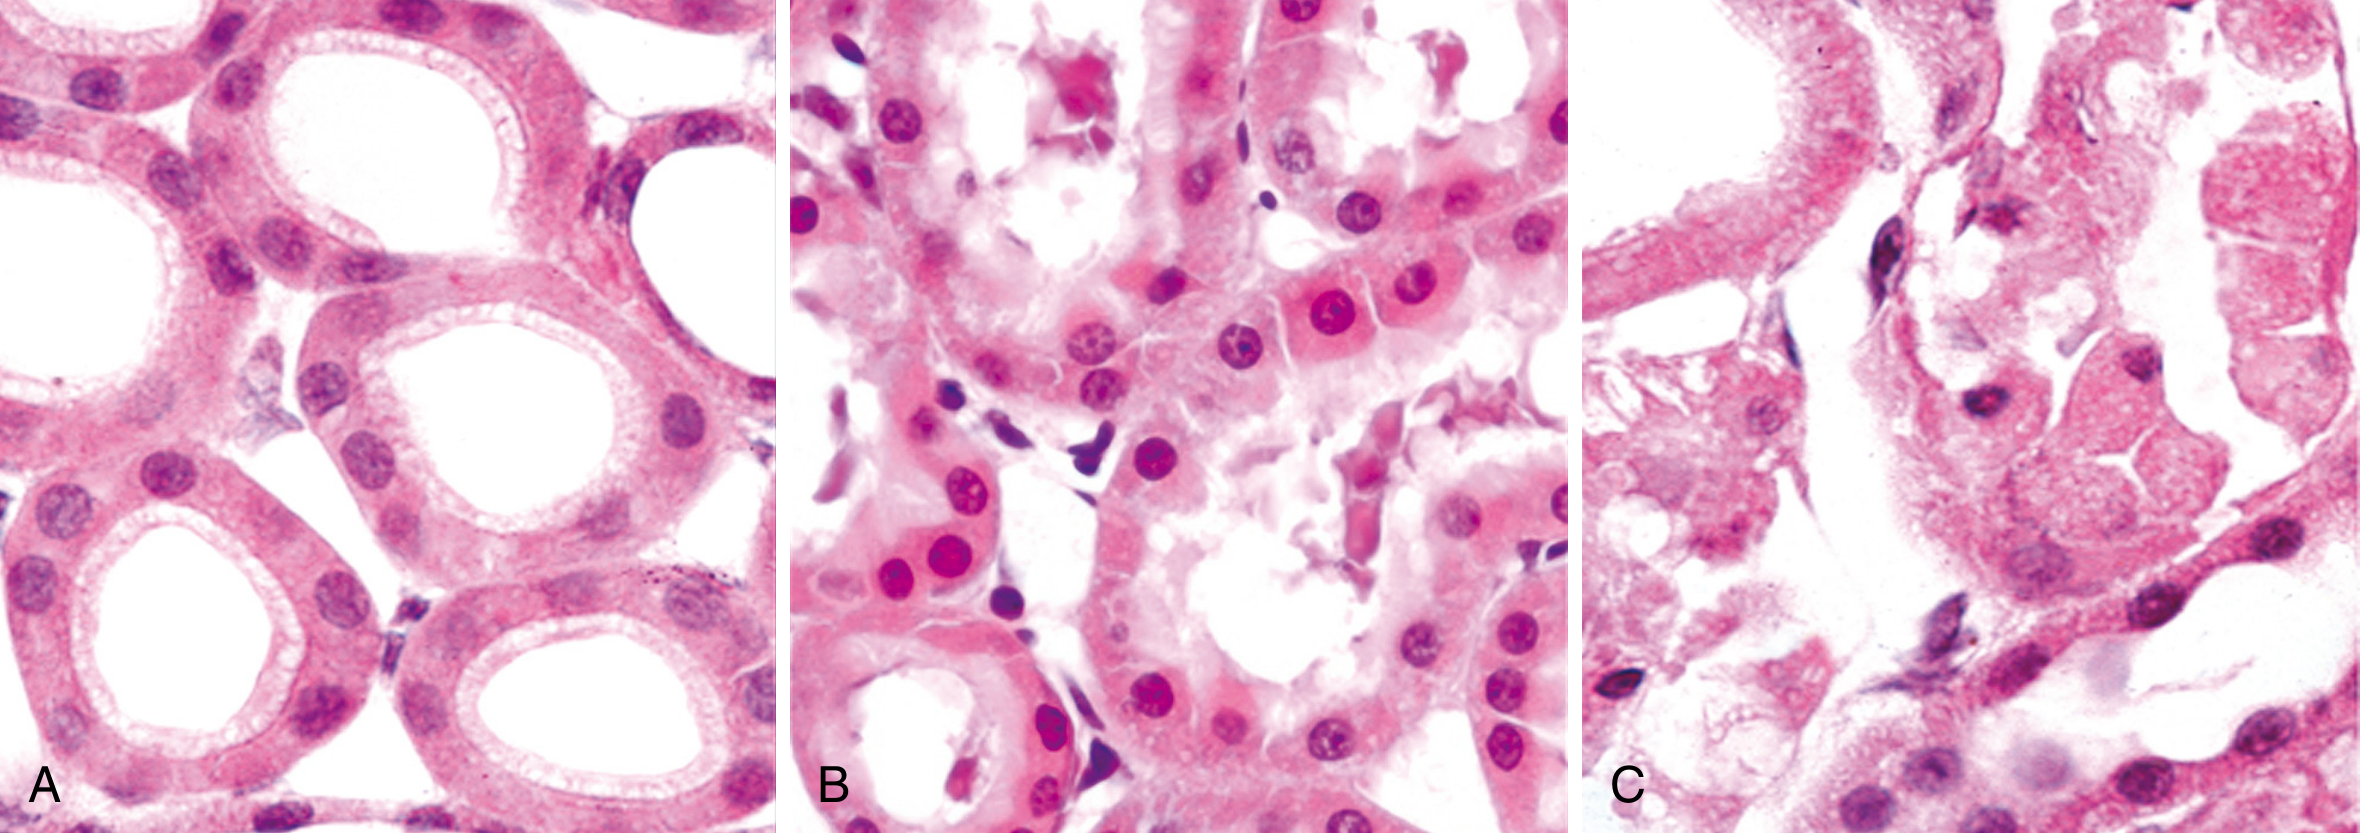
Fig. 2.8 (A) Normal kidney tubules. (B) Early reversible ischemic injury - blebs, increased eosinophilia. (C) Necrosis - loss of nuclei, cell fragmentation, content leakage (Robbins PBD)
5. Nuclear Changes in Necrosis (Three Patterns)
These three nuclear changes are diagnostic hallmarks of necrosis:
NECROTIC NUCLEUS
       │
       ├─── PYKNOSIS ──────── Nuclear shrinkage + intense basophilia (DNA condenses)
       │
       ├─── KARYORRHEXIS ──── Fragmentation of the pyknotic nucleus
       │
       └─── KARYOLYSIS ──────  Fading of basophilia due to DNase digestion of DNA
                                (Complete dissolution in 1-2 days)
Cytoplasmic changes in necrosis:
- Increased eosinophilia (red staining on H&E)
- Glassy, homogeneous appearance (loss of glycogen)
- Vacuolated, "moth-eaten" cytoplasm (organelle digestion)
- Abundant myelin figures
6. Causes of Cell Injury (Summary Chart)
| Category | Examples | Primary Mechanism |
|---|---|---|
| Hypoxia / Ischemia | Coronary artery occlusion, shock | ATP depletion → Na⁺-K⁺ pump failure → cell swelling |
| Physical agents | Trauma, burns, radiation, cold | Direct membrane/DNA damage |
| Chemical / Toxins | CCl₄, heavy metals, drugs, alcohol | Lipid peroxidation, mitochondrial damage |
| Infectious agents | Bacteria, viruses, fungi, parasites | Toxin release, immune-mediated destruction |
| Immunologic reactions | Autoimmune disease, hypersensitivity | Complement activation, cytokine damage |
| Nutritional imbalances | Protein deficiency, vitamin deficiencies | Metabolic failure |
| Genetic defects | Lysosomal storage diseases, enzyme deficiencies | Accumulation of toxic metabolites |
7. The Six Patterns of Tissue Necrosis
When large numbers of cells die, the pattern of tissue necrosis reflects the underlying cause:
7.1 Coagulative Necrosis
Hallmark: Tissue architecture preserved for days; firm texture; eosinophilic anucleate "ghost cells"
Mechanism: Injury denatures both structural proteins AND enzymes simultaneously, blocking proteolysis
Classic example: Myocardial infarct, renal infarct (all solid organs except the brain)
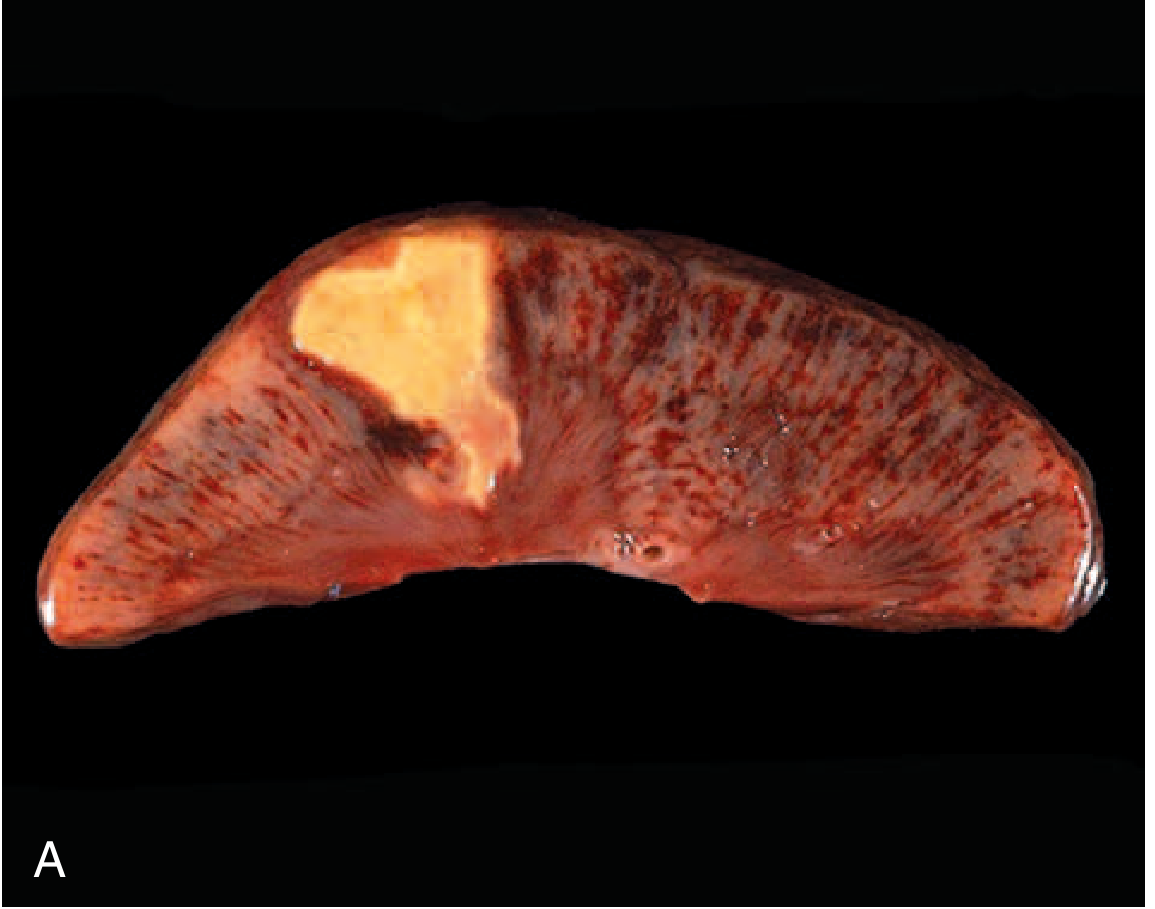
FIG. 1.6 - Coagulative necrosis: wedge-shaped kidney infarct (yellow-tan area) (Robbins Basic Pathology)
7.2 Liquefactive Necrosis
Hallmark: Dead cells completely digested, tissue transforms into viscous liquid; pus if bacterial
Mechanism: Leukocytes accumulate and release enzymes that digest ("liquefy") tissue
Classic examples:
- Brain infarct (hypoxia in CNS always → liquefaction, for unclear reasons)
- Bacterial abscess (pus = creamy yellow liquefied necrotic material)
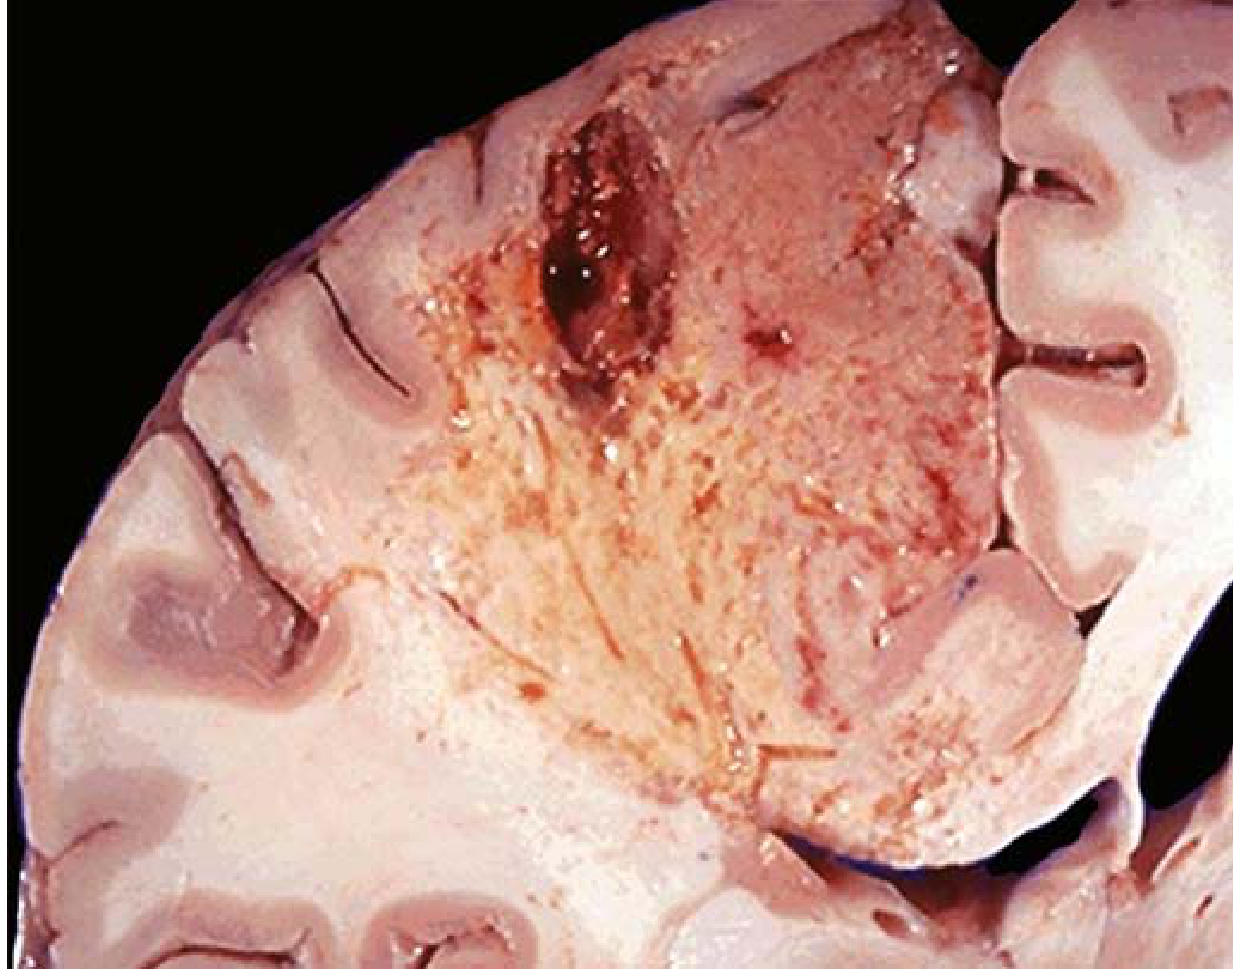
FIG. 1.7 - Liquefactive necrosis: brain infarct with dissolution of tissue (Robbins Basic Pathology)
7.3 Caseous Necrosis
Hallmark: Friable yellow-white "cheese-like" appearance; structureless granular pink debris on H&E; NO preserved architecture; surrounded by granuloma
Mechanism: Neither pure coagulation nor liquefaction - a combination unique to mycobacterial infections
Classic example: Tuberculosis
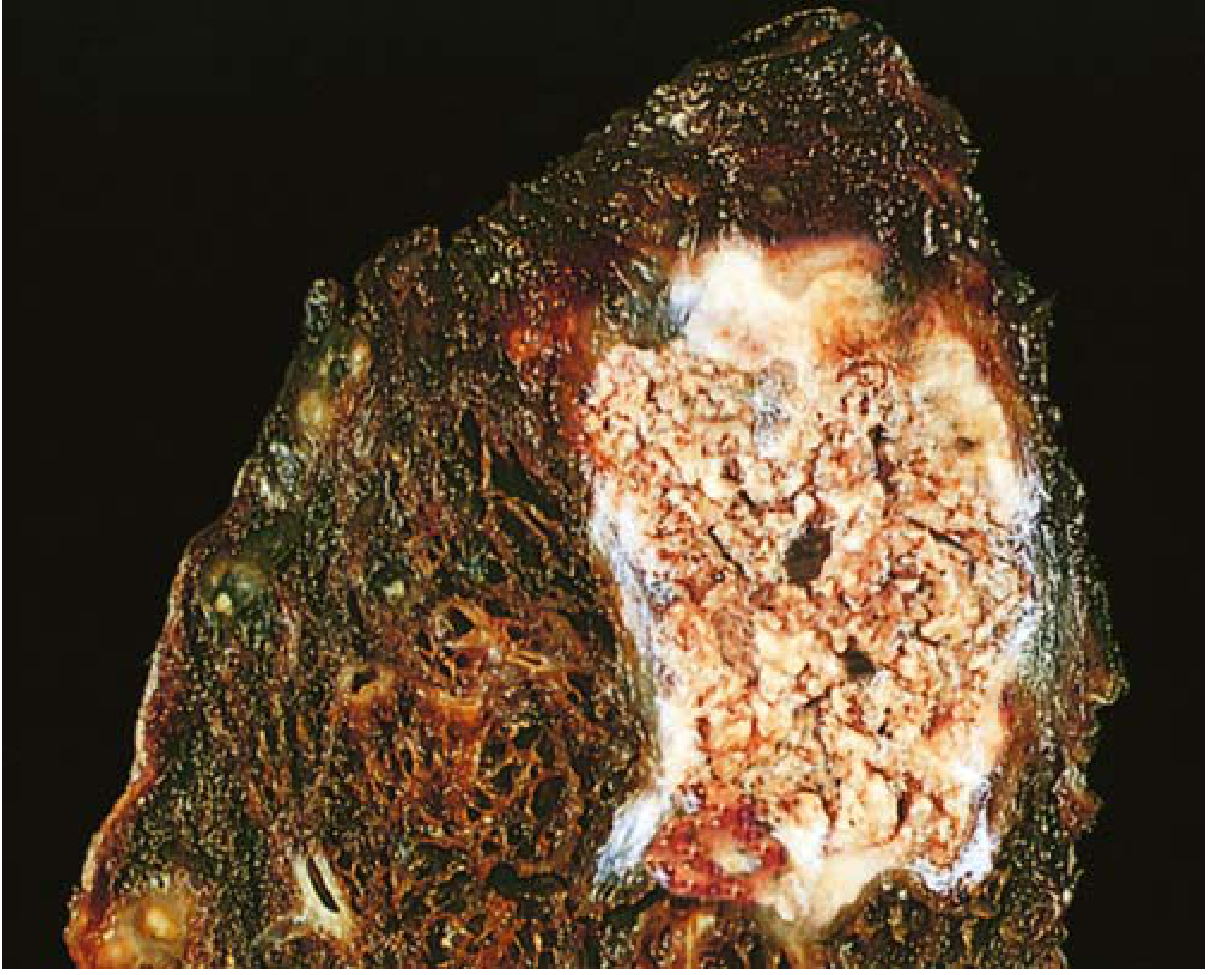
FIG. 1.8 - Caseous necrosis: tuberculosis lung with yellow-white cheesy debris (Robbins Basic Pathology)
7.4 Fat Necrosis
Hallmark: Chalky white deposits (fat saponification); basophilic calcium deposits on histology
Mechanism: Pancreatic lipases leak out and split triglycerides → free fatty acids + calcium → calcium soaps (saponification)
Classic example: Acute pancreatitis, abdominal trauma
7.5 Gangrenous Necrosis
Not a distinct pattern - it is coagulative necrosis of a limb (usually lower leg) after loss of blood supply, affecting multiple tissue layers.
- Dry gangrene = pure coagulative necrosis
- Wet gangrene = superimposed bacterial infection → liquefactive component
7.6 Fibrinoid Necrosis
Hallmark: Bright pink, amorphous ("fibrin-like") deposits in vessel walls on H&E; visible only microscopically
Mechanism: Immune complex deposition in vessel walls + plasma protein leakage
Classic examples: Polyarteritis nodosa, severe hypertension, vasculitis
8. Necrosis vs. Apoptosis - Comparison Chart
| Feature | Necrosis | Apoptosis |
|---|---|---|
| Cause | Severe, "accidental" injury (ischemia, toxins, infections) | Physiologic or pathologic - regulated program |
| Cell size | Swelling (oncosis) | Shrinkage |
| Plasma membrane | Disrupted | Intact (blebs form) |
| Cell contents | Enzymatic digestion, leakage | Packaged into apoptotic bodies |
| Inflammation | YES - always present | NO - no inflammation |
| Nuclear changes | Pyknosis → karyorrhexis → karyolysis | Peripheral chromatin condensation → fragmentation |
| Fate | Phagocytosed by leukocytes | Phagocytosed by macrophages |
| Clinical significance | Pathologic (always abnormal) | Physiologic AND pathologic contexts |
9. Clinical Biomarkers of Necrosis
Because necrosis causes membrane leakage, intracellular proteins enter the bloodstream - the basis for diagnostic blood tests:
| Organ | Biomarker | Clinical Use |
|---|---|---|
| Heart (myocardium) | Troponin I and T (cardiac-specific) | Myocardial infarction - detectable 2 hours after necrosis |
| Liver (hepatocytes) | AST, ALT (transaminases) | Hepatitis, liver necrosis |
| Bile ducts | Alkaline phosphatase (specific isoform) | Biliary obstruction, cholestasis |
| Pancreas | Amylase, lipase | Pancreatitis |
| Skeletal/cardiac muscle | CK-MM / CK-MB | Rhabdomyolysis, MI |
Cardiac troponins appear in blood as early as 2 hours after myocardial cell necrosis - well before light microscopic changes of infarction are visible (4-12 hours).
Summary Model
INJURIOUS STIMULI
(Hypoxia, Toxins, Radiation, Infection, Immune)
             │
             ▼
    [ATP Depletion + Membrane Damage]
             │
             ▼
    REVERSIBLE INJURY (recoverable if stimulus removed)
    - Cell swelling (hydropic change)
    - Fatty change
    - Membrane blebbing
    - Mitochondrial swelling
    - ER dilation, ribosome detachment
             │
             │ Stimulus persists / increases
             ▼
    IRREVERSIBLE INJURY ("point of no return")
    - Mitochondrial dysfunction permanent
    - Lysosomal membrane rupture
             │
             ▼
    ┌────────────────────────────────────────┐
    │              NECROSIS                  │
    │ • Membrane breakdown                   │
    │ • Enzyme leakage → digestion           │
    │ • Nuclear changes (pyknosis/karyorrhexis│
    │   /karyolysis)                         │
    │ • INFLAMMATION (hallmark)              │
    │ • Biomarker release into blood         │
    └────────────────────────────────────────┘
    Patterns: Coagulative | Liquefactive | Caseous
              Fat | Gangrenous | Fibrinoid
All content sourced from Robbins & Kumar Basic Pathology (Robbins Pathology), p. 18-23, and Robbins, Cotran & Kumar Pathologic Basis of Disease, p. 52-56.
This is a shared conversation. Sign in to Orris to start your own chat.