
I am going to give you topic name of neuroanatomy,you explain me like i have 0 knowledge about it and then give me how to write the answer in 5 marks
Fourth ventricle
fourth ventricle anatomy diagram floor roof boundaries
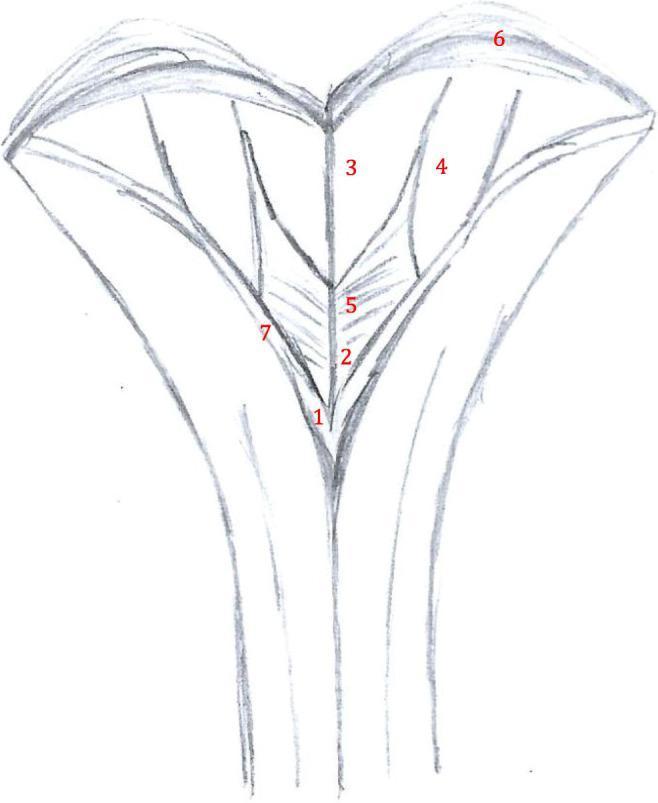
Anatomical diagram depicting the surgical anatomy of the rhomboid fossa, specifically the inferior aspect of the floor of the fourth ventricle. The illustration uses a schematic sketch format to identify key neuroanatomical landmarks. At the most inferior point of the ventricular floor is the obex (1), marking the transition to the central canal. Just superior to the obex lies the area postrema (2). The ventricular floor displays distinct trigones: the trigonum nervi hypoglossi (3) located medially, and the trigonum nervi vagi (5) situated laterally and slightly inferiorly. Further lateral is the area acustica (4). The superior boundary of this region is demarcated by the striae medullares (6), which run transversely across the floor. The lateral borders of the inferior ventricle are formed by the taenia (7). This diagram serves as an educational resource for identifying critical brainstem structures during sub-occipital surgical approaches, emphasizing the spatial relationships within the medulla oblongata's posterior surface.
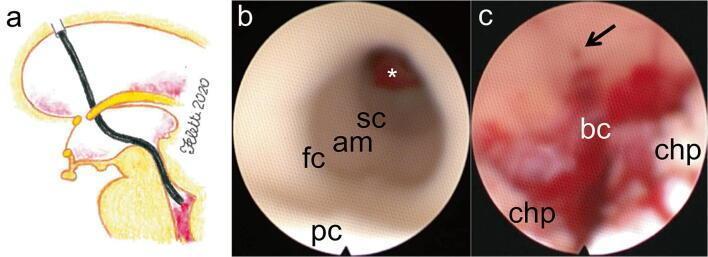
This composite educational resource illustrates the endoscopic management of intraventricular hemorrhage (IVH) via transaqueductal navigation. (a) A sagittal anatomical diagram depicts the trajectory of a flexible neuroendoscope from a precoronal burr hole through the lateral and third ventricles into the fourth ventricle. (b) An intraoperative endoscopic image shows the internal anatomy of the cerebral aqueduct, identifying the floor (fc), ampulla (am), and second constriction (sc). A prominent blood clot (*) is visible obstructing the distal egressus of the aqueduct near the posterior commissure (pc). (c) A subsequent intraoperative view demonstrates the inferior triangle of the fourth ventricle post-aspiration. Key landmarks include the choroid plexus (chp) on the ventricular roof and the canalis centralis medullaris at the calamus scriptorius (arrow). Residual blood clots (bc) are noted obstructing the foramen of Magendie. This visual sequence highlights the surgical approach to restoring cerebrospinal fluid (CSF) pathway patency in cases of obstructive hydrocephalus caused by hemorrhage.
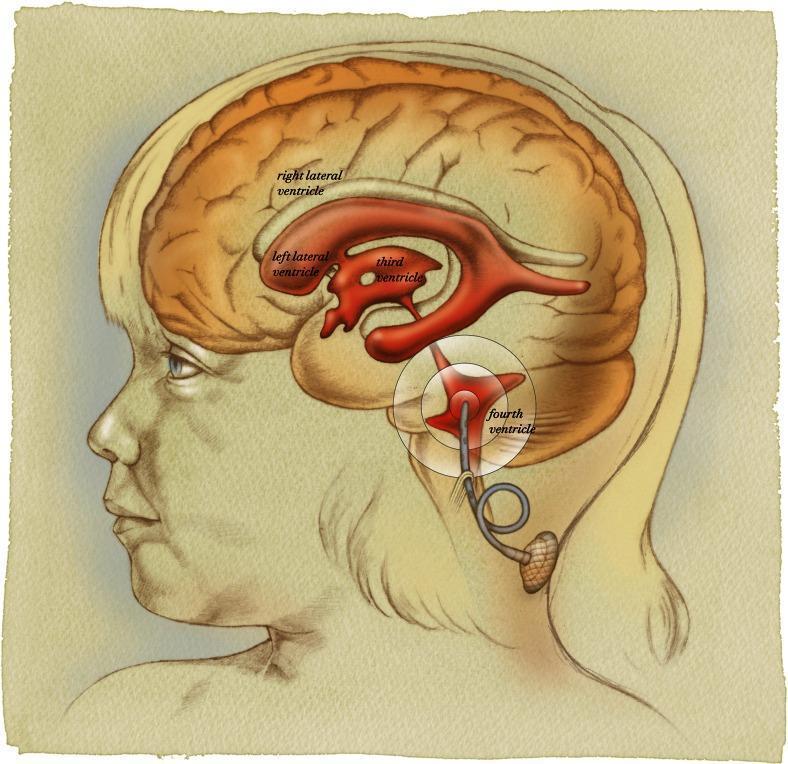
This medical illustration depicts an anatomical diagram of the human brain's ventricular system in a sagittal view, highlighting the surgical placement of a fourth ventricle catheter and ventricular access device (VAD). The ventricular system is rendered in red, showing the bilateral C-shaped lateral ventricles, the centrally located third ventricle, and the diamond-shaped fourth ventricle in the posterior fossa near the brainstem and cerebellum. A gray ventricular catheter is shown inserted directly into the fourth ventricle, positioned parallel to the ventricular floor. The catheter exits the cranium and incorporates a 'relief loop' designed to prevent mechanical tension during neck movement. It terminates in a subcutaneous VAD positioned at the base of the neck/posterior scalp area. This illustration serves to demonstrate a neurosurgical approach for direct ventricular access, often utilized for localized chemotherapy delivery or cerebrospinal fluid (CSF) management. Key anatomical landmarks include the cerebral cortex, brainstem, and the suboccipital region where the surgical incision and device tunneling occur.
🧠 Fourth Ventricle - Complete Guide
PART 1: EXPLAINED FROM ZERO (Like You Know Nothing)
What is a Ventricle?
- 2 Lateral ventricles (one in each hemisphere - the biggest rooms)
- 1 Third ventricle (in the middle)
- 1 Fourth ventricle (the one we are studying)
So What is the Fourth Ventricle?
Location - Where Exactly is it?
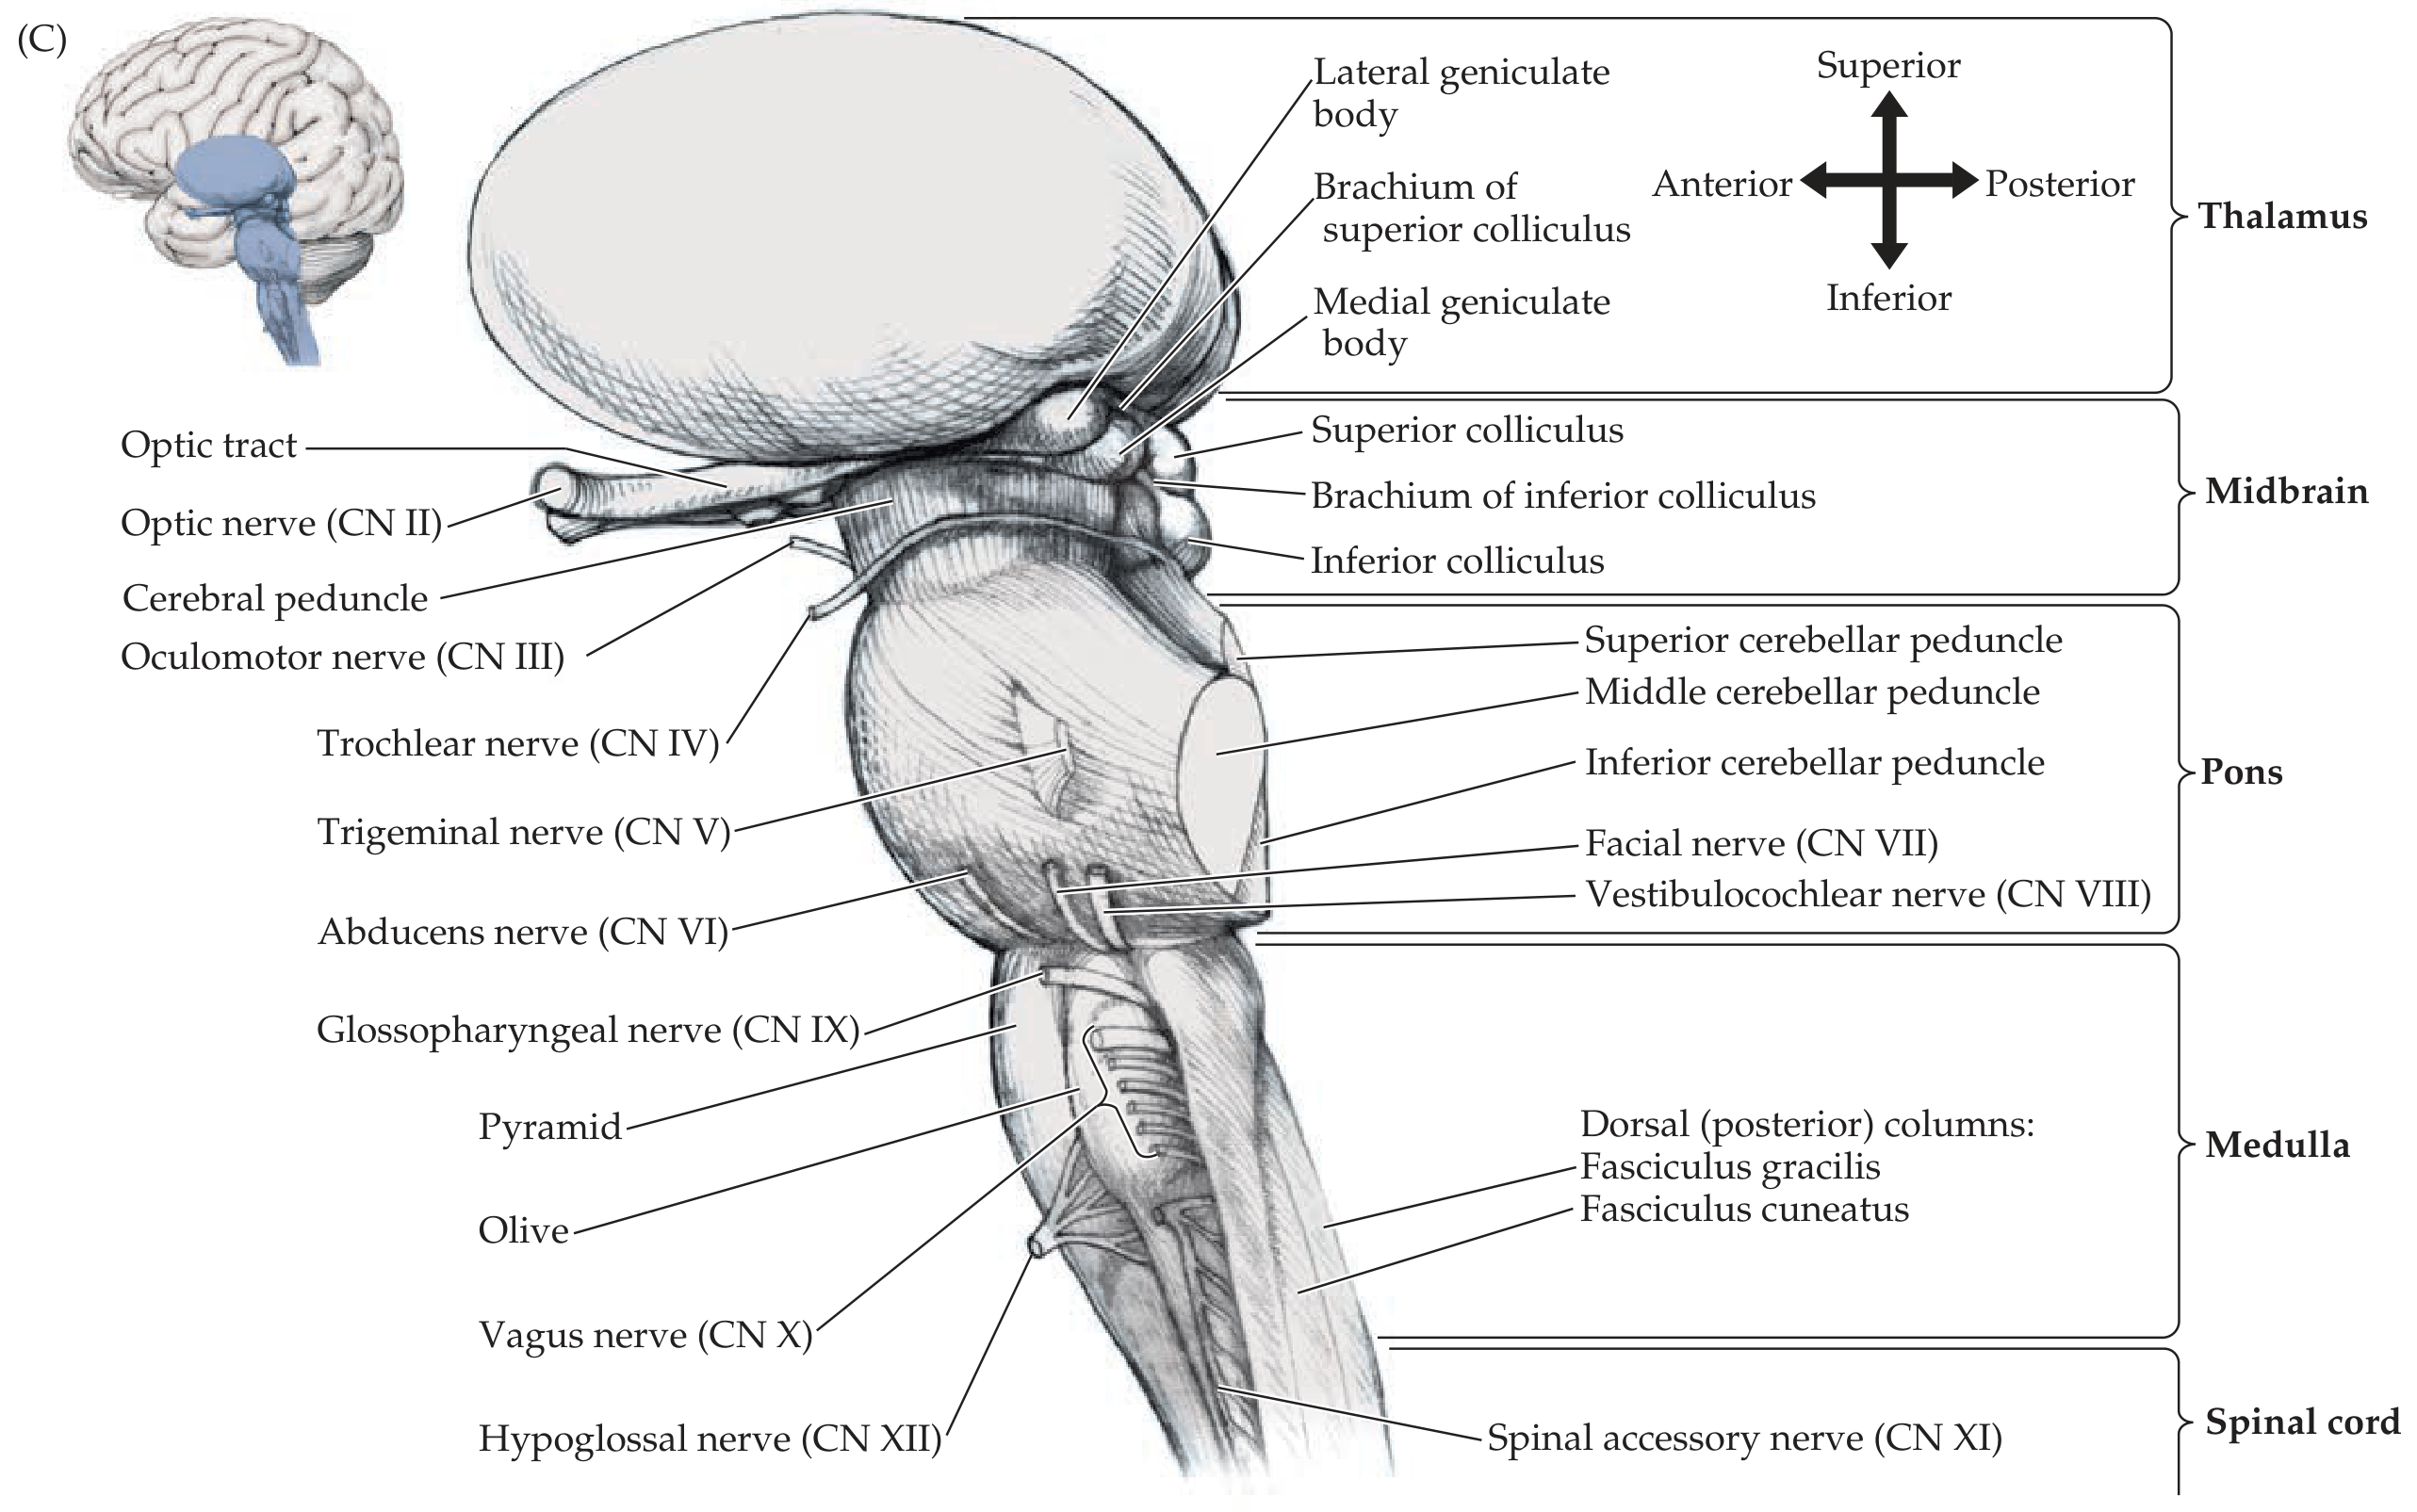
- In front of it (its floor): The pons (upper part) and medulla oblongata (lower part) - together called the brainstem
- Behind it (its roof): The cerebellum
- Above it: It connects to the cerebral aqueduct (a narrow canal passing through the midbrain)
- Below it: It tapers to a point called the obex, where it continues as the central canal of the spinal cord
Shape and Parts
- A Floor - formed by the pons and rostral (upper) half of the medulla
- A Roof - formed by the cerebellum (has a tent-like peak called the fastigium)
- Lateral angles - extend out like wings (called the lateral recesses)
Important Landmarks on the Floor (Rhomboid Fossa)
| Structure | What it is |
|---|---|
| Facial colliculus | A bump formed by the abducens nucleus (CN VI) + facial nerve fibers curving around it |
| Hypoglossal trigone | A triangle marking the hypoglossal nucleus (CN XII - tongue movement) |
| Vagal trigone | Marks the dorsal motor nucleus of vagus nerve (CN X) |
| Striae medullares | Horizontal white fibers crossing the floor, dividing it upper (pontine) and lower (medullary) halves |
| Area postrema | Near the obex - this is the vomiting center, lacks the blood-brain barrier |
| Obex | The lowest tip of the floor - marks where the ventricle ends and the spinal canal begins |
| Sulcus limitans | A groove running vertically dividing medial (motor) from lateral (sensory) nuclei |
How CSF Drains OUT of the Fourth Ventricle?
- Foramen of Magendie (1 opening) - Located in the midline of the roof - CSF drains into the cisterna magna below
- Foramina of Luschka (2 openings) - One on each lateral side (at the lateral recesses) - CSF drains into the subarachnoid space
Easy memory trick: "Magendie = Midline (1)" and "Luschka = Lateral (2)" - M comes before L, 1 before 2.
Why Does This Matter Clinically?
- Medulloblastoma - in children, arises from the roof (cerebellum)
- Ependymoma - arises from the lining cells of the floor; classically "squeezes out" through the foramina of Luschka
PART 2: HOW TO WRITE THE 5-MARK ANSWER
Examiner expects: Definition + Location + Boundaries + Floor features + Apertures + Clinical note - all concise and structured.
✍️ Model 5-Mark Answer: Fourth Ventricle
- Floor (anterior wall): Formed by the pons (upper part) and medulla oblongata (lower part) - called the rhomboid fossa
- Roof (posterior wall): Formed by the cerebellum - has a tent-shaped apex called the fastigium
- Lateral angles: Extend as lateral recesses toward the cerebellopontine angle
- Facial colliculus - formed by abducens nucleus (CN VI) + overlying facial nerve fibers
- Hypoglossal trigone - overlies hypoglossal nucleus (CN XII)
- Vagal trigone - overlies dorsal motor nucleus of vagus (CN X)
- Striae medullares - transverse white fibers dividing the floor into pontine (upper) and medullary (lower) halves
- Area postrema - vomiting center; circumventricular organ (lacks BBB)
- Sulcus limitans - longitudinal groove separating medial motor column from lateral sensory column
- Obex - inferior apex; marks the transition to the spinal cord central canal
- Foramen of Magendie - single, midline, in the inferior roof; drains into cisterna magna
- Foramina of Luschka - paired, lateral, at the lateral recesses; drain into the cerebellopontine cisterns
- Blockage of the apertures causes non-communicating (obstructive) hydrocephalus
- Medulloblastoma (most common posterior fossa tumor in children) arises from the roof and compresses the ventricle
- Ependymoma arises from the floor and characteristically extrudes through the foramina of Luschka ("plastic ependymoma")
- The area postrema contains the chemoreceptor trigger zone - drugs acting here cause vomiting
Quick Revision Table (Last-Minute Recall)
| Feature | Detail |
|---|---|
| Shape | Rhomboid / Diamond |
| Floor | Pons + Medulla (Rhomboid Fossa) |
| Roof | Cerebellum (Fastigium = apex) |
| Above | Cerebral aqueduct |
| Below | Central canal (at obex) |
| Midline opening | Foramen of Magendie → Cisterna magna |
| Lateral openings | Foramina of Luschka (×2) |
| Key floor feature | Facial colliculus, Striae medullares, Area postrema, Obex |
| Clinical | Hydrocephalus if blocked; Medulloblastoma; Ependymoma |
Circle of wilis
circle of Willis cerebral arterial anatomy diagram labeled
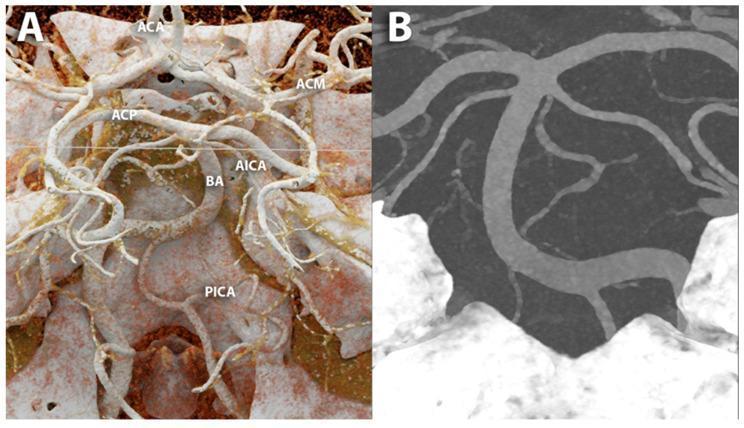
This diagnostic image demonstrates the intracranial arterial anatomy of the Circle of Willis using advanced Photon-Counting CT (PCCT) angiography. The visual is divided into two panels. Panel A utilizes cinematic rendering to provide a high-resolution, three-dimensional spatial overview of the cerebral vasculature. Key labeled structures include the anterior cerebral artery (ACA), middle cerebral artery (ACM), posterior cerebral artery (ACP), and the basilar artery (BA), alongside the anterior inferior cerebellar artery (AICA) and posterior inferior cerebellar artery (PICA). The rendering highlights the complex branching and depth relationships of these vessels within the cranial vault. Panel B presents a Maximum Intensity Projection (MIP) focused on the posterior cerebral circulation, specifically the basilar artery and its branches. This projection emphasizes vascular continuity and the ultra-high-resolution (100 microns) detection of small perforating branches. The image serves as a comparison between different reconstruction techniques in neuroimaging, illustrating the clinical utility of PCCT in evaluating cerebrovascular disease and anatomical variations with high precision.
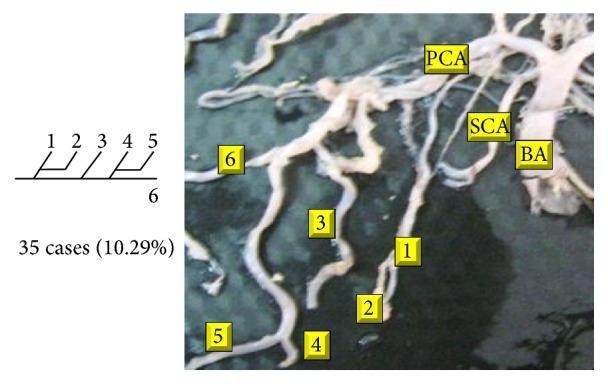
This composite educational image illustrates a Type 13 branching pattern of the posterior cerebral artery (PCA), a morphological variation of the Circle of Willis. The figure consists of a cadaveric clinical photograph of the vertebrobasilar system and a corresponding schematic diagram. In the photograph, key arterial structures are labeled: the basilar artery (BA) serves as the primary trunk, giving rise to the superior cerebellar artery (SCA) and the PCA more superiorly. The distal segment of the PCA, labeled as vessel '6', is shown giving rise to five distinct cortical branches (labeled 1-5). The accompanying schematic diagram provides a simplified representation of this specific architectural arrangement, where a main vessel (6) produces five successive branches. This visual aid is intended for advanced neuroanatomical education, specifically focusing on vascular variations and surgical anatomy of the posterior circulation. Textual data indicates this specific branching pattern was observed in 10.29% (35 cases) of the study specimens.
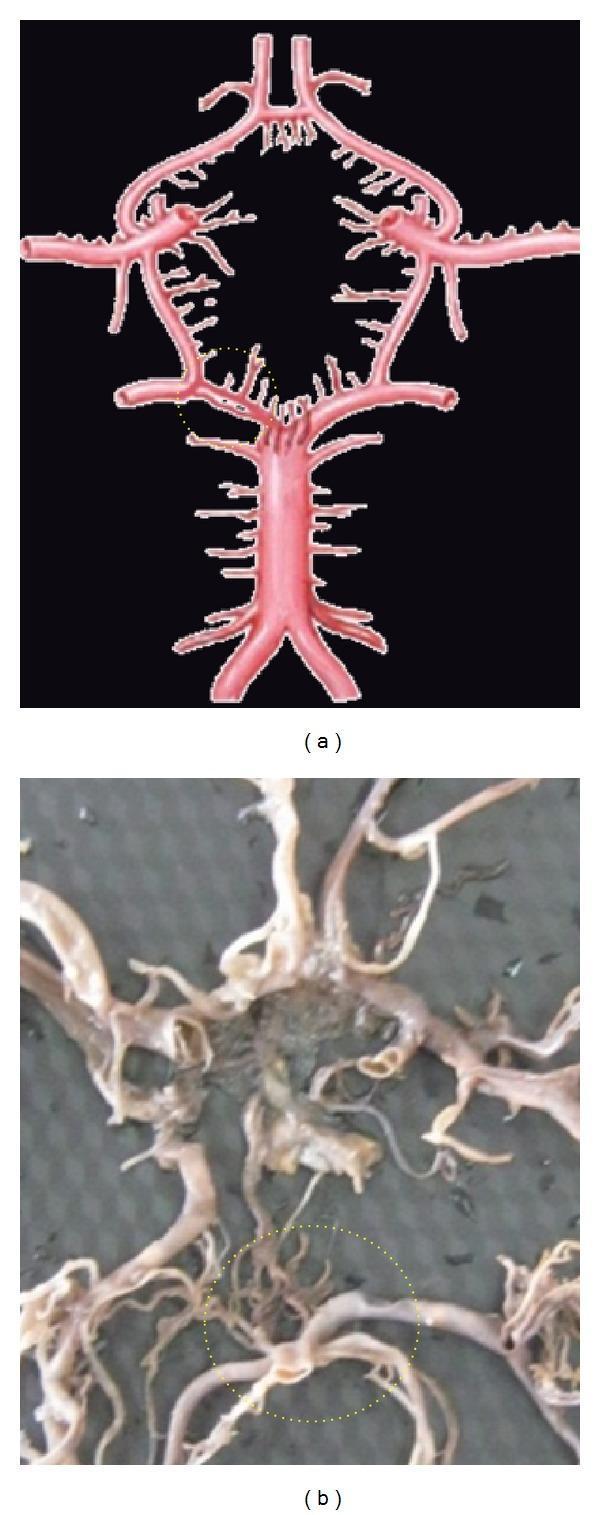
The image consists of two panels (a and b) illustrating the anatomy of the Circle of Willis at the base of the brain. Panel (a) is an anatomical diagram showing a standard arterial configuration with a dotted yellow circle highlighting the junction of the basilar artery and the posterior cerebral artery (PCA). Panel (b) is a clinical photograph of a post-mortem anatomical specimen showing the cerebral vasculature. A dotted yellow circle in panel (b) highlights a vascular anomaly: a duplication of the P1 segment of the posterior cerebral artery. In this region, the arterial pathway consists of two parallel, distinct vascular channels rather than a single vessel. The broader anatomical context displays the basilar artery, internal carotid arteries (ICA), anterior cerebral arteries (ACA), and communicating arteries (ACoA and PCoA). The image is intended for medical education in neuroanatomy and neuroradiology to demonstrate normal anatomical variants and congenital anomalies of the cerebral collateral circulation.
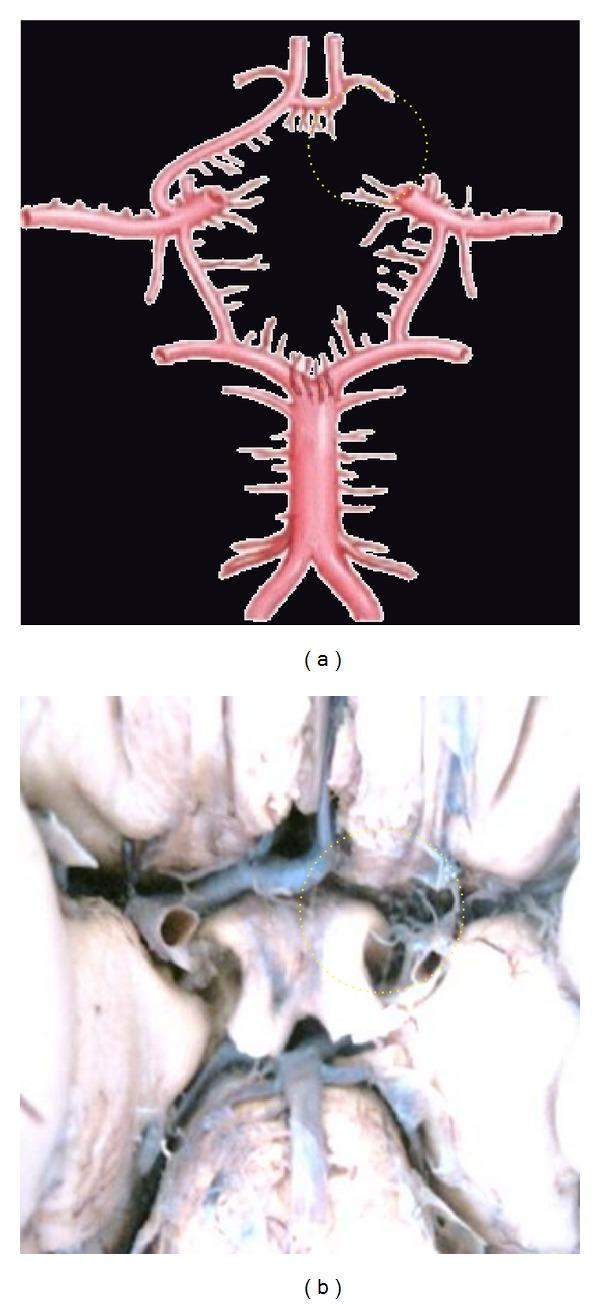
This medical visual content consists of an anatomical diagram (a) and a corresponding clinical photograph of a cadaveric dissection (b) illustrating neurovascular anatomy. The focus is on the Circle of Willis, specifically demonstrating a congenital vascular variation known as aplasia of the A1 segment of the anterior cerebral artery (ACA). In both panels, a yellow dotted circle highlights the area where the right A1 segment should connect the internal carotid artery to the anterior communicating artery (ACoA). The absence of this segment results in an incomplete Circle of Willis, which has clinical significance for collateral cerebral blood flow. The diagram (a) clearly depicts the major components of the cerebral arterial circle, including the basilar artery, posterior cerebral arteries, internal carotid arteries, and the intact left A1 and A2 segments. The clinical photograph (b) provides a real-world view of the same anatomical deficiency at the base of the brain. This material is designed for advanced medical education in neuroanatomy and radiology, emphasizing common vascular anomalies.
🧠 Circle of Willis - Complete Guide
PART 1: EXPLAINED FROM ZERO
Start With a Simple Analogy
Where Does Blood Come From?
- Blood travels up the neck through the Internal Carotid Arteries (ICA) - one on each side
- You can feel the carotid pulse in your neck - that's this vessel
- Blood travels up through the Vertebral Arteries - one on each side, running through holes in the cervical vertebrae
- The two vertebral arteries join together inside the skull to form the Basilar Artery - a single central trunk
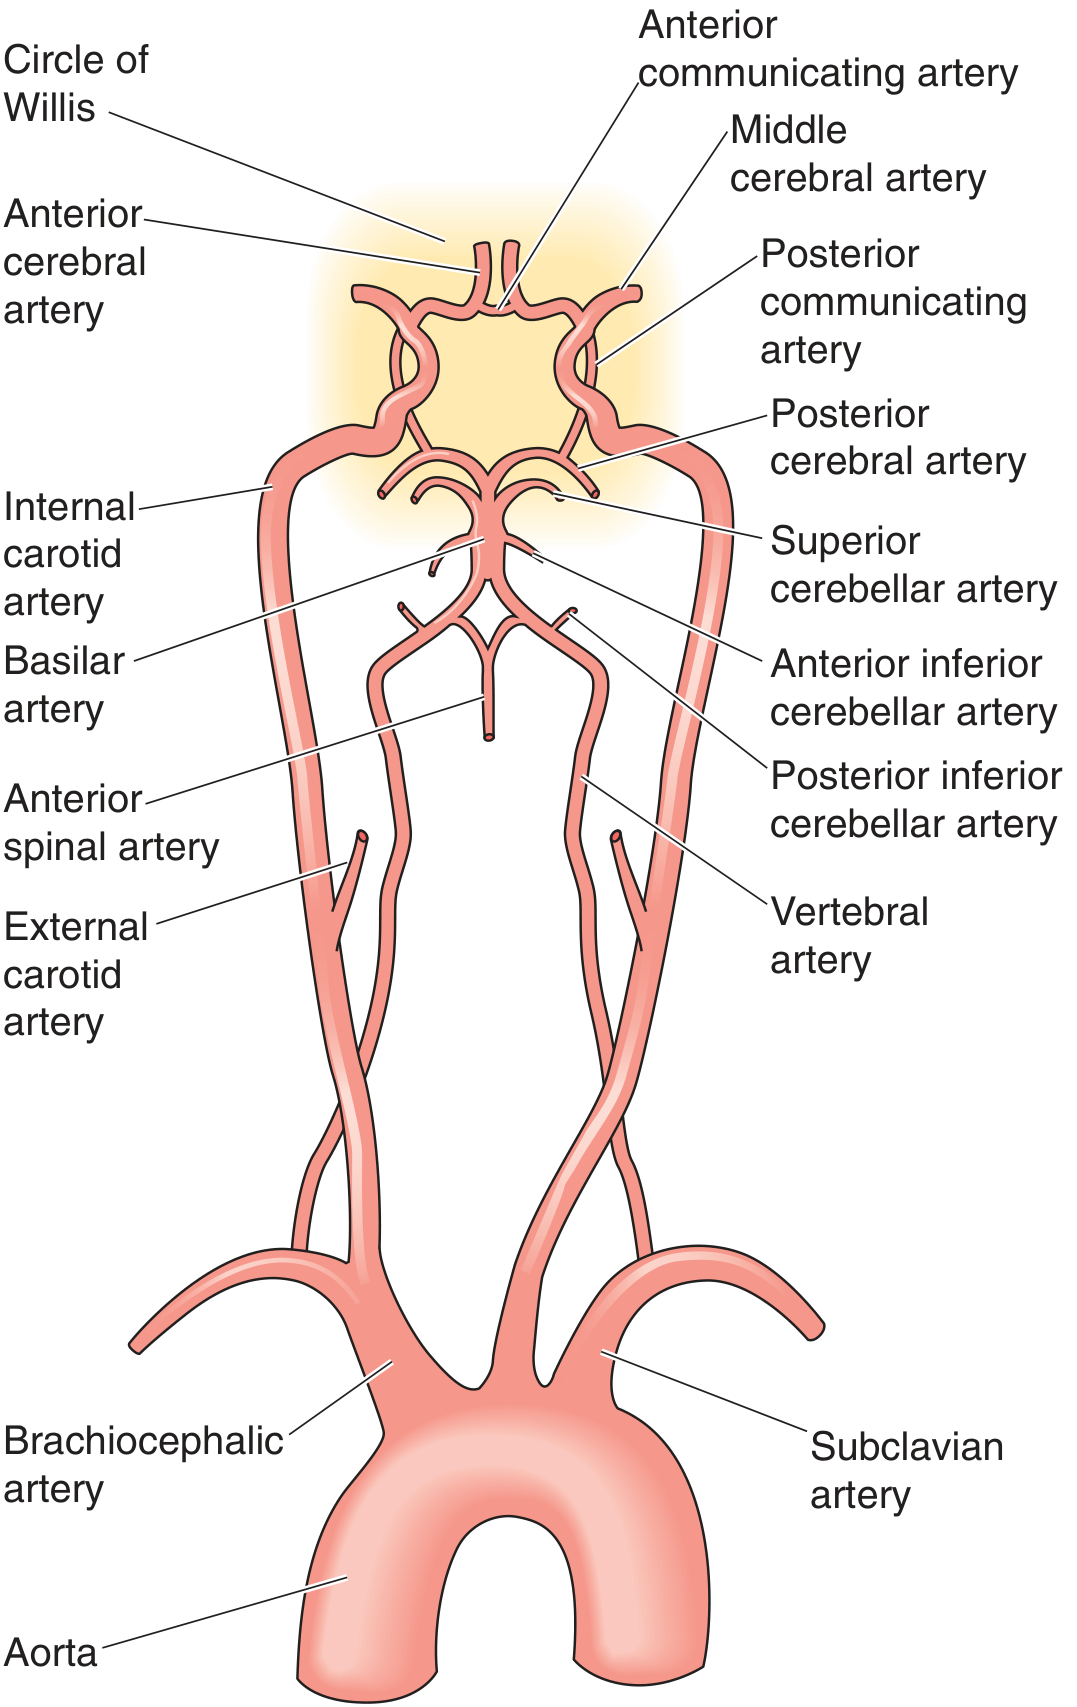
The Circle of Willis - The Ring Itself
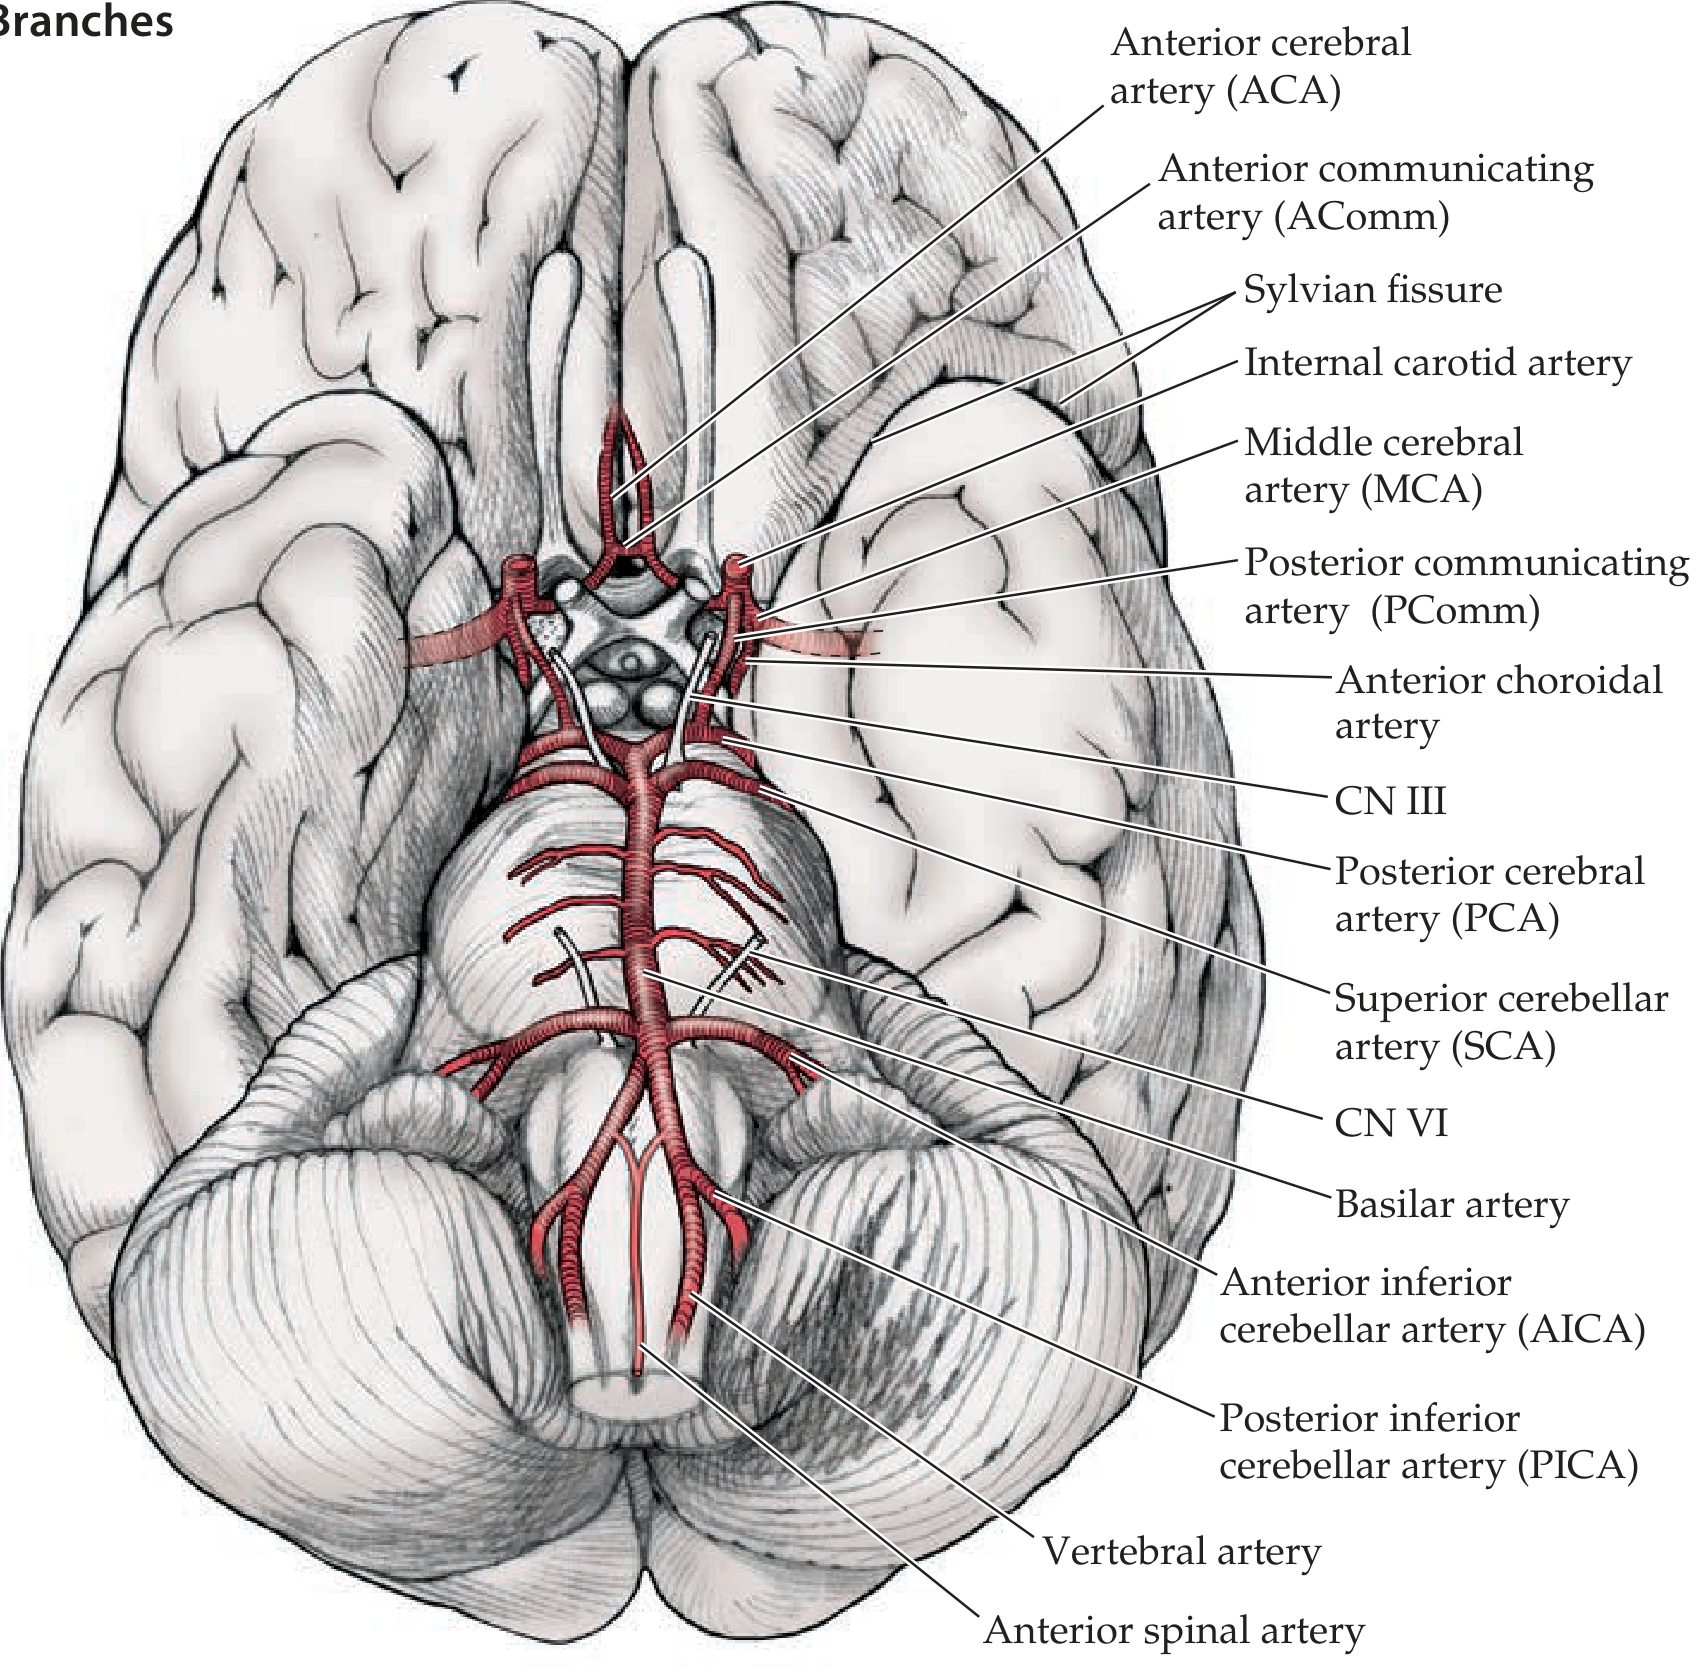
Components of the Circle - Learn Each One
Anterior Part (from Internal Carotid Arteries)
| Vessel | Abbreviation | What it is |
|---|---|---|
| Anterior Cerebral Artery | ACA | Terminal branch of ICA - goes forward and up into the interhemispheric fissure |
| Anterior Communicating Artery | AComm | Short connecting bridge between the two ACAs - completes the top of the ring |
| Middle Cerebral Artery | MCA | The largest branch of ICA - goes laterally into the Sylvian fissure |
| Posterior Communicating Artery | PComm | Connects the ICA to the PCA - joins anterior and posterior circulations |
Posterior Part (from Basilar Artery)
| Vessel | Abbreviation | What it is |
|---|---|---|
| Basilar Artery | BA | Formed by union of two vertebral arteries |
| Posterior Cerebral Artery | PCA | Two terminal branches of the basilar - supply the occipital lobe (vision) and medial temporal lobe |
Note: The MCA is NOT part of the ring itself - it is a branch that arises from the ICA just before the ring. The ring is formed by ACA + AComm + PComm + PCA (and the ICA segments connecting them).
Mnemonic to Remember All Components
"2 ACAs, 1 AComm, 2 ICAs, 2 PComms, 2 PCAs" = 9 vessels make the circle
Why Does This Ring Shape Matter?
Branches FROM the Circle (What It Supplies)
| Artery | Territory Supplied |
|---|---|
| ACA | Medial surface of frontal and parietal lobes; controls leg/foot movement & sensation |
| MCA | Lateral surface of the hemisphere; controls face, arm, speech (Broca's & Wernicke's areas) |
| PCA | Occipital lobe (vision), medial temporal lobe (memory) |
Clinical Significance
- Aneurysm - The junction points (especially the AComm) are the most common sites for berry aneurysms (balloon-like bulges). Rupture causes a subarachnoid hemorrhage - the classic "worst headache of life"
- Stroke - Occlusion of any branch causes infarction of its territory
- Anatomical variants - Absent or hypoplastic vessels (especially PComm or AComm) reduce collateral flow
- Watershed infarcts - At the border zones between ACA/MCA or MCA/PCA territories during low-flow states
PART 2: HOW TO WRITE THE 5-MARK ANSWER
✍️ Model 5-Mark Answer: Circle of Willis
- Two Anterior Cerebral Arteries (ACA) - terminal branches of the internal carotid arteries
- One Anterior Communicating Artery (AComm) - connects the two ACAs across the midline
- Two Internal Carotid Arteries (ICA) - contributing their supraclinoid segments
- Two Posterior Communicating Arteries (PComm) - connect the ICAs to the PCAs, linking the two circulations
- Two Posterior Cerebral Arteries (PCA) - terminal branches of the basilar artery
- Provides collateral circulation - if one feeding vessel is compromised, blood can reach the affected territory via the ring
- All three major cerebral arteries (ACA, MCA, PCA) arise from or near the circle
- Berry (saccular) aneurysms - most commonly at the AComm (35%), ICA-PComm junction (30%), and MCA bifurcation (20%); rupture causes subarachnoid hemorrhage
- Stroke - occlusion of any segment causes ischemic infarction in its territory
- Complete ring present in only ~34% of individuals - anatomical variants are common
- Expanding PComm aneurysm can compress CN III (oculomotor nerve) causing a "surgical" pupil-involving third nerve palsy
Quick Revision Summary Table
| Component | Connects |
|---|---|
| ACA (×2) | Terminal branch of ICA |
| AComm (×1) | Joins right and left ACA |
| PComm (×2) | Joins ICA to PCA (ant. ↔ post.) |
| PCA (×2) | Terminal branch of Basilar artery |
| Basilar artery | Formed by 2 vertebral arteries |
Internal capsule
internal capsule anatomy parts limbs genu labeled diagram
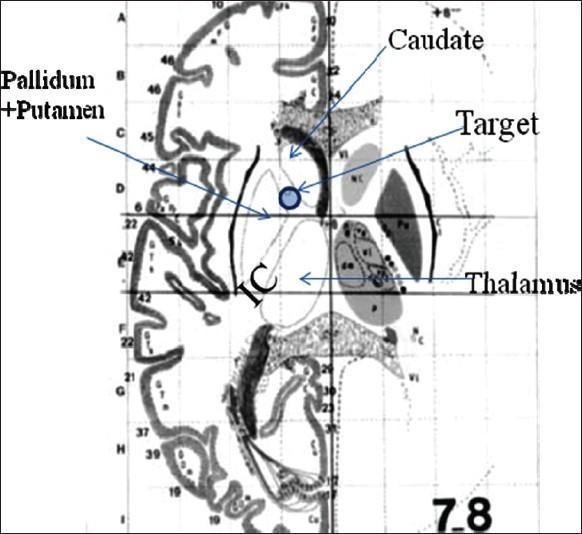
This anatomical diagram represents a stereotactic map of the human brain in the axial plane, specifically illustrating the target site for anterior capsulotomy or deep brain stimulation (DBS) in the treatment of refractory obsessive-compulsive disorder (OCD). The diagram highlights the anatomical relationships between key basal ganglia structures and the internal capsule (IC). The 'Target' is identified as a blue circular area situated within the anterior limb of the internal capsule. Its boundaries are clearly labeled: it is positioned inferior to the head of the caudate nucleus, medial to the pallidum and putamen complex, and superior to the thalamus. The image illustrates the interruption of frontothalamic connections where they converge between the caudate and the putamen. The grid-like overlay indicates stereotactic coordinates used in neurosurgical planning to ensure precise localization for lesioning or electrode placement. This educational visual is relevant for neurosurgery and psychiatry, demonstrating the surgical anatomy of the corticostriatothalamocortical loop.
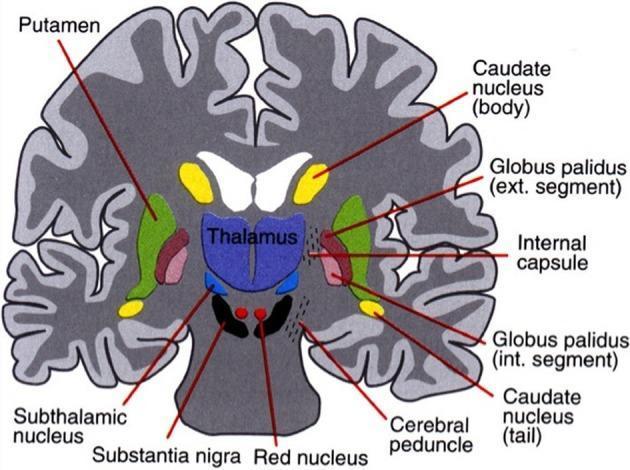
This medical illustration presents a labeled coronal section of the human brain, focusing on the anatomical organization and spatial relationships of the basal ganglia and associated subcortical structures. The diagram depicts the striatum, comprising the caudate nucleus (body and tail) and the putamen, which is situated laterally to the globus pallidus (external and internal segments). The internal capsule is shown as a white matter tract separating the caudate body from the lentiform nucleus. Centrally, the thalamus is positioned superior to the midbrain structures. Deep to the thalamus, the subthalamic nucleus is identified, sitting immediately superior to the substantia nigra. The red nucleus and cerebral peduncles are also visualized within the midbrain region. The use of distinct color-coding—green for the putamen, yellow for the caudate, and blue for the thalamic regions—enhances the educational value for understanding the functional anatomy of motor control circuits and the cortico-striato-thalamo-cortical loops relevant to neurology and neurosurgery.
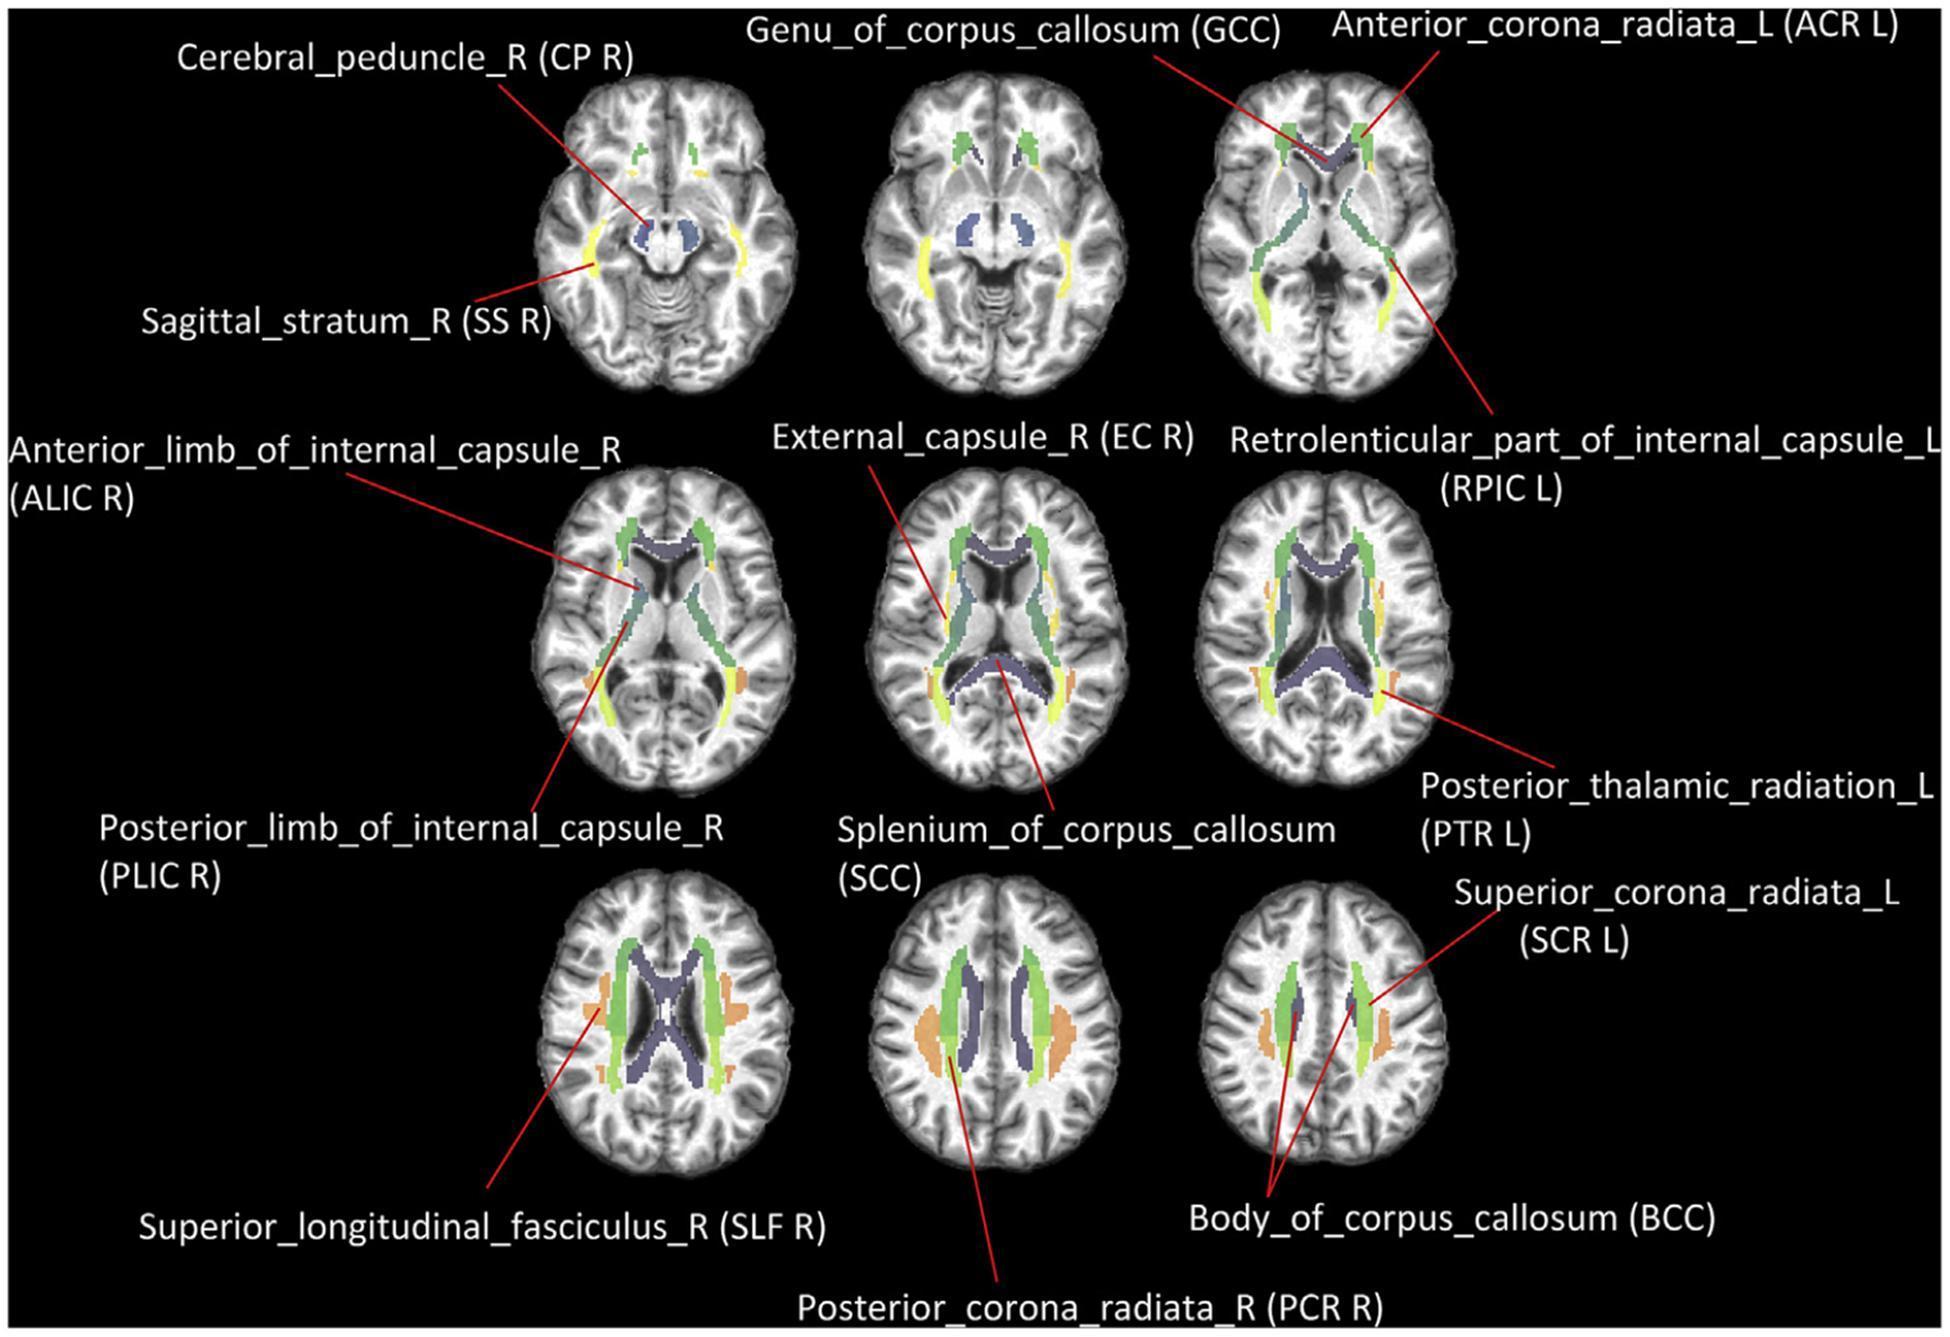
This diagnostic image provides a series of nine axial brain slices at various levels, serving as an anatomical diagram of major white matter (WM) tracts based on the JHU-MNI-ss atlas. The illustration utilizes color-coded segmentation to highlight key neuroanatomical structures within the deep white matter. Labeled structures include the commissural fibers of the corpus callosum (Genu - GCC, Body - BCC, and Splenium - SCC) and the projection fibers of the internal capsule (Anterior Limb - ALIC, Posterior Limb - PLIC, and Retrolenticular Part - RPIC). Additionally, the diagram identifies components of the corona radiata (Anterior - ACR, Superior - SCR, and Posterior - PCR) and association fibers such as the Superior Longitudinal Fasciculus (SLF) and External Capsule (EC). Other visible regions include the Cerebral Peduncle (CP), Sagittal Stratum (SS), and Posterior Thalamic Radiation (PTR). This visualization is designed for educational use in neurology and radiology to demonstrate the spatial distribution and trajectory of functional pathways connecting the cerebral cortex, subcortical nuclei, and brainstem.
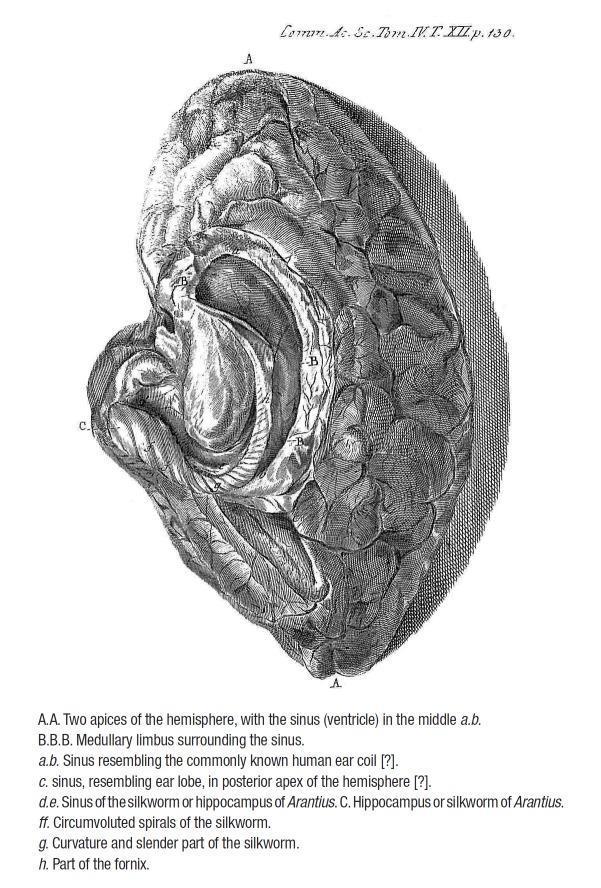
This historical anatomical diagram, identified as Duvernoy's Plate XII, depicts a detailed dissection of the human right cerebral hemisphere from a superior-lateral perspective. The illustration focuses on the internal neuroanatomy of the temporal lobe, specifically showcasing the hippocampus, historically referred to as the 'silkworm of Arantius'. Key features include the hippocampus (labeled C), displaying its characteristic curved morphology and 'circumvoluted spirals' (ff). The surrounding anatomy reveals the medullary limbus (B), parts of the fornix (h), and the ventricular space (labeled as a sinus or ventricle between apices A). The cortical surface is rendered with intricate gyri and sulci, emphasizing the textural complexity of the cerebrum. This image serves as a significant historical artifact in neuroanatomy, documenting early descriptions of the hippocampal formation and its intraventricular location. It is highly relevant for medical education focusing on the history of neuroscience, the evolution of anatomical terminology, and the spatial relationships within the limbic system.
🧠 Internal Capsule - Complete Guide
PART 1: EXPLAINED FROM ZERO
Start With the Big Picture - What is White Matter?
- Grey matter = where neurons (brain cells) live - the thinking/processing areas
- White matter = the cables (axons wrapped in myelin) that connect different grey matter regions
Simple Analogy
Where is the Internal Capsule?
- Medially (on the inside): Caudate nucleus + Thalamus
- Laterally (on the outside): Lentiform nucleus (= Putamen + Globus Pallidus)
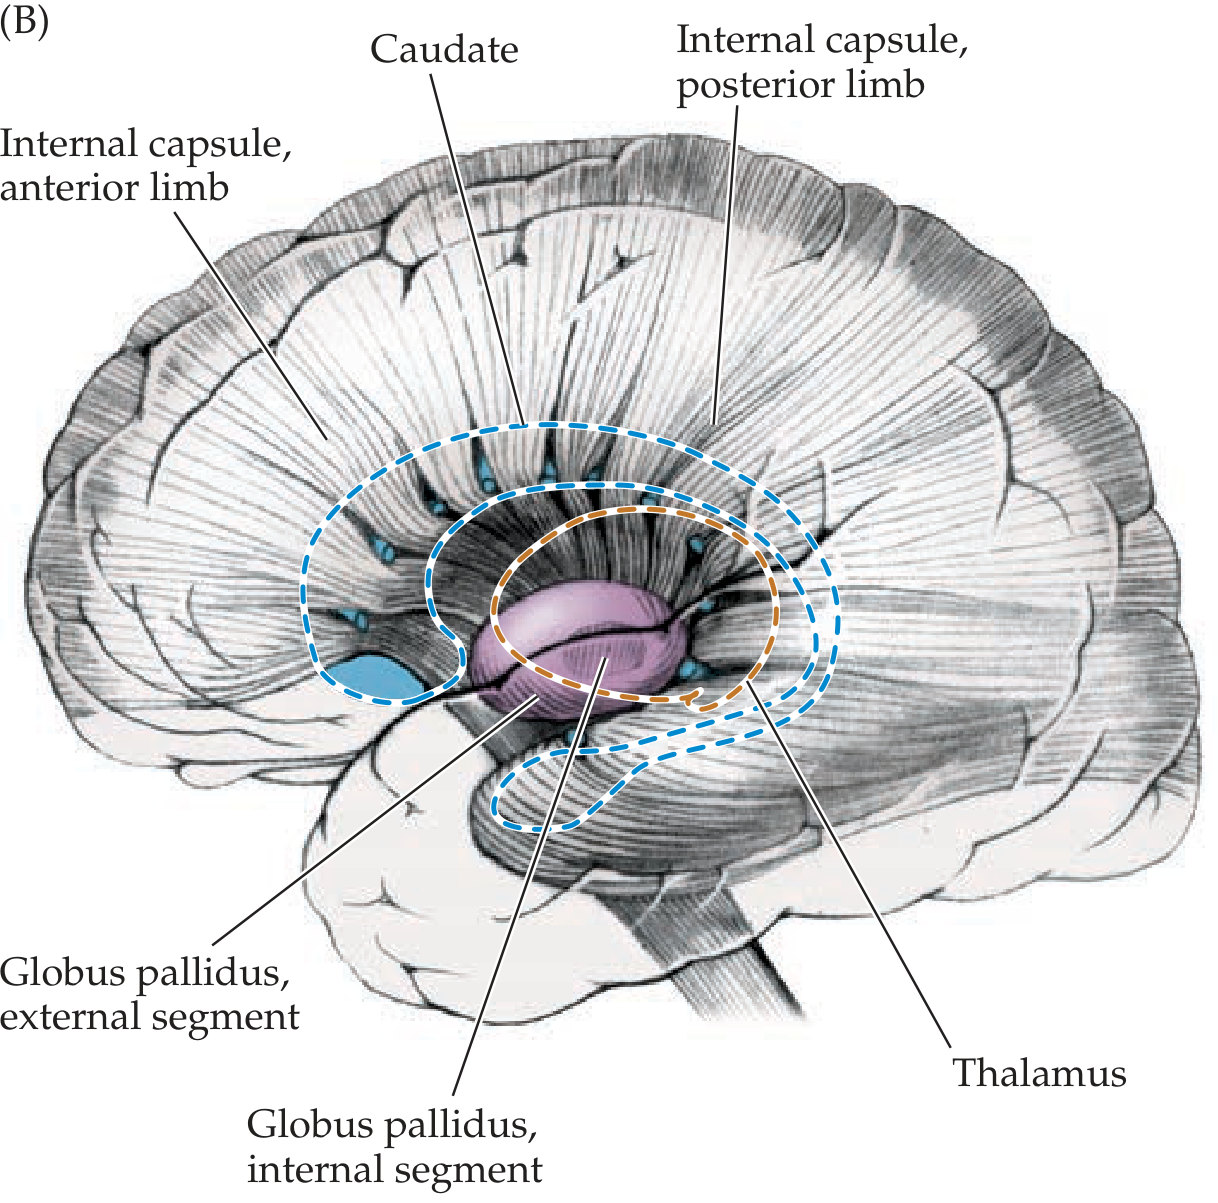
Shape - The V or Boomerang
HEAD OF CAUDATE THALAMUS
| |
ANTERIOR [limb] GENU [limb] POSTERIOR
LIMB ---------> <--------- LIMB
| (knee) |
PUTAMEN + GLOBUS PALLIDUS (laterally)
The 5 Parts of the Internal Capsule
| Part | Latin Meaning | Location | What separates it |
|---|---|---|---|
| Anterior Limb | Crus anterius | Front part of V | Caudate (medial) from Lentiform nucleus (lateral) |
| Genu | "Knee" | The bend/tip of the V | At the level of the foramen of Monro |
| Posterior Limb | Crus posterius | Back part of V | Thalamus (medial) from Lentiform nucleus (lateral) |
| Retrolenticular part | Behind the lens | Behind the lentiform nucleus | Contains optic (visual) radiations |
| Sublenticular part | Below the lens | Below the lentiform nucleus | Contains auditory radiations |
What Fibers Run Through Each Part?
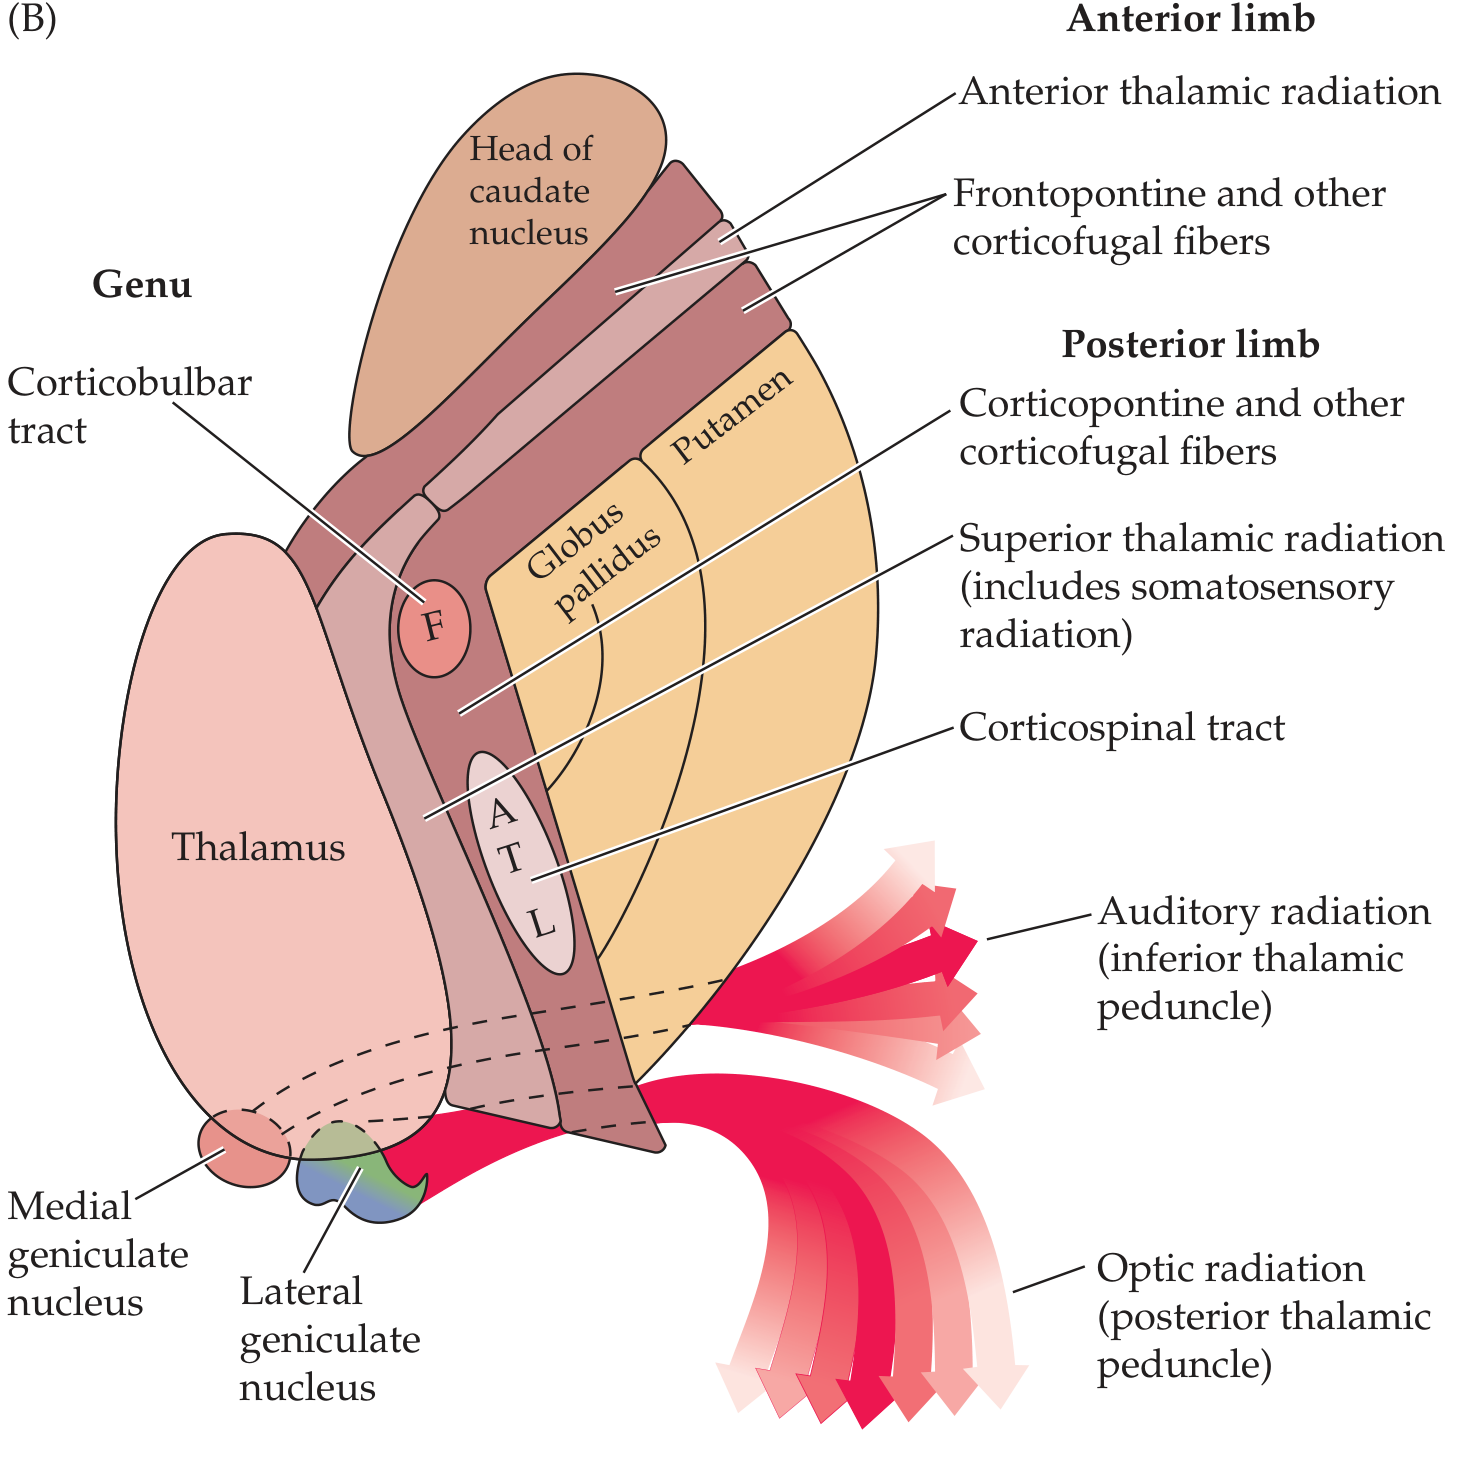
Anterior Limb:
- Frontopontine fibers (cortex → pons)
- Anterior thalamic radiation (thalamus ↔ frontal lobe)
- Caudate-putamen connecting fibers
Genu:
- Corticobulbar tract (motor cortex → cranial nerve nuclei in brainstem) - controls face, tongue, jaw movements
- Also: corticoreticular fibers
Posterior Limb:
- Corticospinal tract (motor cortex → spinal cord) - the most famous one! Controls limb movements
- Somatotopic organization: F-A-T-L from front to back = Face - Arm - Trunk - Leg
- Superior thalamic radiation = somatosensory radiation (thalamus → sensory cortex)
- Corticorubral and corticothalamic fibers
Retrolenticular Part:
- Optic radiation (visual fibers from lateral geniculate body → occipital cortex)
- Corticotectal fibers
Sublenticular Part:
- Auditory radiation (medial geniculate body → temporal cortex - Heschl's gyrus)
Continuation - Where Does it Go?
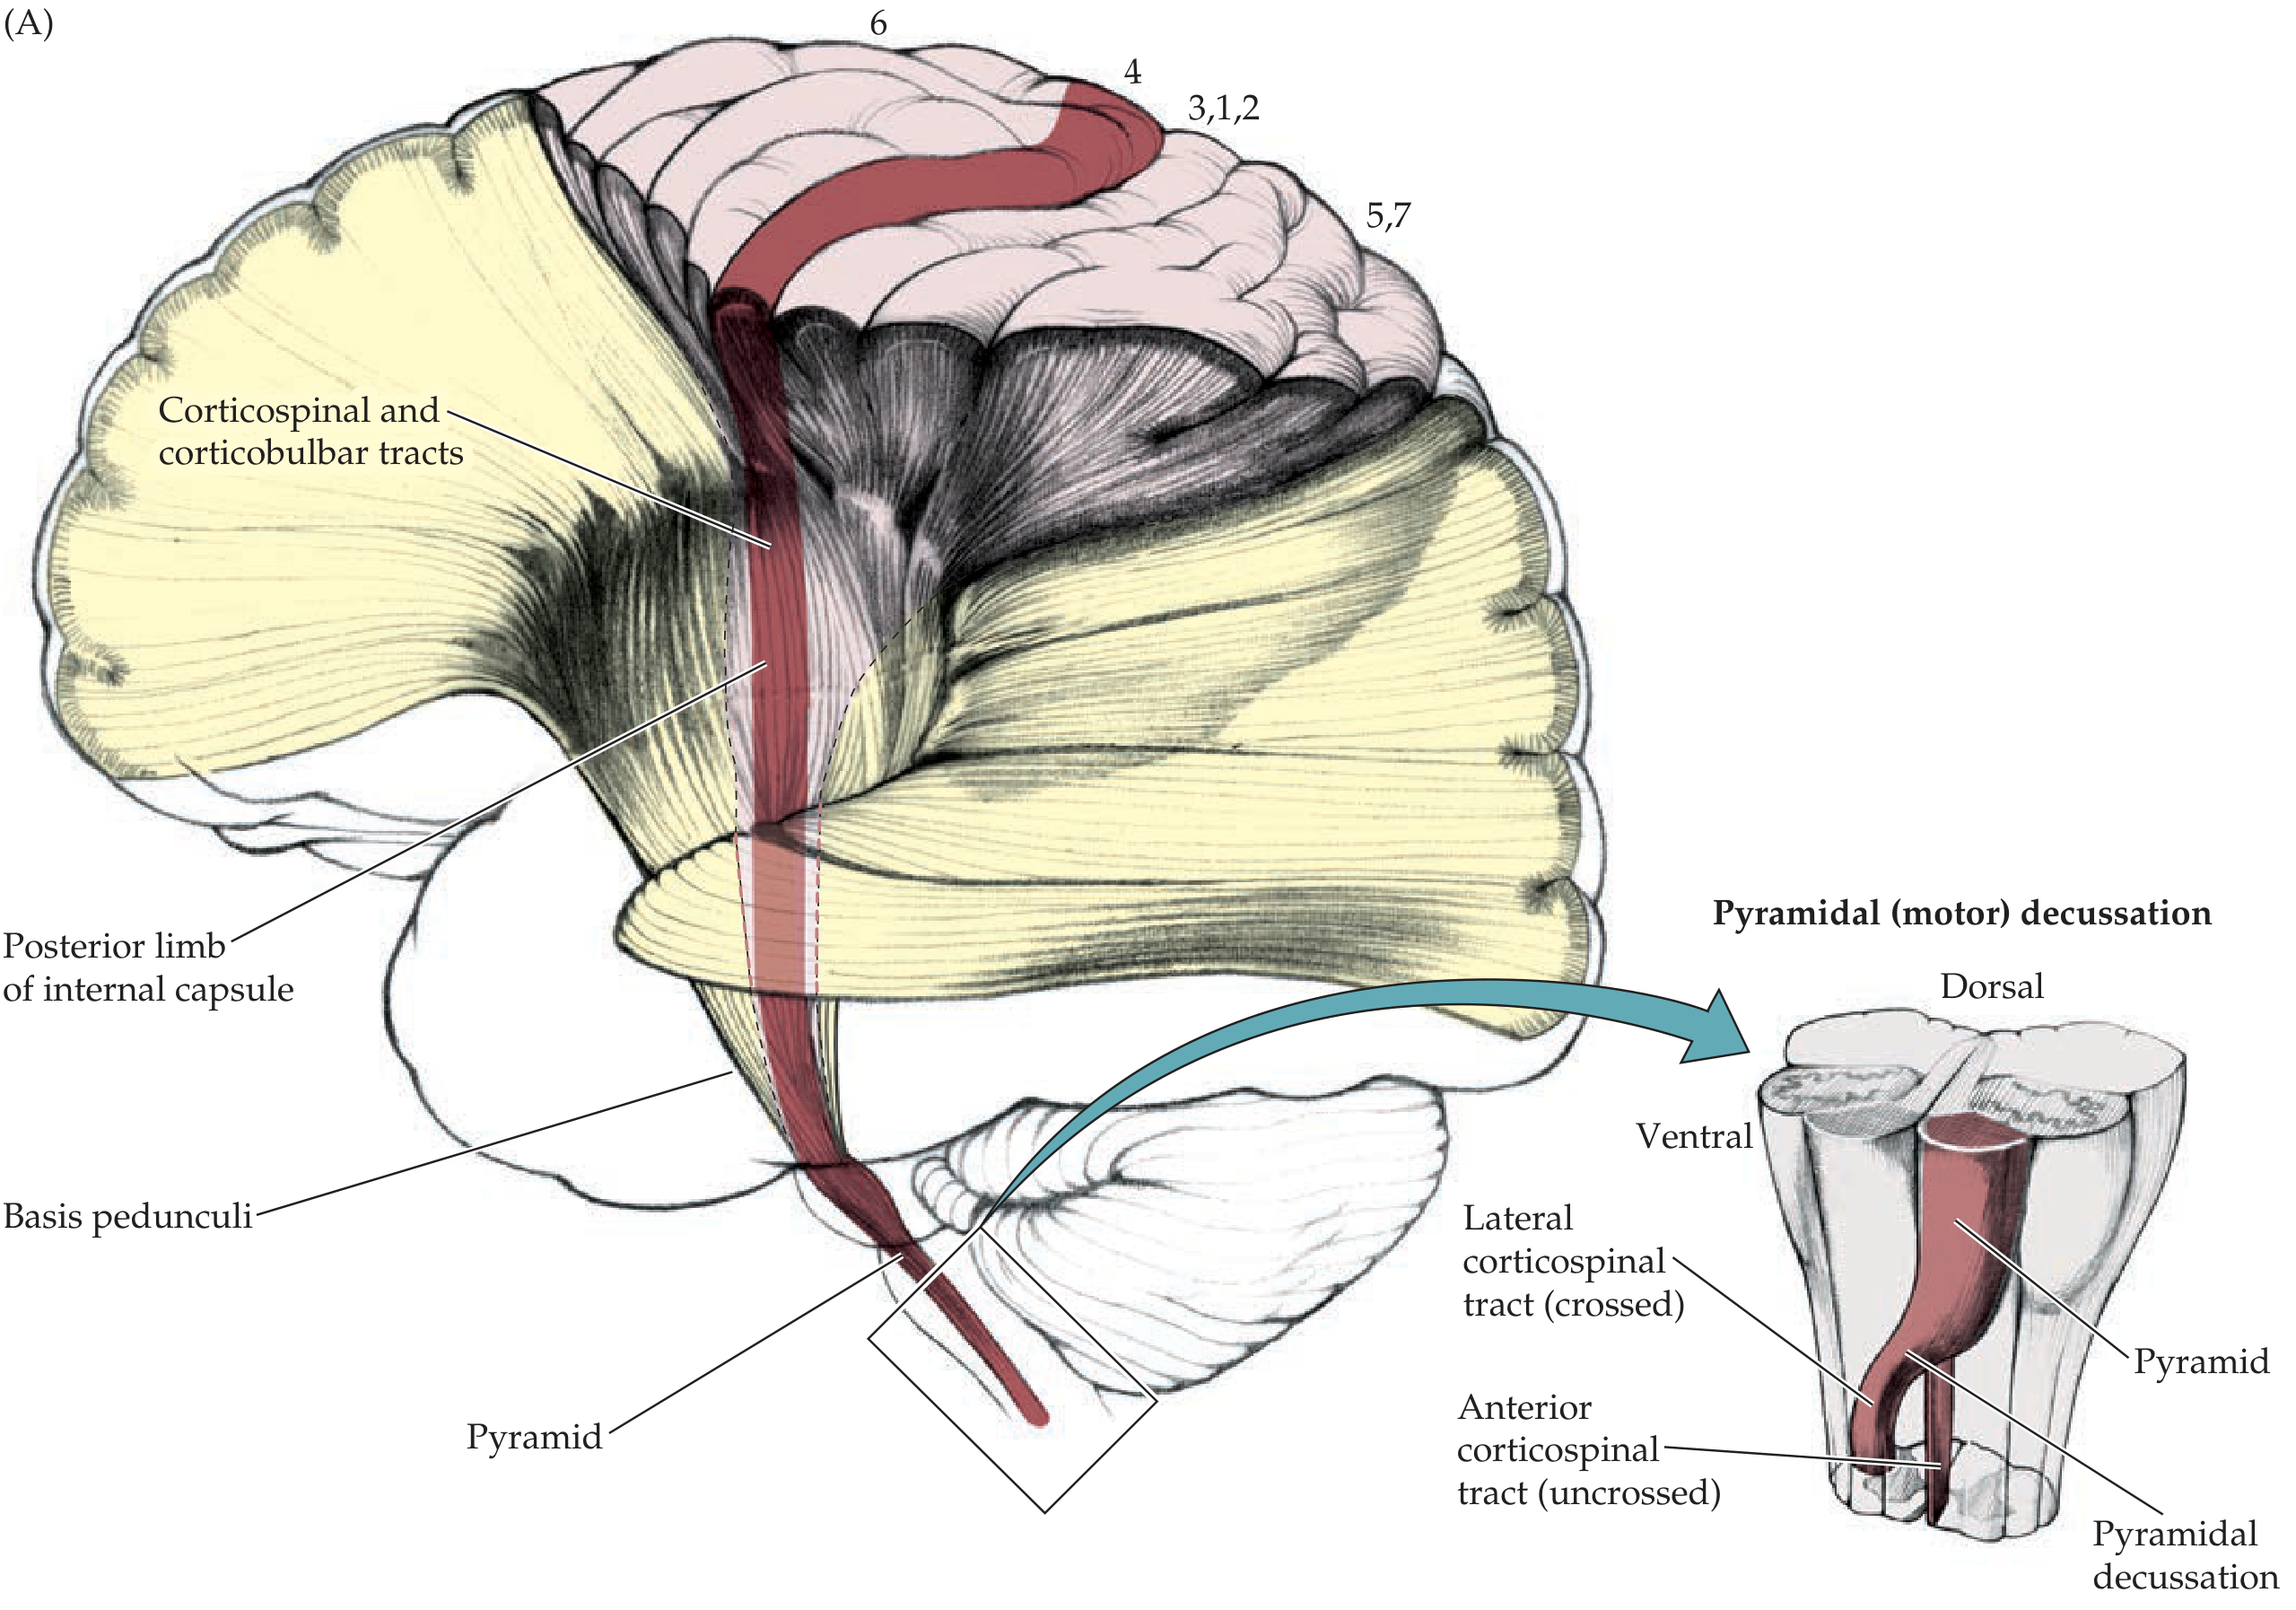
Blood Supply
| Part | Blood Supply |
|---|---|
| Anterior limb | Recurrent artery of Heubner (branch of ACA) |
| Genu + middle/inferior posterior limb | Anterior choroidal artery (branch of ICA) |
| Superior anterior + posterior limb | Lenticulostriate arteries (branches of MCA) |
The lenticulostriate arteries are called "arteries of stroke" because they are the most common site of hypertensive hemorrhagic strokes. They supply the most critical portion of the posterior limb.
Why is a Small Stroke Here So Devastating?
- All motor fibers to the face, arm, and leg on one side
- All sensory fibers from one side
- Visual fibers
PART 2: HOW TO WRITE THE 5-MARK ANSWER
✍️ Model 5-Mark Answer: Internal Capsule
- Medially: Head of caudate nucleus (anteriorly) and thalamus (posteriorly)
- Laterally: Lentiform nucleus (putamen + globus pallidus)
- On a horizontal section it appears V-shaped (concave laterally), with the genu at the apex
| Part | Key Fibres |
|---|---|
| Anterior limb | Frontopontine fibres; anterior thalamic radiation (thalamus ↔ frontal lobe) |
| Genu | Corticobulbar tract (motor cortex → cranial nerve nuclei - controls face, tongue) |
| Posterior limb | Corticospinal tract (motor cortex → spinal cord); superior thalamic/somatosensory radiation; somatotopy: Face → Arm → Trunk → Leg (anterior to posterior) |
| Retrolenticular part | Optic radiation (lateral geniculate nucleus → occipital cortex) |
| Sublenticular part | Auditory radiation (medial geniculate nucleus → temporal cortex) |
- Anterior limb: Recurrent artery of Heubner (branch of ACA)
- Genu and posterior limb (inferior/middle): Anterior choroidal artery (branch of ICA)
- Posterior limb (superior) and anterior limb (superior): Lenticulostriate arteries (branches of MCA)
- Capsular stroke - occlusion of lenticulostriate arteries (hypertensive stroke - "arteries of stroke") causes contralateral hemiplegia, hemisensory loss, and hemianopia
- Pure motor stroke - small lacunar infarct in posterior limb causes contralateral hemiplegia without sensory loss
- Genu lesion - contralateral lower facial palsy and dysarthria (corticobulbar involvement)
- Posterior limb - somatotopic organization explains which body part is worst affected depending on exact lesion location
- Retrolenticular lesion - contralateral homonymous hemianopia (optic radiation involvement)
🔑 Quick Recall Mnemonic for Posterior Limb Somatotopy:
Quick Revision Table
| Part | Fibre | Clinical if damaged |
|---|---|---|
| Anterior limb | Frontopontine + thalamic | Cognitive/frontal changes |
| Genu | Corticobulbar | Contralateral UMN facial palsy, dysarthria |
| Posterior limb | Corticospinal (FATL) | Contralateral hemiplegia |
| Posterior limb | Somatosensory radiation | Contralateral hemisensory loss |
| Retrolenticular | Optic radiation | Contralateral homonymous hemianopia |
| Sublenticular | Auditory radiation | Contralateral auditory deficits |
Third ventricle
third ventricle anatomy walls floor roof boundaries labeled diagram
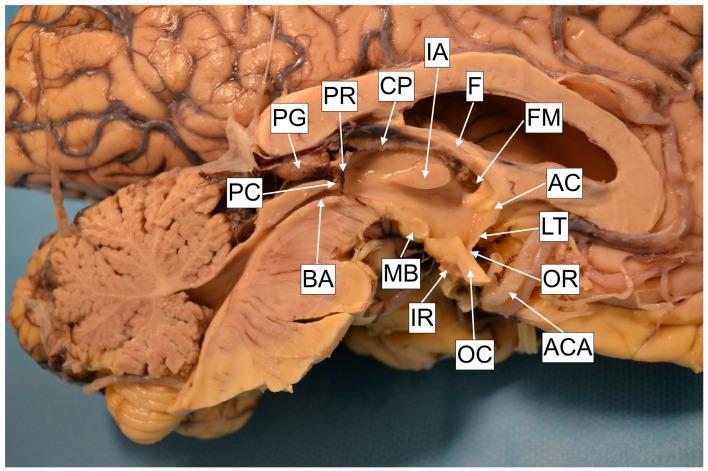
A high-resolution anatomical dissection of a human cadaver brain specimen in a sagittal section, focused on the micro-anatomy of the third ventricle and surrounding diencephalic structures. The image shows the internal walls and landmarks essential for neurosurgical procedures like endoscopic third ventriculostomy (ETV). Key labeled structures include the anterior commissure (AC) and lamina terminalis (LT) forming the anterior wall, and the optic recess (OR) and infundibular recess (IR) along the floor. Posteriorly, the mamillary body (MB), brain aqueduct (BA), posterior commissure (PC), and pineal gland (PG) with its recess (PR) are visible. Superiorly, the foramen of Monro (FM) connects to the lateral ventricle, bordered by the fornix (F) and choroid plexus (CP). The interthalamic adhesion (IA) is noted centrally. Vascular proximity is demonstrated by the anterior cerebral artery (ACA) near the optic chiasm (OC). The cerebellum and brainstem are also partially visible, providing anatomical context for the midline ventricular system.
This composite educational resource illustrates the endoscopic management of intraventricular hemorrhage (IVH) via transaqueductal navigation. (a) A sagittal anatomical diagram depicts the trajectory of a flexible neuroendoscope from a precoronal burr hole through the lateral and third ventricles into the fourth ventricle. (b) An intraoperative endoscopic image shows the internal anatomy of the cerebral aqueduct, identifying the floor (fc), ampulla (am), and second constriction (sc). A prominent blood clot (*) is visible obstructing the distal egressus of the aqueduct near the posterior commissure (pc). (c) A subsequent intraoperative view demonstrates the inferior triangle of the fourth ventricle post-aspiration. Key landmarks include the choroid plexus (chp) on the ventricular roof and the canalis centralis medullaris at the calamus scriptorius (arrow). Residual blood clots (bc) are noted obstructing the foramen of Magendie. This visual sequence highlights the surgical approach to restoring cerebrospinal fluid (CSF) pathway patency in cases of obstructive hydrocephalus caused by hemorrhage.
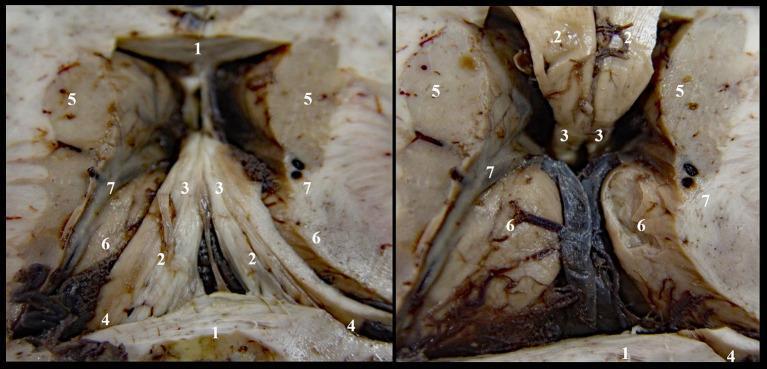
Anatomical Diagram/Clinical Photograph. This dual-panel image shows a high-magnification superior view of a human brain dissection, specifically focused on the neuroanatomical structures forming the roof of the third ventricle (Stage I denudation). Panel A (left) and Panel B (right) provide sequential perspectives of the deep cerebral anatomy. Key identified structures include: (1) the corpus callosum, (2) the body of the fornix, (3) the anterior pillars of the fornix, and (4) the posterior pillars of the fornix. The spatial relationship between the limbic system and basal ganglia is demonstrated by the lateral positioning of the (5) caudate nucleus and (6) thalamic nuclei relative to the midline fornix. Vascular and transitional markers (7) illustrate the optostriat sulcus and vein, lamina affixa, and tenia semicircularis. The dissection highlights the convergence of the fornix pillars towards the midline and their relationship to the superior surface of the thalamus, providing critical context for neurosurgical approaches to the third ventricle and understanding the complex white matter tracts in the periventricular region.
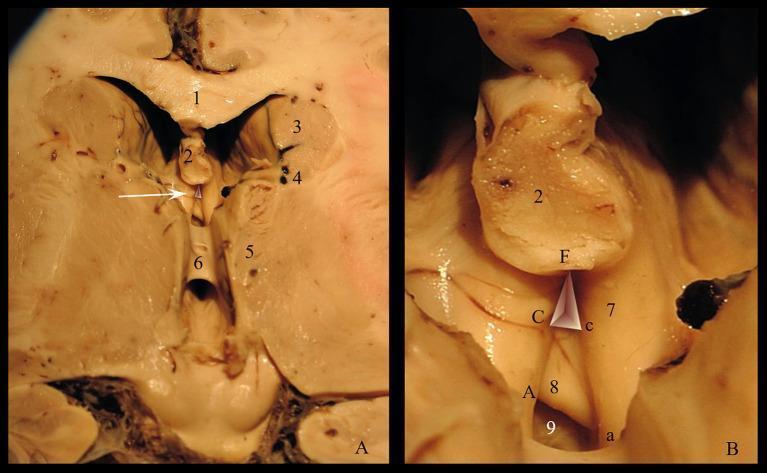
This composite of two clinical photographs displays a neuroanatomical dissection of the human brain, focusing on the roof of the third ventricle and the triangular recess. Image A provides a superior view of the ventricular space and surrounding landmarks, including the corpus callosum superiorly, the fornix, the caudate nucleus, and the thalamus lateral to the midline. An arrow highlights the triangular recess, showing its relation to the interthalamic adhesion and optostriat sulcus. Image B offers a high-magnification view detailing the morphometric parameters of the triangular recess, categorized into the pars profunda and pars superficialis. The anatomical boundaries are delineated by the anterior crus of the fornix, the commissura rostralis, and the lamina terminalis. The image demonstrates the spatial arrangement of the recessus subcommissuralis and the structural base and walls (Cc, FC, Fc; Aa, FA, Fa) that define this clinical space. This content is intended for advanced neuroanatomical education, specifically for understanding ventricular surgery pathways and deep brain anatomy.
third ventricle sagittal section recesses optic infundibular pineal suprapineal
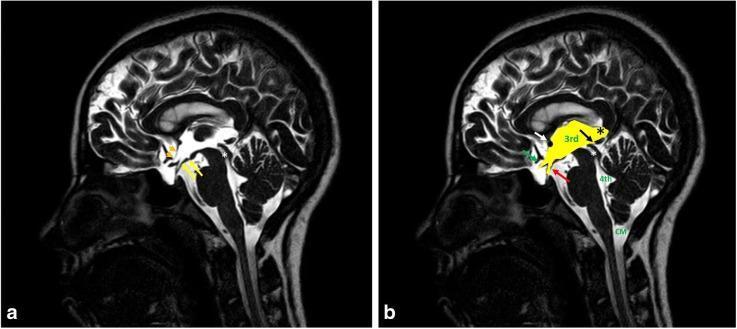
This diagnostic image consists of two sagittal midline high-resolution heavily T2-weighted MRI scans (3D-DRIVE sequence) of a 12-year-old male, illustrating normal ventricular and cisternal anatomy. Image (b) is annotated to highlight the cerebrospinal fluid (CSF) pathways, which appear hyperintense (bright white). Key structures identified include the third ventricle (3rd) with its concave floor (yellow arrows), the lamina terminalis forming the anterior border (orange arrowheads), and several functional recesses: the chiasmatic recess (green arrow), infundibular recess (red arrow), pineal recess (black arrow), and suprapineal recess (black asterisk). The anterior commissure is marked by a white arrow. The CSF pathway continues through the narrow aqueduct of Sylvius (white asterisk) into the fourth ventricle (4th), located dorsal to the pons. The cisterna magna (CM) is visible posterior to the medulla and cerebellum. This imaging modality is essential in pediatric neuro-radiology for evaluating hydrocephalus, aqueductal stenosis, and CSF flow dynamics by providing superior contrast between liquid CSF and neural parenchyma.
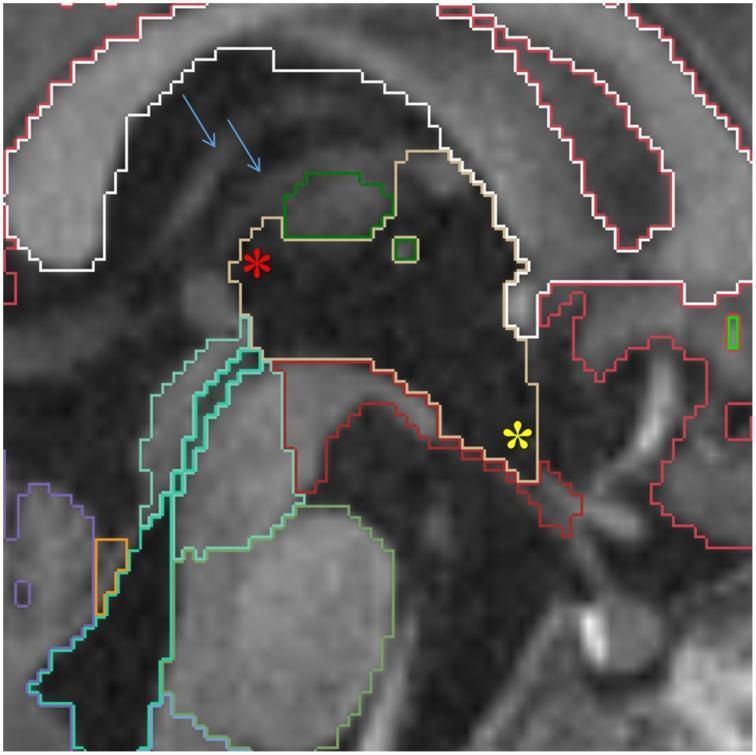
This diagnostic image is a T1-weighted sagittal MRI of an infant's brain, focusing on the neuroanatomical segmentation of the midline structures. The third ventricle is centrally featured and outlined in yellow, showing key anatomical landmarks: the suprapineal recess (indicated by a red star) and the infundibular recess (indicated by a yellow star). Blue arrows point to the internal cerebral veins situated within the transverse fissure, which serves as the posterior boundary for third ventricle segmentation. Various color-coded outlines delineate surrounding regions: white matter (white), cerebral cortex (red), ventral diencephalon (VDC, dark red), mesencephalon (turquoise), pons (green), and medulla (baby blue). The fourth ventricle and cerebral aqueduct are highlighted in lime green, while the cerebellar vermis is outlined in violet. This image serves as a detailed educational tool for manual segmentation protocols in pediatric neuroimaging, emphasizing the spatial relationships between ventricular recesses and deep vascular landmarks.
A high-resolution anatomical dissection of a human cadaver brain specimen in a sagittal section, focused on the micro-anatomy of the third ventricle and surrounding diencephalic structures. The image shows the internal walls and landmarks essential for neurosurgical procedures like endoscopic third ventriculostomy (ETV). Key labeled structures include the anterior commissure (AC) and lamina terminalis (LT) forming the anterior wall, and the optic recess (OR) and infundibular recess (IR) along the floor. Posteriorly, the mamillary body (MB), brain aqueduct (BA), posterior commissure (PC), and pineal gland (PG) with its recess (PR) are visible. Superiorly, the foramen of Monro (FM) connects to the lateral ventricle, bordered by the fornix (F) and choroid plexus (CP). The interthalamic adhesion (IA) is noted centrally. Vascular proximity is demonstrated by the anterior cerebral artery (ACA) near the optic chiasm (OC). The cerebellum and brainstem are also partially visible, providing anatomical context for the midline ventricular system.
🧠 Third Ventricle - Complete Guide
PART 1: EXPLAINED FROM ZERO
Quick Recap - What Are Ventricles?
The Ventricular Chain (Top to Bottom)
Lateral Ventricles (×2) — in the cerebral hemispheres
↓ (via Foramina of Monro)
THIRD VENTRICLE ← we are here today
↓ (via Cerebral Aqueduct)
Fourth Ventricle
↓ (via Foramina of Magendie & Luschka)
Subarachnoid Space
What is the Third Ventricle?
Location
- Situated in the midline of the brain
- Lies in the diencephalon
- Surrounded on both sides by the thalamus (upper) and hypothalamus (lower)
- Connects above to the two lateral ventricles via the Foramina of Monro (interventricular foramina)
- Connects below-posteriorly to the fourth ventricle via the Cerebral Aqueduct (of Sylvius)
Walls (Boundaries) - The Most Important Part
🔴 Lateral Walls (×2 - one on each side):
- Upper part: Medial surface of the Thalamus
- Lower part: Hypothalamus
- Separated from each other by a groove called the hypothalamic sulcus (of Monro)
- The two thalami often touch in the middle, forming a grey matter bridge called the Massa Intermedia (Interthalamic Adhesion) - note: this is NOT a real nerve connection, just a touch point
🟢 Anterior Wall:
- Lamina terminalis (a thin membrane - the most anterior part of the brain)
- Anterior commissure (just above the lamina terminalis - a white matter bundle)
- Column of fornix (on each side)
🔵 Posterior Wall:
- Posterior commissure (superiorly)
- Habenular commissure
- Opening into the cerebral aqueduct (inferiorly)
- Pineal gland (sits just behind, between the two commissures)
⬆️ Roof (Superior Wall):
- Tela choroidea of the third ventricle (a thin fold of pia mater)
- Contains the choroid plexus of the third ventricle (which produces CSF)
- Bounded above by the body of the fornix and corpus callosum
⬇️ Floor (Inferior Wall):
- Optic chiasma (where optic nerves cross)
- Tuber cinereum (hypothalamic grey matter)
- Infundibulum (pituitary stalk - connects to pituitary gland)
- Mammillary bodies
- Posterior perforated substance
- Tegmentum of midbrain (just before the aqueduct)
Recesses - The Pouches
| Recess | Location | What it points toward |
|---|---|---|
| Optic recess | Anterior - above the optic chiasma | Points toward optic chiasma |
| Infundibular recess | Anterior - inside the infundibular stalk | Points down into pituitary stalk |
| Pineal recess | Posterior - between the two pineal commissures | Points into the pineal gland |
| Suprapineal recess | Posterior - above the pineal body | Points backward above pineal |
Memory tip: "Old Italian People Sleep" = Optic, Infundibular, Pineal, Suprapineal (front to back)
The Foramen of Monro (Interventricular Foramen)
- Anterosuperiorly: Column of the fornix
- Posteroinferiorly: Anterior pole of the thalamus
- Inferiorly: Anterior commissure
Blood Supply
- Anterior part: Anterior communicating artery perforators, recurrent artery of Heubner
- Posterior part: Posterior communicating artery, posterior choroidal arteries
- Choroid plexus: Internal cerebral veins drain this region
Clinical Significance
| Condition | How Third Ventricle is Involved |
|---|---|
| Colloid cyst | Grows at the foramen of Monro - blocks CSF drainage → sudden acute hydrocephalus, "drop attacks", sudden death |
| Craniopharyngioma | Arises near the floor/anterior wall; compresses optic chiasma (bitemporal hemianopia) and hypothalamus |
| Pinealoma | Grows into posterior wall; compresses cerebral aqueduct → hydrocephalus + Parinaud syndrome (upward gaze palsy) |
| Hydrocephalus | Any blockage at foramen of Monro or aqueduct causes third ventricle enlargement |
| Hypothalamic tumors | Disrupt floor → diabetes insipidus, temperature dysregulation, obesity |
PART 2: HOW TO WRITE THE 5-MARK ANSWER
✍️ Model 5-Mark Answer: Third Ventricle
| Wall | Structures |
|---|---|
| Lateral (×2) | Upper: thalamus; Lower: hypothalamus; separated by hypothalamic sulcus |
| Anterior | Lamina terminalis, anterior commissure, columns of the fornix |
| Posterior | Posterior commissure (superiorly), habenular commissure, opening of cerebral aqueduct (inferiorly) |
| Roof | Tela choroidea (with choroid plexus); bounded above by fornix and corpus callosum |
| Floor | From front to back: optic chiasma → tuber cinereum → infundibulum (pituitary stalk) → mammillary bodies → posterior perforated substance → tegmentum of midbrain |
- Optic recess - above the optic chiasma (anteriorly)
- Infundibular recess - into the infundibular stalk
- Pineal recess - between habenular and posterior commissures
- Suprapineal recess - above the pineal body (posteriorly)
- Massa intermedia (interthalamic adhesion): A non-functional grey matter bridge connecting the two thalami across the cavity; present in ~70% of individuals
- Choroid plexus: Present in the roof; produces CSF
- Foramina of Monro: Bounded by the column of fornix anteriorly and thalamus posteriorly
- Colloid cyst at the foramen of Monro - most common benign tumor of the third ventricle; causes acute obstructive hydrocephalus with positional headache, "drop attacks," and sudden death
- Craniopharyngioma - arises near floor/anterior wall; bitemporal hemianopia + hypopituitarism
- Pineal region tumors - compress posterior wall/aqueduct → obstructive hydrocephalus + Parinaud syndrome
- Hydrocephalus - dilatation of the third ventricle (with widening of recesses, especially optic and infundibular) is an early sign
🔑 Floor Mnemonic (Anterior → Posterior):
Quick Revision Summary
| Feature | Detail |
|---|---|
| Shape | Narrow slit (midline) |
| Located in | Diencephalon |
| Communicates above | Foramina of Monro → Lateral ventricles |
| Communicates below | Cerebral aqueduct → Fourth ventricle |
| Lateral walls | Thalamus (upper) + Hypothalamus (lower) |
| Anterior wall | Lamina terminalis + Anterior commissure |
| Posterior wall | Posterior commissure + Pineal region |
| Floor | Optic chiasma, Infundibulum, Mammillary bodies |
| Roof | Tela choroidea + Choroid plexus |
| Recesses | Optic, Infundibular, Pineal, Suprapineal |
| Key clinical | Colloid cyst (foramen of Monro), Craniopharyngioma, Pinealoma |
Nuclei of thalamus
thalamic nuclei labeled diagram groups anterior ventral posterior medial
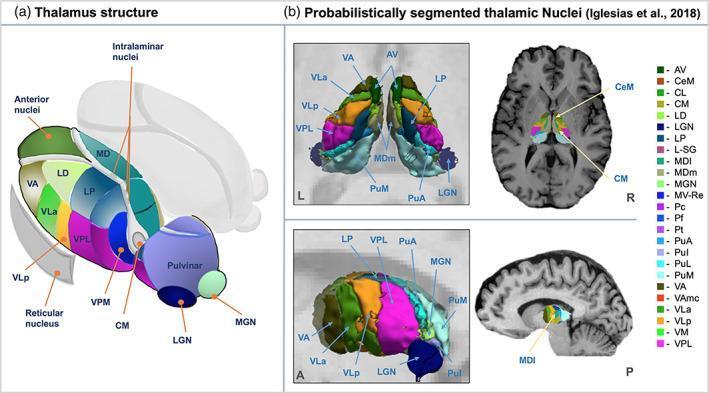
This composite educational graphic details the neuroanatomy and neuroimaging parcellation of the human thalamic nuclei. Panel (a) presents a color-coded anatomical diagram illustrating the three-dimensional spatial organization of thalamic sub-regions. Key groups identified include the anterior nuclei, intralaminar nuclei (including the centromedian nucleus, CM), and lateral/posterior groups such as the pulvinar, lateral geniculate nucleus (LGN), and medial geniculate nucleus (MGN). Specific nuclei labeled include the mediodorsal (MD), ventral anterior (VA), ventrolateral (VLa, VLp), and ventroposterior (VPL, VPM) nuclei. Panel (b) demonstrates clinical diagnostic applications through probabilistic segmentation using MRI data. Axial and sagittal views show high-resolution T1-weighted imaging with overlaid colored masks identifying individual nuclei such as the AV, LP, and CeM. This visualization highlights the use of Bayesian inference and histological atlases (e.g., FreeSurfer algorithms) to achieve precise anatomical localization in vivo. The graphic serves as a guide for neuroradiology, neurosurgery planning, and functional connectivity research involving thalamocortical pathways.
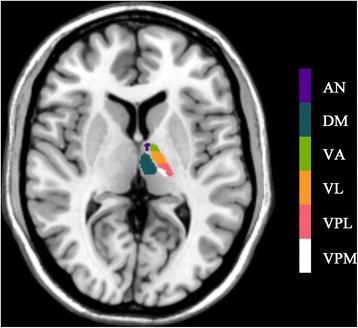
This diagnostic neuroimaging illustration features an axial T1-weighted Magnetic Resonance Imaging (MRI) slice of a human brain at the level of the basal ganglia and thalamus. The image serves as an anatomical diagram utilizing color-coded overlays to delineate standard thalamic subnuclei based on the Talairach template. Labeled subregions on the right thalamus include the Anterior Nucleus (AN) in purple, the Dorsomedial Nucleus (DM) in dark blue, the Ventral Anterior Nucleus (VA) in light green, the Ventral Lateral Nucleus (VL) in orange, the Ventral Posterior Lateral Nucleus (VPL) in pink, and the Ventral Posterior Medial Nucleus (VPM) in white. The spatial arrangement demonstrates the anteroposterior and mediolateral organization of these nuclei, illustrating the complex internal architecture of the thalamus. This visual resource is designed for advanced neuroanatomical education and radiologic training, highlighting specific functional zones within the diencephalon that are critical for sensory relay, motor integration, and limbic processing.
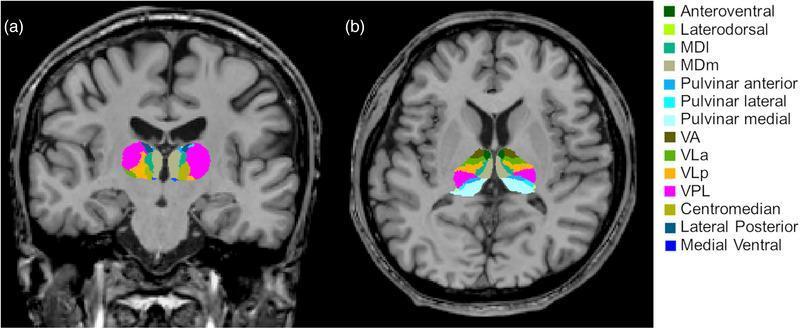
Diagnostic neuroimaging featuring automated segmentation of thalamic nuclei in a patient with epilepsy. The figure displays T1-weighted MRI scans in the coronal (a) and axial (b) planes, with color-coded overlays identifying specific thalamic subregions. Key segmented nuclei include the Ventral Posterolateral (VPL, magenta), Ventral Lateral posterior (VLp, orange), Ventral Lateral anterior (VLa, light green), and Ventral Anterior (VA, dark green) nuclei. The medial groups, including the Mediodorsal lateral parvocellular (MDl) and Mediodorsal medial magnocellular (MDm) nuclei, are positioned near the midline. In the axial view, the posterior Pulvinar complex (anterior, lateral, and medial) is clearly demarcated. The image demonstrates the internal structural organization of the thalamus, highlighting the spatial relationships and morphological boundaries of individual nuclei within the diencephalon. This visualization is characteristic of neuroimaging post-processing used for volumetric analysis in clinical research and surgical planning for neurological disorders such as epilepsy.
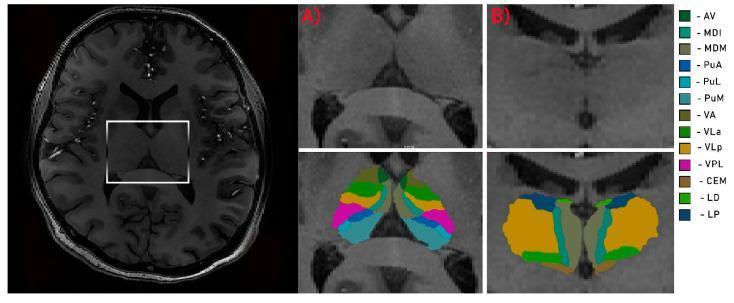
This diagnostic image and anatomical diagram illustrate the detailed segmentation of human thalamic nuclei using high-resolution neuroimaging. The visual includes an axial T1-weighted MRI scout view showing the diencephalon, with a white box highlighting the thalamus. Panels A and B display magnified axial and coronal cross-sections, respectively, with bottom panels featuring color-coded probabilistic segmentation overlays. Key identified nuclei include the anteroventral (AV), mediodorsal (MDI, MDM), pulvinar (PuA, PuL, PuM), ventral anterior (VA), ventral lateral (VLa, VLp), ventral posterolateral (VPL), central medial (CEM), laterodorsal (LD), and lateral posterior (LP) regions. The segmentation demonstrates the spatial organization of the thalamus, such as the posterior positioning of the pulvinar nuclei and the lateral arrangement of the ventral posterior complex. This material serves as an educational resource for neuroanatomy, neuroradiology, and computational neuroscience, specifically regarding the localization of specific thalamic functional zones in clinical research such as 7T MRI volumetric studies.
🧠 Nuclei of the Thalamus - Complete Guide
PART 1: EXPLAINED FROM ZERO
What is the Thalamus First?
How is the Thalamus Divided?
ANTERIOR GROUP
|
________/ \________
| (Y-shaped |
MEDIAL lamina) LATERAL
GROUP GROUP
|___________________|
(below)
INTRALAMINAR nuclei
(inside the Y)
The Groups and Their Nuclei
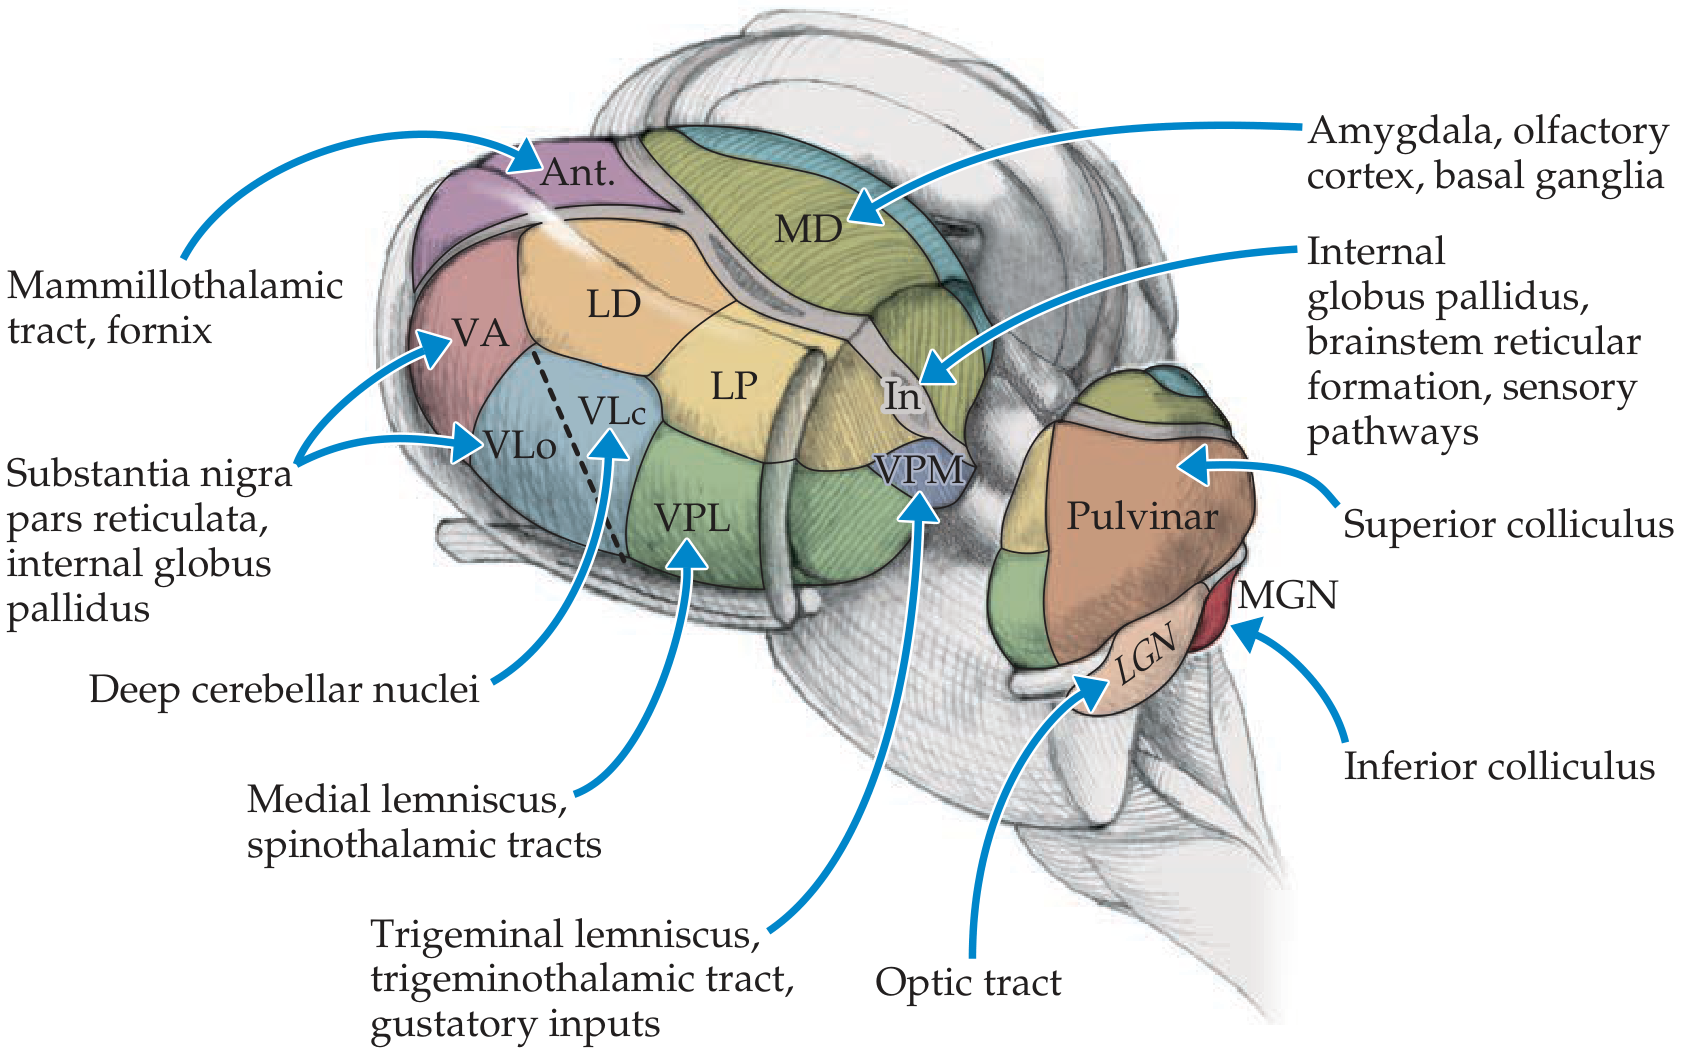
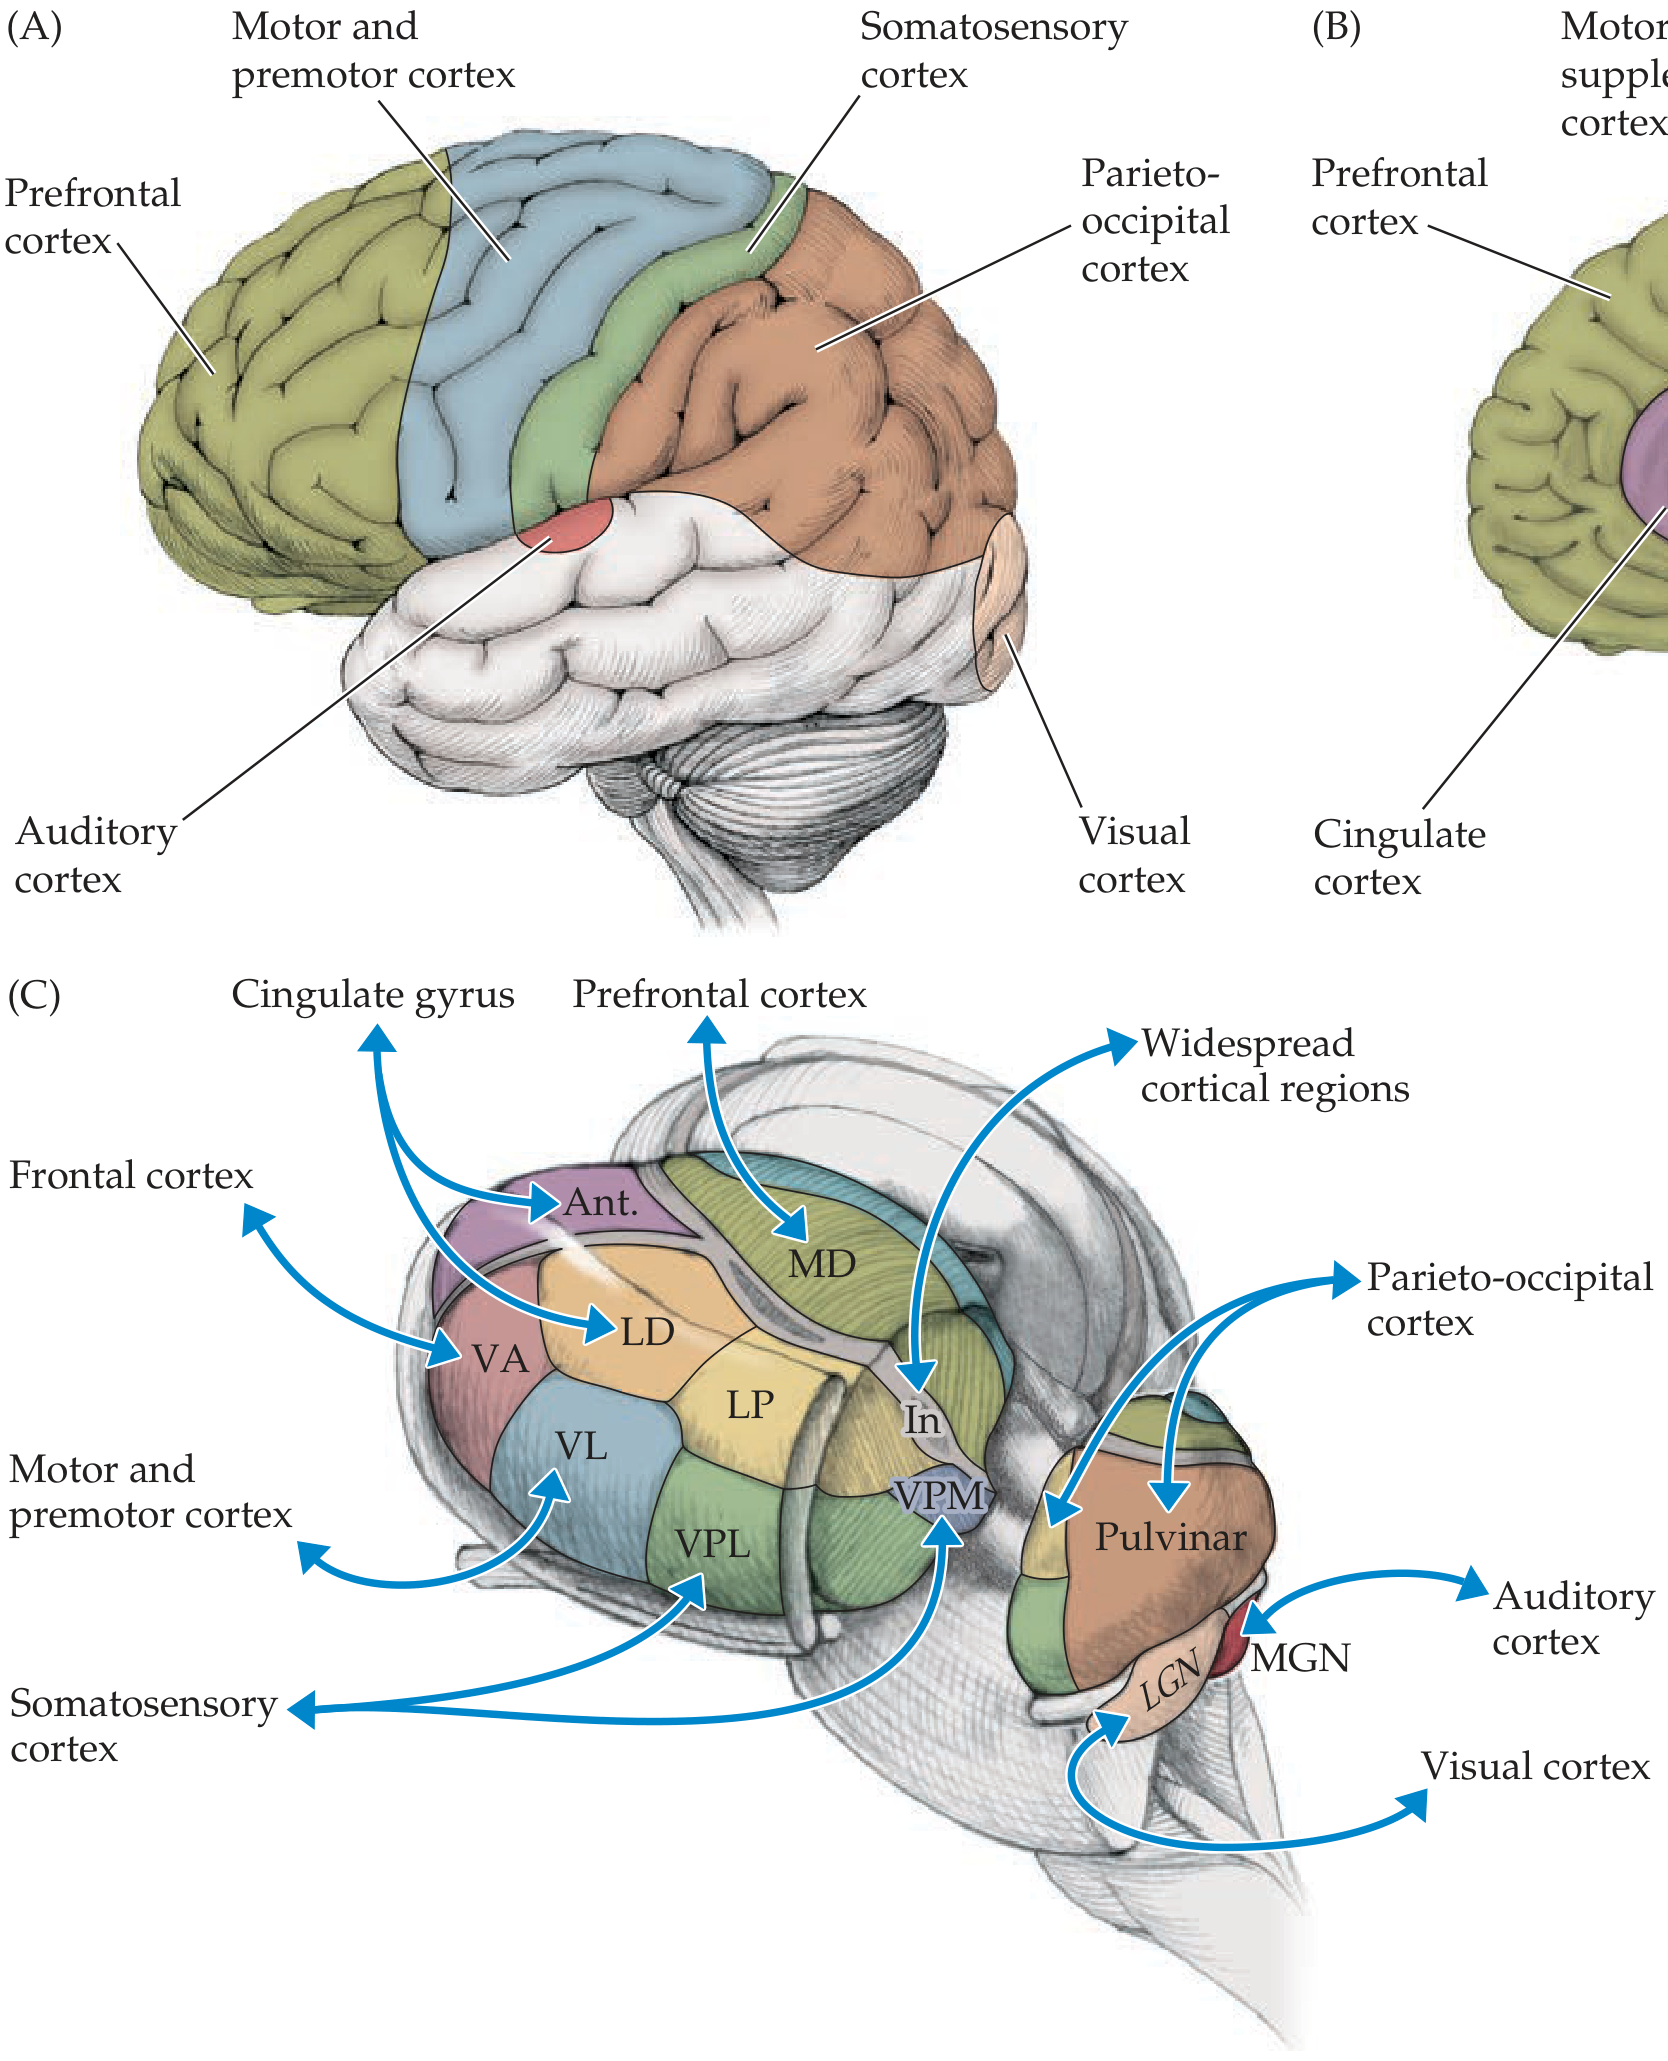
Group by Group - Learn Each One
1. 🟣 ANTERIOR NUCLEAR GROUP
| Feature | Detail |
|---|---|
| Input | Mammillary bodies (via mammillothalamic tract), hippocampal formation |
| Output | Cingulate gyrus |
| Function | Limbic system relay - memory and emotion |
| Part of | Papez circuit (memory circuit) |
Think: "Anterior = Amnesia circuit" - lesion here causes memory problems
2. 🟢 MEDIAL GROUP
| Feature | Detail |
|---|---|
| Input | Amygdala, olfactory cortex, limbic basal ganglia |
| Output | Prefrontal cortex (frontal lobe) |
| Function | Major relay to frontal association cortex; emotions, judgment, behavior |
Think: "Mediodorsal = Mental/frontal functions" - the frontal lobe's thalamic relay
3. 🔵 LATERAL GROUP
A) DORSAL TIER (top row, front to back):
| Nucleus | Key connections | Function |
|---|---|---|
| Lateral Dorsal (LD) | Similar to anterior nucleus | Functions with anterior nuclei (limbic) |
| Lateral Posterior (LP) | Similar to pulvinar | Functions with pulvinar (association) |
| Pulvinar | Superior colliculus → Parietotemporo-occipital cortex | Behavioral orientation to visual/other stimuli; largest thalamic nucleus |
B) VENTRAL TIER (bottom row, front to back) - THE MOST IMPORTANT:
| Nucleus | Abbreviation | Input | Output | Function |
|---|---|---|---|---|
| Ventral Anterior | VA | Substantia nigra, internal globus pallidus, deep cerebellar nuclei | Motor, premotor, supplementary motor cortex | Relays basal ganglia and cerebellar signals to motor cortex |
| Ventral Lateral | VL | Internal globus pallidus, deep cerebellar nuclei | Motor and premotor cortex | Relays cerebellar and basal ganglia output to motor cortex |
| Ventral Posterior Lateral | VPL | Medial lemniscus + Spinothalamic tract (body) | Primary somatosensory cortex (postcentral gyrus) | Somatosensory relay for the BODY |
| Ventral Posterior Medial | VPM | Trigeminal lemniscus + taste inputs (FACE) | Primary somatosensory and taste cortex | Somatosensory relay for the FACE and TASTE |
VPL vs VPM Memory Trick: "VPL = Legs and body (Lateral = body from below the face)" "VPM = Mouth/Face (Medial = face and mouth)"
4. 🟡 POSTERIOR GROUP - Geniculate Bodies
| Nucleus | Abbreviation | Input | Output | Function |
|---|---|---|---|---|
| Lateral Geniculate Nucleus | LGN | Optic tract (from retina) | Primary visual cortex (calcarine cortex, V1) | Visual relay |
| Medial Geniculate Nucleus | MGN | Inferior colliculus | Primary auditory cortex (Heschl's gyrus) | Auditory relay |
LGN vs MGN Memory Trick: "Lateral = Light (vision)" "Medial = Music (hearing)"
5. 🟠 INTRALAMINAR NUCLEI
| Nuclei | Input | Output | Function |
|---|---|---|---|
| Rostral intralaminar (Central medial, Paracentral, Central lateral) | Deep cerebellar nuclei, globus pallidus, ARAS | Cerebral cortex + striatum | Maintain alert consciousness (arousal); motor relay for basal ganglia |
| Caudal intralaminar (Centromedian = CM, Parafascicular) | Globus pallidus, ARAS, sensory pathways | Striatum, cerebral cortex | Motor relay for basal ganglia |
The Centromedian nucleus (CM) is the largest intralaminar nucleus and the main target of the globus pallidus.
6. ⚪ RETICULAR NUCLEUS
| Feature | Detail |
|---|---|
| Input | Cerebral cortex, all other thalamic nuclei, ARAS |
| Output | Back to other thalamic nuclei ONLY (NOT to cortex) |
| Neurotransmitter | GABA (inhibitory) - unlike all other thalamic nuclei which are glutamatergic |
| Function | Acts as a "gatekeeper" - regulates and modulates activity of other thalamic nuclei |
Key fact: The reticular nucleus is the only thalamic nucleus that does NOT project to the cortex. It regulates the others.
Classification Another Way: Specific vs Non-Specific
| Type | Nuclei | Projects to | Function |
|---|---|---|---|
| Specific relay | VPL, VPM, LGN, MGN, VL, VA, Anterior | Discrete cortical areas (Layer IV) | Relay specific sensory/motor info |
| Non-specific (diffuse) | Intralaminar, midline, Pulvinar, MD | Widespread cortex (Layers I-IV) | Arousal, awareness, association |
Complete 3D Map of All Nuclei
Clinical Significance
| Condition | Nucleus/Area Affected | Result |
|---|---|---|
| Thalamic stroke (VPL/VPM) | Posterior thalamus | Contralateral hemisensory loss (Dejerine-Roussy syndrome = thalamic pain) |
| Parkinson's disease DBS | VIM (part of VL) | Deep brain stimulation target for tremor |
| Essential tremor DBS | VIM nucleus | Tremor control |
| Wernicke's encephalopathy | Mediodorsal + intralaminar | Amnesia, confusion |
| Thalamic amnesia | Anterior nucleus (Papez circuit) | Anterograde amnesia |
| Generalized epilepsy | Intralaminar nuclei involved in absence seizures | Spike-wave discharges |
| Sleep/coma | Reticular nucleus + intralaminar | Loss of consciousness |
PART 2: HOW TO WRITE THE 5-MARK ANSWER
✍️ Model 5-Mark Answer: Nuclei of the Thalamus
- Input: Mammillary bodies (via mammillothalamic tract) and hippocampus
- Output: Cingulate gyrus
- Function: Part of the Papez circuit - memory and emotional processing
- Mediodorsal nucleus (MD): Input from amygdala and olfactory cortex → Output to prefrontal cortex
- Function: Relay for limbic inputs to frontal lobe; behavior and judgment
- Lateral Dorsal (LD): Functions with anterior nuclei (limbic)
- Lateral Posterior (LP): Functions with pulvinar
- Pulvinar: Largest thalamic nucleus; input from superior colliculus → output to parieto-temporo-occipital association cortex; orientation behavior
| Nucleus | Input | Output | Function |
|---|---|---|---|
| Ventral Anterior (VA) | Globus pallidus, SNr, cerebellum | Motor, premotor cortex | Basal ganglia relay to motor cortex |
| Ventral Lateral (VL) | Deep cerebellar nuclei, globus pallidus | Motor cortex | Cerebellar relay to motor cortex |
| VPL | Medial lemniscus + spinothalamic tract | Somatosensory cortex | Body sensation relay |
| VPM | Trigeminal lemniscus + taste | Somatosensory + taste cortex | Face sensation + taste relay |
- Lateral Geniculate Nucleus (LGN): Optic tract → Primary visual cortex
- Medial Geniculate Nucleus (MGN): Inferior colliculus → Primary auditory cortex
- Lie within the internal medullary lamina
- Include centromedian (CM) and parafascicular nuclei (caudal group)
- Input from ARAS, globus pallidus → Output to cortex and striatum
- Function: Arousal/consciousness; basal ganglia motor relay
- Thin shell around the lateral thalamus
- GABAergic (inhibitory) - only nucleus that does NOT project to cortex
- Receives cortical and thalamic inputs → Projects back to other thalamic nuclei
- Function: Modulates and gates thalamic activity
- Thalamic stroke (VPL/VPM) → Dejerine-Roussy syndrome (contralateral hemisensory loss + thalamic pain)
- VIM nucleus (part of VL) → DBS target for tremor in Parkinson's disease
- Anterior nucleus damage → Thalamic amnesia (Korsakoff syndrome)
- Intralaminar nuclei → Role in absence epilepsy and sleep-wake regulation
🔑 Master Mnemonic
- Anterior - Amnesia/emotion (Papez)
- Lateral group (Lateral dorsal, Lateral posterior, Pulvinar)
- Posterior = Pulvinar (largest)
- Hear via MGN (Medial Geniculate)
- Auditory = Medial; Visual = Lateral (LGN)
- Ventral tier: VA, VL, VPL, VPM
- Emotion/frontal = Mediodorsal
- Centromedian = intralaminar (basal ganglia)
- Taste via VPM
- Only GABAergic = Reticular nucleus
- Reticular nucleus = no cortical projection
Quick Exam Summary Table
| Nucleus | Input | Output | Function |
|---|---|---|---|
| Anterior | Mammillary bodies, hippocampus | Cingulate gyrus | Memory, emotion (Papez) |
| MD | Amygdala, olfactory cortex | Prefrontal cortex | Behavior, judgment |
| VPL | Medial lemniscus, spinothalamic | Somatosensory cortex | Body sensation |
| VPM | Trigeminal lemniscus, taste | Somatosensory + taste cortex | Face sensation + taste |
| VL/VA | Cerebellum, basal ganglia | Motor cortex | Motor relay |
| LGN | Optic tract (retina) | Visual cortex | Vision |
| MGN | Inferior colliculus | Auditory cortex | Hearing |
| Pulvinar | Superior colliculus | Parieto-occipital assoc. | Visual orientation |
| Intralaminar | ARAS, basal ganglia | Cortex + striatum | Arousal, consciousness |
| Reticular | Cortex + thalamus | Other thalamic nuclei ONLY | Gatekeeper (GABA) |
Extension of pia mater
pia mater extensions filum terminale denticulate ligament choroid plexus tela choroidea
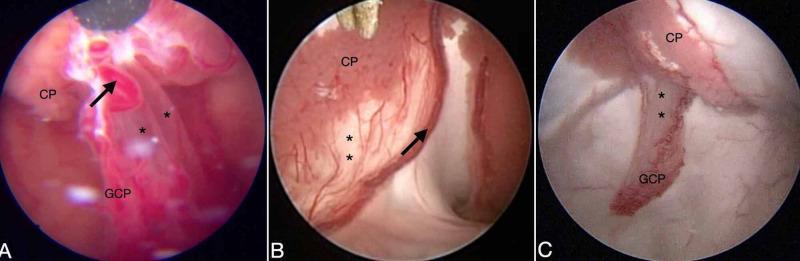
This set of intraoperative endoscopic images illustrates variations in the neuroanatomical fixation of the choroid plexus (CP) within the lateral ventricles across three clinical scenarios (A, B, and C). The images highlight the relationship between the glomus of the choroid plexus (GCP), the tela choroidea, and the associated vasculature. In Panel A, a large choroidal artery is marked by a black arrow within a defined GCP, while the tela choroidea (asterisks) is visible as a translucent, sheet-like membrane. Panel B shows a case of agenesis of the septum pellucidum, where the CP is clearly separated from the choroidal artery by a thin, vascularized tela choroidea. Panel C demonstrates a variant with significant elongation of the GCP, appearing as a vertical, band-like structure separated from the main CP body. These images serve as an educational resource for neurosurgeons to identify anatomic variations in GCP mobility and tela choroidea density during endoscopic third ventriculostomy (ETV) or choroid plexus cauterization (CPC).
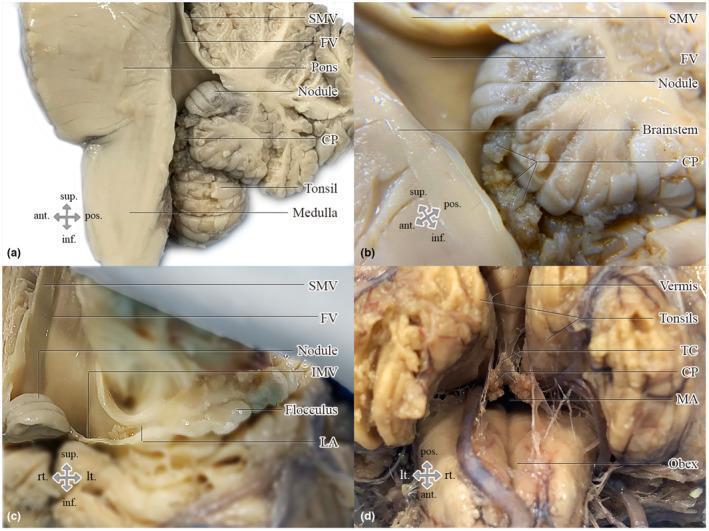
Educational clinical photographs of a formalin-fixed human brain dissection focusing on the anatomy of the fourth ventricle and hindbrain. (a) Midsagittal section showing the superior medullary velum (SMV), pons, medulla oblongata, and cerebellum components including the nodule and tonsil. (b) Close-up of the median aperture (MA) highlighting the choroid plexus (CP) as it relates to the vermis and brainstem. (c) Anterior view of the fourth ventricle with the brainstem retracted, revealing the flocculonodular lobe, inferior medullary velum (IMV), and lateral aperture (LA). (d) Inferior view demonstrating the median aperture as a gap bounded by the obex, vermis, and tela choroidea (TC). The images illustrate the complex three-dimensional relationships of the ventricular system roof and drainage points. Key structures include the choroid plexus, superior/inferior medullary vela, and cerebellar landmarks. This material is designed for advanced neuroanatomical education regarding the cerebrospinal fluid flow pathways and hindbrain morphology.
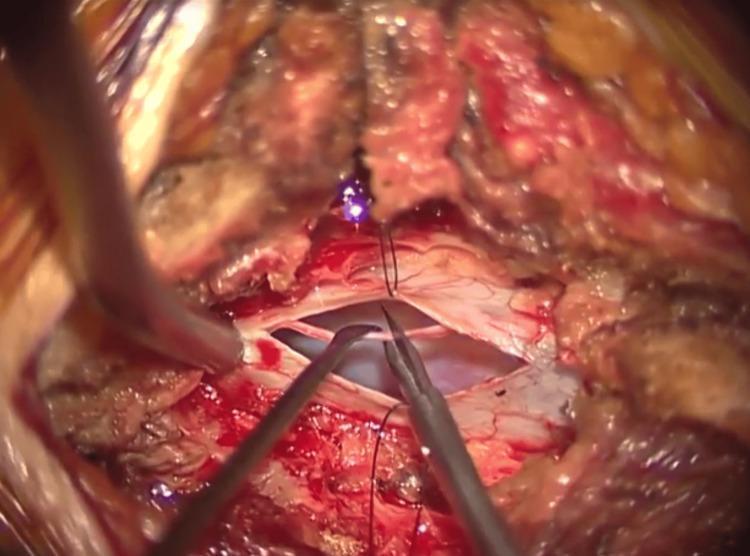
This intraoperative clinical photograph captures a microsurgical procedure for tethered cord syndrome, specifically the untethering of the filum terminale at the L5/S1 vertebral level. The surgical field demonstrates a longitudinal durotomy, with the edges of the incision retracted by stay sutures to expose the underlying neural elements. The filum terminale, appearing as a thin, whitish-grey fibrous band, is being meticulously isolated and manipulated using specialized microsurgical instruments, including a nerve hook and microscissors. The surrounding dura mater is visible as a translucent white membrane with fine vasculature, while the deeper surgical bed shows the dark void of the spinal canal. Hemorrhagic staining and soft tissue dissection planes are evident at the margins of the incision. This image illustrates the critical step of identifying and sectioning the filum terminale to relieve tension on the spinal cord, a key procedure in neurosurgery and orthopedic spine surgery.
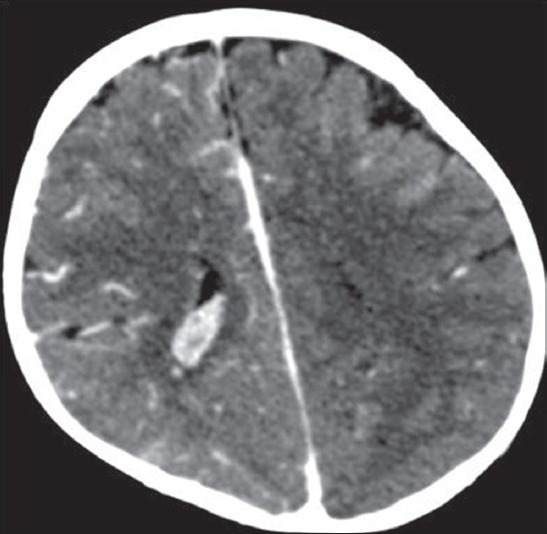
**Imaging Modality:** Axial contrast-enhanced Computed Tomography (CT) of the brain. **Anatomical Region:** Supratentorial brain, specifically involving the right parietal lobe and the ventricular system. **Observed Pathology:** * **Vascular/Pia Mater:** Significant gyriform enhancement is visible along the cortical surface of the right high parietal lobe, suggesting pial angiomatosis. * **Choroid Plexus:** Prominent enlargement and hyperdensity of the right glomus of the choroid plexus within the atrium of the lateral ventricle, consistent with ipsilateral choroid plexus hypertrophy. * **Parenchymal Changes:** Localized cortical atrophy is noted in the contralateral (left) frontal region. * **Calcification/Density:** Linear hyperdense tracks are present in the right parietal subcortical white matter, characteristic of intracranial calcification or anomalous venous drainage. **Characteristic Visual Features:** The combination of leptomeningeal enhancement (pial angiomatosis) and an enlarged ipsilateral choroid plexus are hallmark radiologic features of Sturge-Weber syndrome (encephalotrigeminal angiomatosis). **Key Diagnostic Features:** Ipsilateral cortical gyriform enhancement, choroid plexus enlargement, and focal cerebral atrophy.
denticulate ligament spinal cord cross section anatomy
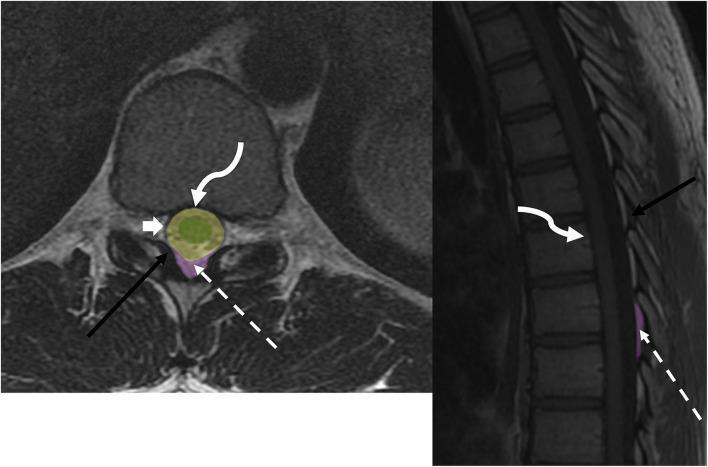
This educational anatomical diagram utilizes MRI sequences to illustrate the compartmental anatomy of the spinal canal. On the left, an axial T2-weighted image shows a cross-section of a lumbar vertebra, highlighting the high-signal (bright) cerebrospinal fluid within the thecal sac (broad white arrow). On the right, a sagittal T1-weighted sequence displays the vertical alignment of vertebral bodies and the spinal cord. Color-coded overlays define three key anatomical spaces: the intramedullary space (green) containing the spinal cord, the intradural space (yellow), and the dorsal epidural space (purple). Key ligamentous landmarks are annotated with arrows: the posterior longitudinal ligament (curved white arrow) bordering the anterior aspect of the canal, and the ligamentum flavum (black arrow) forming the posterior border. The dotted white arrow points to the epidural fat within the epidural space, characterized by intermediate signal on T1 and T2 sequences. This visualization is designed for teaching clinicians and medical students the spatial relationships necessary for localizing spinal pathologies such as disc herniations, epidural abscesses, or intramedullary tumors.
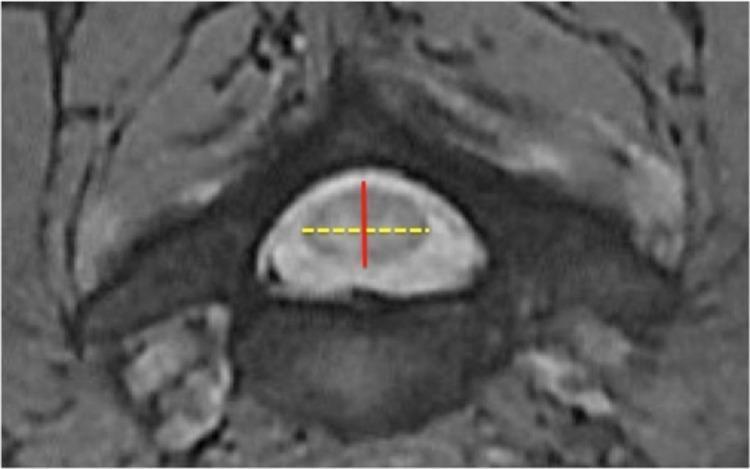
This diagnostic axial cross-section, likely from an MRI or CT myelogram, shows the cervical spinal cord within the spinal canal at the disc level. The central spinal cord is depicted as a homogenous, elliptical structure with well-defined boundaries. Superimposed on the cord are two measurement indicators: a vertical solid red line representing the Anteroposterior Cord Diameter (APCD) and a horizontal dotted yellow line representing the Transverse Cord Diameter (TCD). The surrounding anatomy includes the ventral vertebral body and posterior elements such as the lamina and pedicles, which define the limits of the spinal canal. This imaging is clinically used to assess for cervical spondylotic myelopathy (CSM) by calculating compression ratios (APCD/TCD) and monitoring for cord stenosis. The educational focus is on the radiological quantification of spinal cord dimensions for identifying pathological narrowing or compression in patients presenting with myelopathic symptoms.
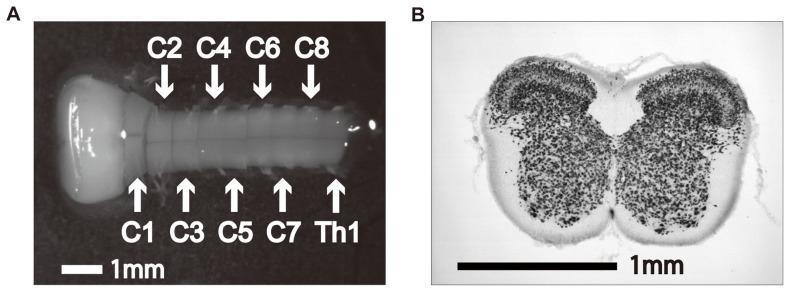
Educational images illustrating the gross and microscopic anatomy of the spinal cord. Panel A is a macro-anatomical photograph of an isolated lower brainstem and cervical spinal cord. The specimen displays clear segmentation, with arrows indicating cervical levels C1 through C8 and the first thoracic segment (Th1). Panel B is a histological diagnostic image showing a transverse cross-section of the spinal cord at the C4 level. The section is treated with NeuN immunohistochemical staining, which selectively labels neuronal cell bodies. This staining highlights the internal butterfly-shaped gray matter against the lighter peripheral white matter. The gray matter reveals well-defined laminar structures, particularly evident in the dorsal and ventral horns where neuron density is high. Key educational concepts include spinal cord segmentation, the distribution of gray versus white matter in cross-sections, and the visualization of spinal laminae through specific neuronal markers. A 1mm scale bar is included in both panels for size reference.
🧠 Extensions of Pia Mater - Complete Guide
PART 1: EXPLAINED FROM ZERO
First - What is the Pia Mater?
OUTSIDE → INSIDE
Dura mater (thick, tough, leathery - "tough mother")
↓
Arachnoid mater (web-like, spider-web appearance - "spider mother")
↓
Pia mater (thin, delicate, tightly stuck to brain - "tender/pious mother")
- Highly vascular (rich in blood vessels)
- Tightly adherent to every fold and groove of the brain and spinal cord surface
- It dips into every sulcus (groove) of the brain, unlike the arachnoid which just bridges over them
What are Extensions of Pia Mater?
EXTENSION 1: 🔴 FILUM TERMINALE
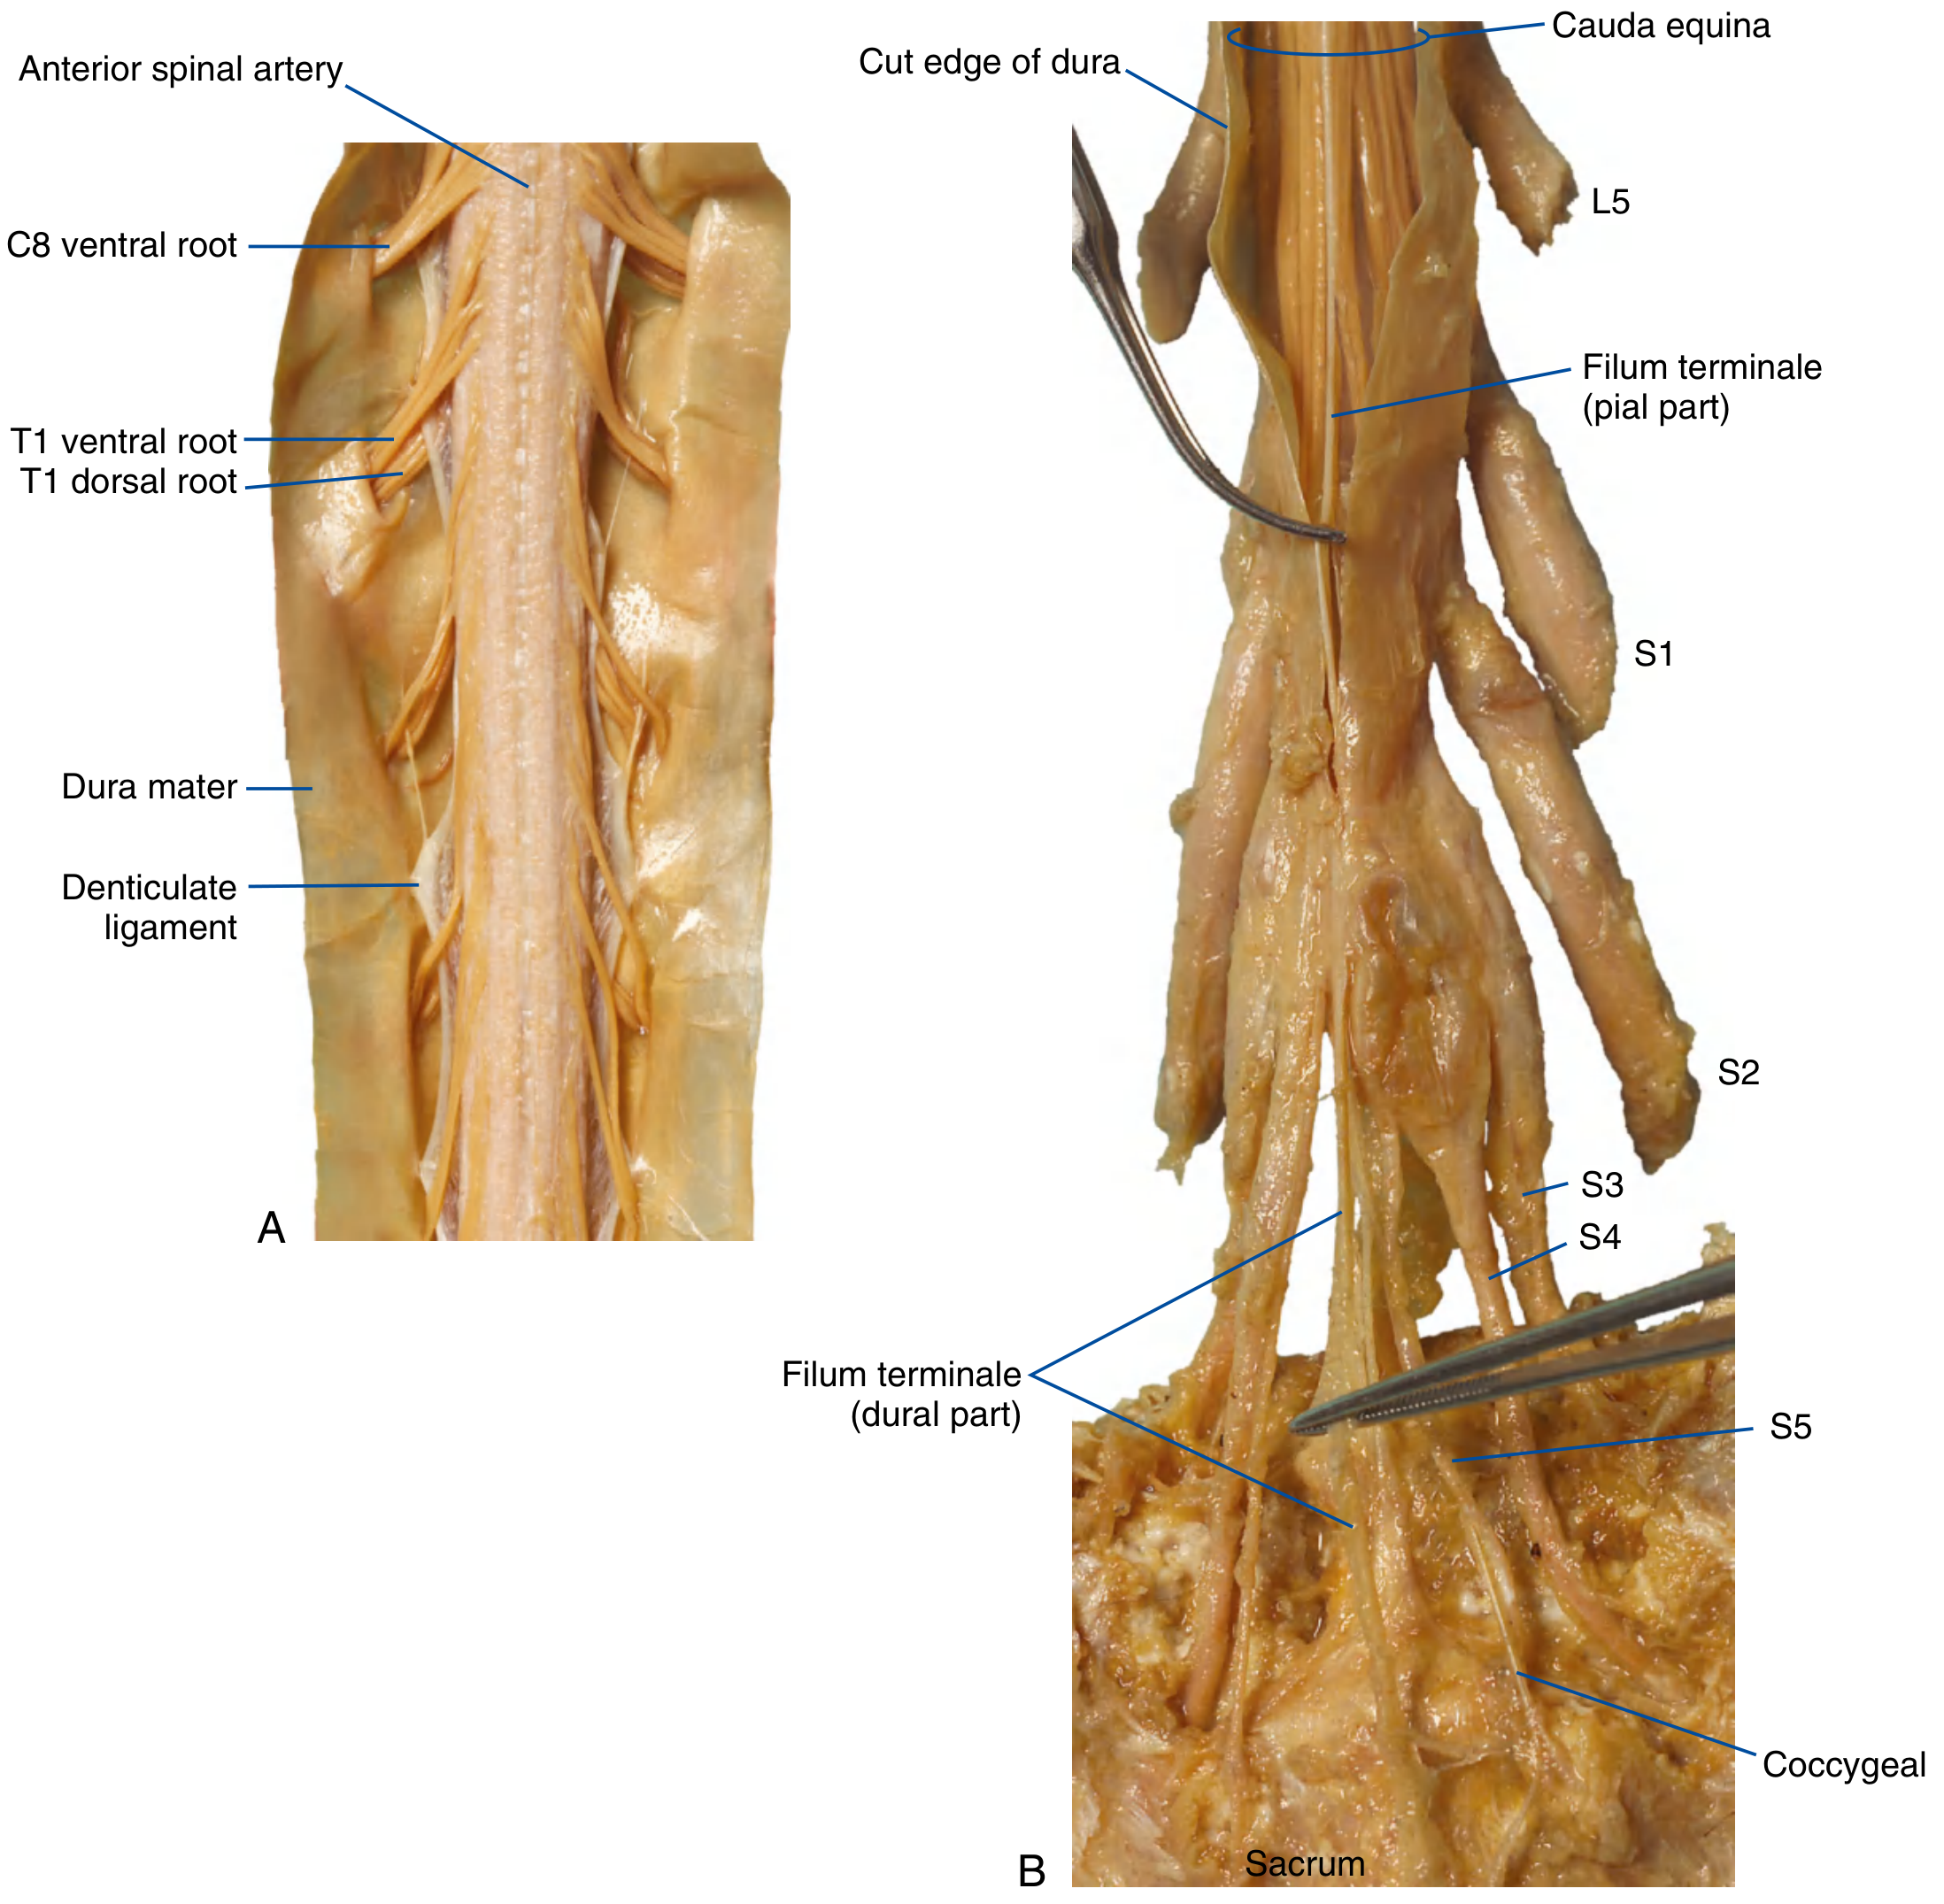
| Part | Also Called | Location | Composition |
|---|---|---|---|
| Filum terminale internum (pial part) | Filum terminale interna | From conus medullaris (L1) → down to the lower end of the dural sac (S2) | Pure pia mater; runs among the nerve roots of the cauda equina |
| Filum terminale externum (dural part) | Coccygeal ligament | Exits the dural sac at S2 → travels down to attach to the back of the coccyx | Pia mater covered by dura mater |
EXTENSION 2: 🟡 DENTICULATE LIGAMENT
- Medial attachment: Attached to the spinal cord midway between the anterior (motor) and posterior (sensory) nerve roots
- Free border: Has 20-21 triangular, tooth-like projections (like a saw blade) that pierce through the arachnoid mater and attach to the inner surface of the dura mater
- These teeth alternate with the exit points of nerve roots
- Present from the foramen magnum above to L1 below (roughly same level as the conus)
- Suspends and anchors the spinal cord in the center of the subarachnoid space
- Prevents the cord from swinging or rotating
- Acts like a stabilizing hammock
EXTENSION 3: 🟢 TELA CHOROIDEA
- Ependymal cells (inner layer, lining the ventricle)
- Pia mater with its blood vessels (outer layer)
- Roof of the third ventricle (tela choroidea of 3rd ventricle)
- Roof of the fourth ventricle (tela choroidea of 4th ventricle)
- Part of the lateral walls of the lateral ventricles
Simple mental image: If you push your knuckles into a balloon, the balloon wraps around your knuckles. Here, the pia mater + blood vessels push into the ventricular ependyma, creating the folded choroid plexus - the CSF factory.
EXTENSION 4: 🔵 CHOROID PLEXUS
- Lateral ventricles (body, trigone, temporal horn - NOT the frontal or occipital horns)
- Roof of third ventricle
- Roof of fourth ventricle
- Choroidal epithelial cells (specialized ependymal cells)
- Basement membrane
- Loose connective tissue core
- Pia mater
- Capillaries (fenestrated - leaky - unlike the BBB)
- Main site of CSF production (~500 mL/day; ~0.35 mL/min)
- CSF is secreted by active transport from blood into ventricle
- Note: The choroid plexus LACKS the blood-brain barrier (fenestrated capillaries) - this is why some drugs can affect CSF composition
EXTENSION 5: 🟠 PERIVASCULAR SPACES (Virchow-Robin Spaces)
- As the vessel enters the brain surface: pia mater covers it
- As it branches deeper into capillaries: pia mater disappears
- The capillaries are then only covered by astrocytic perivascular foot processes
- Acts as a waste clearance pathway (the "glymphatic system") - CSF flows along these spaces to flush out metabolic waste products including amyloid-beta from the brain
- Functions as a route for immune surveillance
- Enlarged Virchow-Robin spaces visible on MRI are called "état criblé" (cribriform state)
- Seen in aging, hypertension, and dementia
- In Alzheimer's disease, failure of the perivascular glymphatic clearance may contribute to amyloid accumulation
EXTENSION 6 (BONUS): 🟤 NERVE ROOT SLEEVES
Summary Diagram (In Your Mind)
PIA MATER EXTENSIONS
│
├─ FILUM TERMINALE — anchors cord to coccyx (pial + dural parts)
│
├─ DENTICULATE LIGAMENT — suspends cord in center (21 teeth)
│
├─ TELA CHOROIDEA — pia + ependyma = base of choroid plexus
│
├─ CHOROID PLEXUS — CSF production (lateral, 3rd, 4th ventricles)
│
├─ PERIVASCULAR SPACES — glymphatic waste clearance
│
└─ NERVE ROOT SLEEVES — wrap around exiting nerve roots
PART 2: HOW TO WRITE THE 5-MARK ANSWER
✍️ Model 5-Mark Answer: Extensions of Pia Mater
- Filum terminale internum (pial part): Conus medullaris → lower end of dural sac (S2); runs within the cauda equina; ~15 cm long
- Filum terminale externum (coccygeal ligament/dural part): Exits dural sac at S2 → attaches to the back of the first coccygeal vertebra; covered by dura mater
- Function: Anchors the spinal cord and prevents upward traction
- Clinical: Thickened filum → Tethered Cord Syndrome
- Has 20-21 triangular tooth-like projections from its free lateral border
- Each tooth pierces the arachnoid and attaches to the inner surface of the dura mater
- Extends from the foramen magnum to approximately L1
- Function: Suspends and stabilizes the spinal cord in the center of the subarachnoid space
- Clinical: Surgical landmark to distinguish anterior (motor) from posterior (sensory) roots
- Function: Forms the structural base from which the choroid plexus develops
- Located in: lateral ventricles (body, trigone, temporal horn), roof of 3rd ventricle, roof of 4th ventricle
- Function: Produces CSF (~500 mL/day); lacks blood-brain barrier (fenestrated capillaries)
- Function: Glymphatic system - CSF-mediated waste clearance (including amyloid-beta)
- Clinical: Enlarged spaces in aging/hypertension; glymphatic failure linked to Alzheimer's disease
🔑 Quick Recall Mnemonic
Quick Revision Summary
| Extension | Location | Function | Clinical |
|---|---|---|---|
| Filum terminale | Conus → Coccyx | Anchor spinal cord | Tethered cord syndrome |
| Denticulate ligament | Along cord sides (foramen magnum to L1) | Suspend cord centrally | Surgical landmark |
| Tela choroidea | Ventricle roofs (3rd, 4th, lateral) | Base of choroid plexus | Hydrocephalus |
| Choroid plexus | Ventricles | CSF production | Choroid plexus papilloma |
| Perivascular spaces | Throughout brain parenchyma | Glymphatic clearance | Alzheimer's, lacunar strokes |
All transverse sections at different levels
Which region are you asking about transverse sections for?
transverse section midbrain at level of superior colliculus labeled anatomy
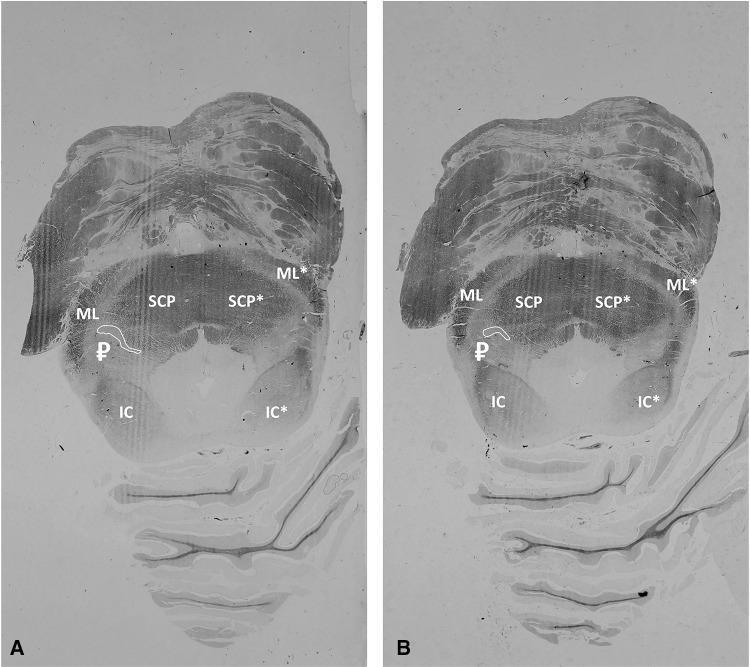
This diagnostic histological specimen showcases two transverse sections (A and B) of the human midbrain at the level of the inferior colliculus (IC), stained using a modified Heidenhain-Woelke method. This specific stain targets myelin, resulting in darkly stained white matter tracts and contrasting lighter, unstained gray matter structures. The sections highlight the neuroanatomical localization of the pedunculopontine nucleus (PPN), labeled with the symbol '₽' and outlined in white. The PPN is visualized as an allantoid-shaped (sausage-shaped) gray matter region positioned between major white matter tracts: the medial lemniscus (ML) laterally and the superior cerebellar peduncle (SCP) medially. Section A represents a more cranial level, while Section B represents a more caudal level where the PPN's caudal apex is visible. Asterisks (*) denote left-sided neural structures. These sections serve as a gold-standard histological reference for identifying the PPN's boundaries, which are often poorly visualized on standard structural MRI.
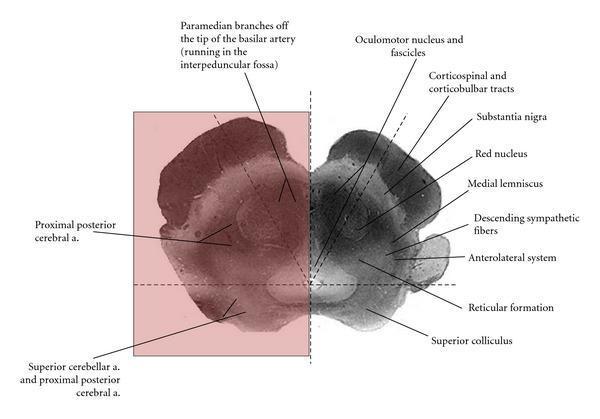
This medical illustration presents an axial cross-section of the human midbrain at the level of the superior colliculus, functioning as an anatomical and vascular diagram. The right side of the image identifies key neuroanatomical structures, including the superior colliculus in the dorsal tectum, the red nucleus and medial lemniscus in the tegmentum, and the substantia nigra situated dorsal to the cerebral peduncle (containing corticospinal and corticobulbar tracts). Also labeled are the oculomotor nucleus/fascicles, descending sympathetic fibers, anterolateral system, and reticular formation. The left side of the diagram is overlaid with shaded regions indicating vascular territories. Three distinct zones are delineated: the medial zone supplied by paramedian branches from the tip of the basilar artery; the lateral zone supplied by the proximal posterior cerebral artery; and the dorsal zone (superior colliculus and tectum) supplied by both the superior cerebellar artery and proximal posterior cerebral artery. This diagram is designed for neurosurgical and radiological education to illustrate the correlation between midbrain vascular supply and clinical stroke syndromes like Weber, Claude, or Benedikt syndromes.
transverse section pons medulla oblongata labeled anatomical structures
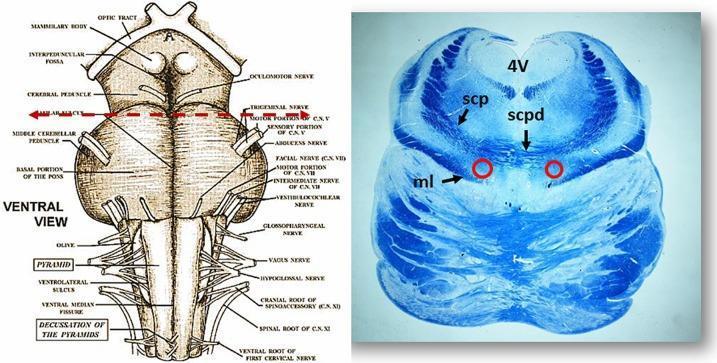
Educational medical graphic showing the neuroanatomy of the human brainstem. On the left is a labeled anatomical diagram of the ventral brainstem, including the optic tract, mammillary bodies, pons, and medulla oblongata, with a red dashed line indicating the level of a transverse section through the rostral pons. On the right is a corresponding histological image of the rostral pons using Klüver-Barrera staining. The blue luxol fast blue stain highlights myelinated fiber tracts such as the superior cerebellar peduncles (scp) and the medial lemniscus (ml). Key labeled structures include the fourth ventricle (4V) dorsally and the decussation of the superior cerebellar peduncles (scpd) in the midline. Red circles identify the bilateral localization of the Kölliker-Fuse nucleus (KFN), situated between the scpd and ml. This visual resource is used to teach the spatial relationships of brainstem nuclei and fiber tracts within the respiratory control centers of the rostral pons.
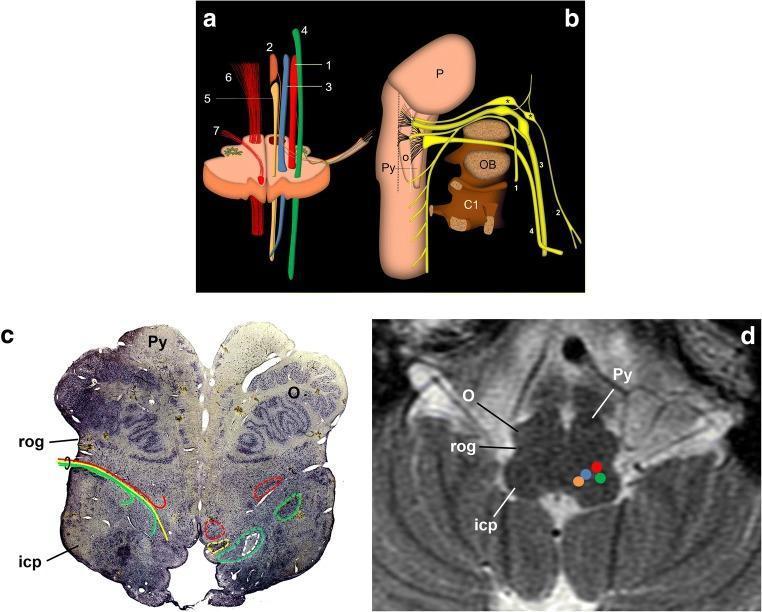
Educational panel illustrating the anatomy of the glossopharyngeal nerve (CN IX) and its relationships in the medulla oblongata. Figure (a) is an anatomical diagram of a transverse section of the medulla at the level of the inferior olive, highlighting efferent nuclei—nucleus ambiguus (1) and inferior salivatory nucleus (2)—and afferent nuclei—solitary nucleus (3) and spinal trigeminal nucleus (4). Other shown structures include the dorsal motor nucleus of vagus (5), pyramidal tract (6), and hypoglossal nerve (7). Figure (b) is a schematic drawing of the lower cranial nerves (1: spinal, 2: CN IX, 3: vagus, 4: hypoglossal) showing their course from the brainstem to the jugular foramen in relation to the pons (P), pyramid (Py), and occipital bone (OB). Figures (c) and (d) provide clinical correlation via a Nissl-stained micrographic slice and an axial T2-weighted MRI, respectively. These images demonstrate the retro-olivary groove (rog), inferior olivary nucleus (O), and inferior cerebellar peduncle (icp), identifying the precise exit point and internal nuclear organization of the glossopharyngeal nerve within the upper medulla.
spinal cord transverse sections cervical thoracic lumbar sacral levels comparison labeled
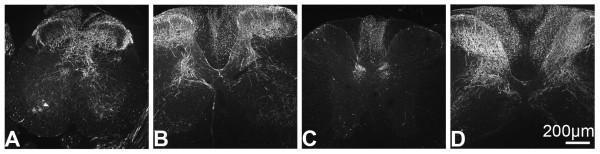
Fluorescence microscopy images depicting green fluorescent protein immunoreactivity (GFP-ir) in transverse sections of a mouse spinal cord across four anatomical levels: (A) sacral, (B) lumbar, (C) thoracic, and (D) cervical. This diagnostic series illustrates the rostral-caudal distribution of viral vector-mediated gene expression (rAAV5-GFP) following intrathecal administration. In the sacral and lumbar sections, GFP signal is dense throughout the gray matter, notably in the dorsal and ventral horns. The thoracic section shows more restricted labeling, primarily localized to the dorsal columns and Clarke's columns. In the cervical section, there is prominent GFP expression in the dorsal horn. Across all levels, the signal is primarily associated with nerve fibers, likely representing central processes of primary afferent neurons. A notable absence of signal is observed in the substantia gelatinosa (lamina II) of the dorsal horn. This visual demonstrates the efficacy of gene delivery techniques in neuroanatomy and pain research.
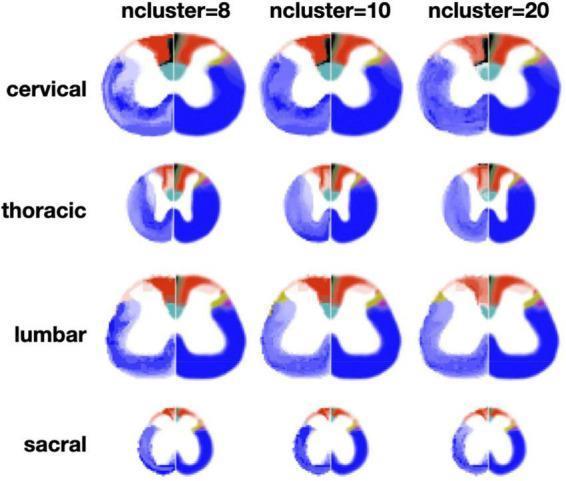
This Comparison Chart illustrates the results of region-wise automated clustering of spinal cord white matter across different levels and parcellation densities. The image is organized into a 4x3 matrix: the vertical axis represents anatomical regions (cervical, thoracic, lumbar, and sacral), while the horizontal axis indicates the number of clusters (n=8, 10, and 20). Each spinal cord cross-section is split into two halves: the left hemi-section shows data-driven clustering results color-coded to represent distinct white matter tracts based on morphometric signatures (e.g., axon density, diameter, and myelin thickness), while the right hemi-section shows the corresponding Watson atlas for reference. Notable features include the consistent delineation of the cuneate fasciculus (red) and dorsal corticospinal tract (cyan) across multiple levels. The cervical and lumbar sections show a larger cross-sectional area and more complex clustering patterns than the thoracic and sacral regions. Increasing the cluster count from 8 to 20 provides finer parcellation and reveals smaller tracts, though some regions (like the sacral level) appear noisier. This visual demonstrates the application of quantitative MRI/histology-based algorithms for neuroanatomical mapping and tractography.
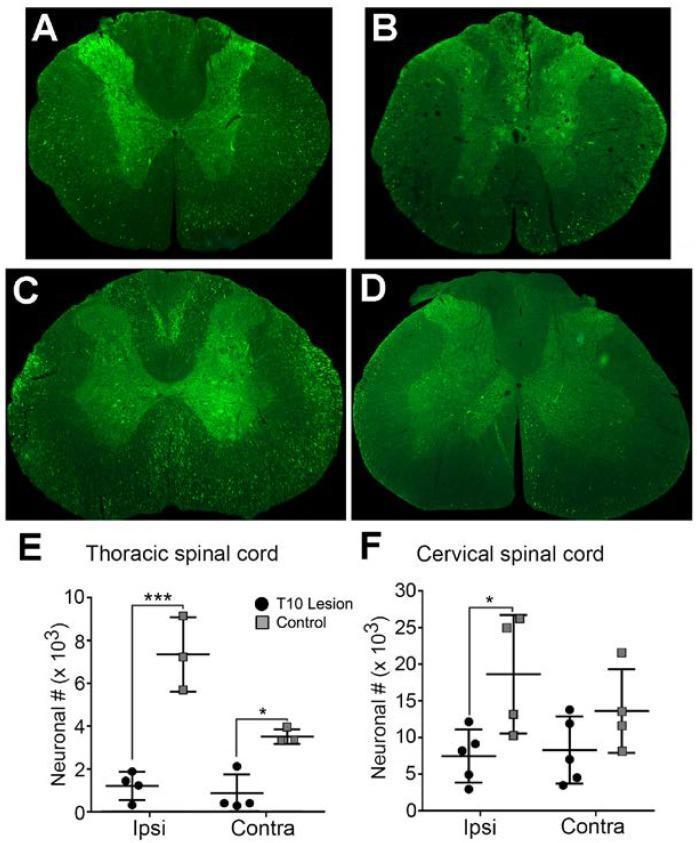
This composite educational graphic illustrates the histological and quantitative impact of a T10 spinal cord contusion injury on neuronal populations using a rat model. Panels A-D display fluorescence microscopy images of transverse spinal cord sections. Panels A and C show normal spinal cords (T7 and C4 levels respectively) with widespread, high-intensity Green Fluorescent Protein (GFP) expression within neurons and axons across gray and white matter, indicating robust axonal transport from a lumbar injection site. Panels B and D demonstrate the same regions post-T10 contusion, revealing a marked reduction in GFP-labeled structures, signifying interrupted retrograde transport and axonal degeneration. Panels E and F provide quantitative analysis via scatter plots comparing neuronal counts in 'T10 Lesion' vs. 'Control' groups. The thoracic region (E) shows a significant decrease in neuronal numbers on both ipsilateral and contralateral sides post-injury. The cervical region (F) shows a more localized significant decrease on the ipsilateral side. This visual comparison demonstrates the pathophysiology of spinal cord injury and its effect on long-distance neural connectivity and propriospinal neuronal survival.
brainstem cross sections midbrain pons medulla all levels labeled diagram
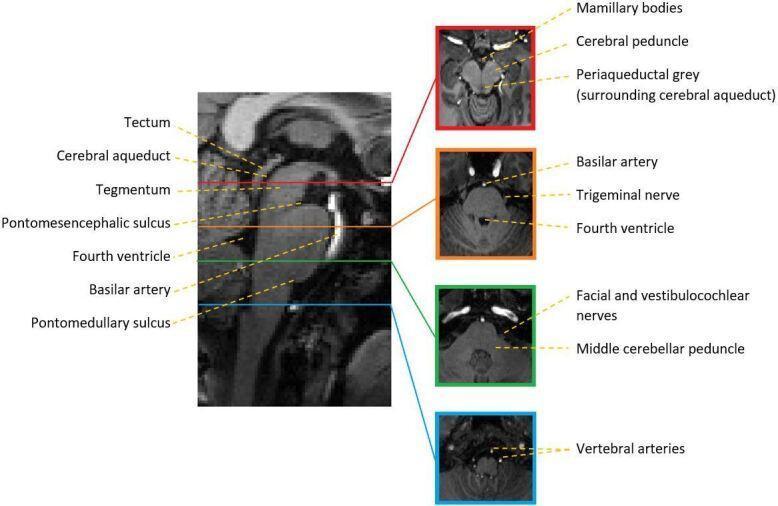
This diagnostic image provides a comprehensive anatomical overview of the human brainstem using T1-weighted MRI. On the left, a mid-sagittal section highlights the vertical arrangement of the midbrain, pons, and medulla. Key landmarks labeled include the tectum, cerebral aqueduct, tegmentum, and the fourth ventricle. Boundary demarcations such as the pontomesencephalic sulcus and the pontomedullary sulcus are clearly identified. To the right, four corresponding axial cross-sections are presented to illustrate internal and adjacent structures at specific levels. The superior axial view (midbrain) labels the mamillary bodies, cerebral peduncle, and periaqueductal grey. The second view (upper pons) identifies the basilar artery, trigeminal nerve, and fourth ventricle. The third view (lower pons/junction) shows the facial and vestibulocochlear nerves alongside the middle cerebellar peduncle. The most caudal axial view (medulla) highlights the vertebral arteries. This educational graphic is designed to teach brainstem spatial relationships, neuroanatomy, and neuroradiological landmarks for clinical localization.
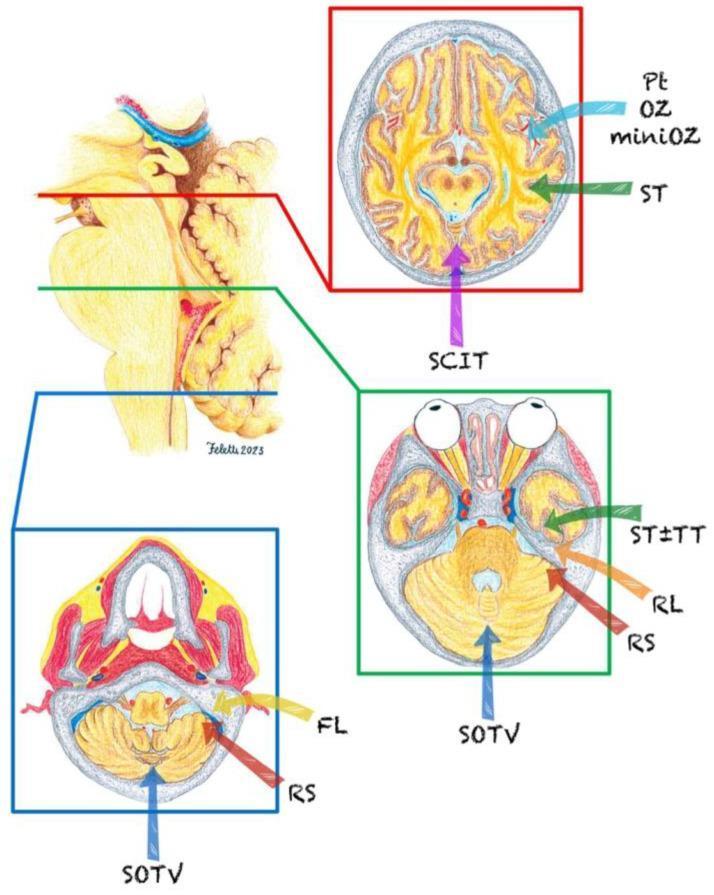
Anatomical and neurosurgical illustration depicting primary surgical approaches to the brainstem, segmented by axial planes. The left side of the image shows a sagittal view of the brainstem and cerebellum, color-coded into three main regions: the midbrain (red), the pons (green), and the medulla (blue). Three corresponding axial cross-sections are displayed on the right, mapped to these regions. The midbrain section (red frame) illustrates the Pterional (Pt), Orbitozygomatic (OZ/miniOZ), Subtemporal (ST), and Supracerebellar Infratentorial (SCIT) approaches. The pons section (green frame) demonstrates the Subtemporal (ST), Transtemporal (TT), Retrolabyrinthine (RL), Retrosigmoid (RS), and Suboccipital Transtelovelar (SOTV) routes. The medulla section (blue frame) highlights the Far Lateral (FL), Retrosigmoid (RS), and Suboccipital Transtelovelar (SOTV) trajectories. Arrows indicate the surgical vectors relative to the neuroanatomy, including the cerebellum, brainstem nuclei, and surrounding cranial structures, serving as a guide for selecting operative corridors based on lesion localization within the brainstem.
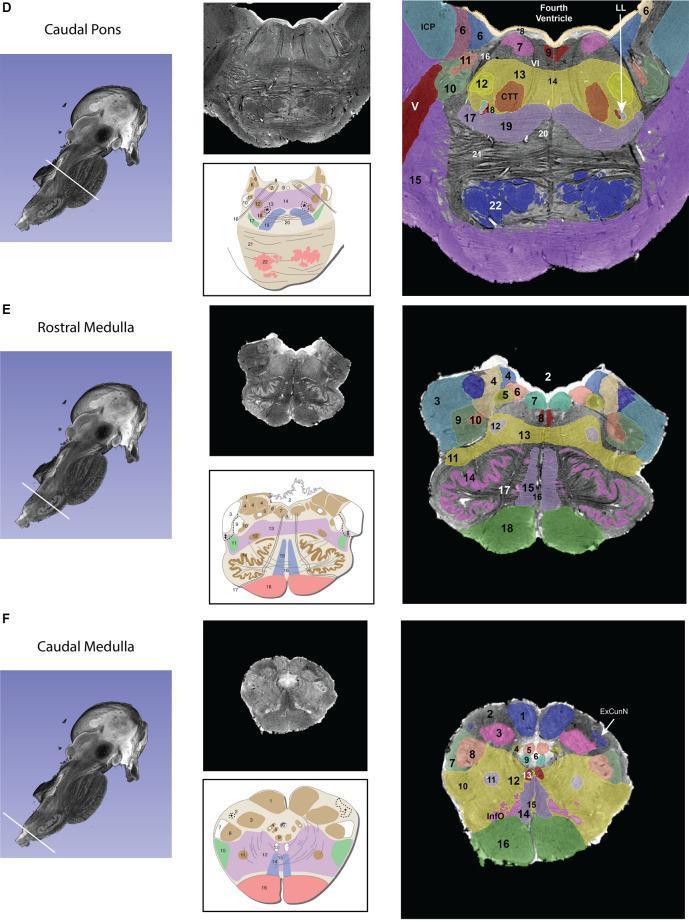
This diagnostic comparison chart provides high-resolution axial MRI sections and corresponding anatomical schematics of the human brainstem at three levels: the caudal pons (D), rostral medulla (E), and caudal medulla (F). Each row contains a sagittal reference view indicating the slice plane, a raw T2-weighted axial MRI, a corresponding labeled anatomical diagram, and a color-coded segmented MRI overlay. Key neuroanatomical structures identified include the fourth ventricle, middle and inferior cerebellar peduncles (MCP, ICP), facial motor nucleus, abducens nucleus, and the inferior olivary nucleus. In the caudal pons, the broad basilar part and large middle cerebellar peduncles are prominent. Progressing caudally into the medulla, the sections transition to a more rounded morphology, highlighting the emergence of the pyramids, the inferior olives, and dorsal column nuclei such as the nucleus gracilis and cuneatus. This resource is designed for advanced neuroanatomical education, facilitating the correlation between clinical imaging modalities and theoretical structural maps to aid in the identification of nuclei and fiber tracts.
spinal cord cross section cervical enlargement labeled grey white matter horns
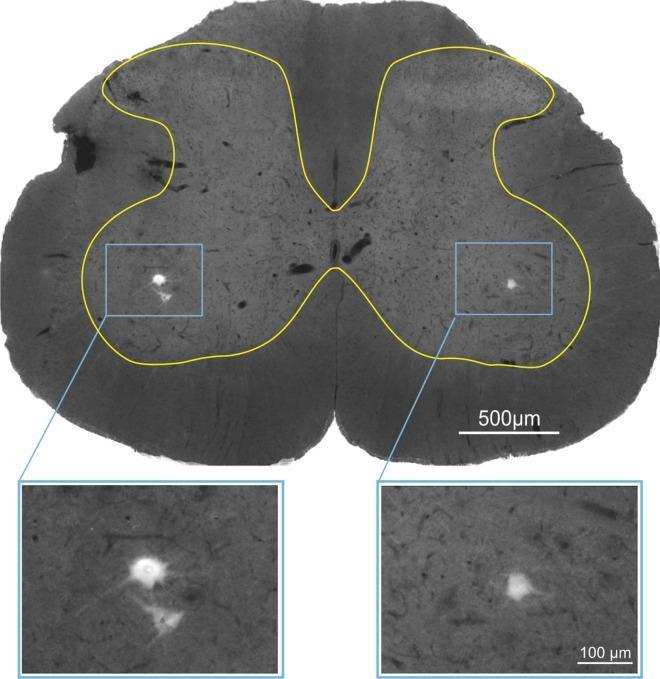
This diagnostic image shows a cross-sectional view of the L5 spinal cord segment, typical for neuroanatomical research. The section displays the characteristic butterfly-shaped central grey matter, demarcated by a yellow border, surrounded by peripheral white matter. The image demonstrates retrograde tracing of alpha-motoneurons (α-MNs) using True Blue fluorescence tracer, which was injected into the lateral gastrocnemius (LG) muscle. Two blue rectangular frames in the ventral horns highlight the bilateral distribution of labeled motoneurons. Below the main section, magnified inset views (100 µm scale) reveal the detailed morphology of these motoneurons, characterized by bright, fluorescent somata against a dark background, showing irregular polygonal shapes and emerging cellular processes. These α-motoneurons are essential components of the lower motor neuron system, and their visualization allows for the study of synaptic connectivity, such as glutamatergic VGLUT1 and cholinergic VAChT terminal density. The main section includes a 500 µm scale bar for anatomical orientation. This material is designed for advanced neuroanatomy and physiology education, focusing on spinal cord circuitry and motor unit innervation.
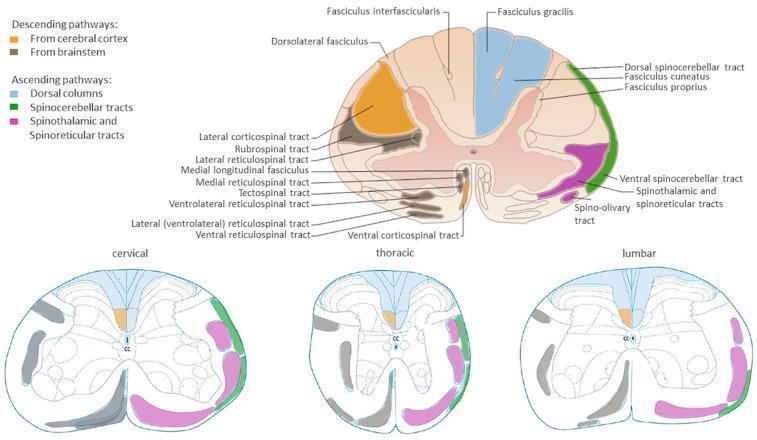
Anatomical diagrams illustrating the organization of major white matter tracts in the human spinal cord across cervical, thoracic, and lumbar cross-sections. A primary large-scale diagram provides detailed labeling of pathways, while three comparative smaller diagrams show regional variations. Descending (motor) pathways are color-coded in orange (corticospinal tracts from the cerebral cortex) and grey/black (brainstem-derived tracts including rubrospinal, reticulospinal, and tectospinal tracts). Ascending (sensory) pathways are highlighted in blue for dorsal columns (fasciculus gracilis and cuneatus), green for dorsal and ventral spinocerebellar tracts, and pink for the spinothalamic and spinoreticular tracts. The diagrams illustrate key neuroanatomical landmarks such as the central canal (CC), dorsal horns, and ventral horns. Educational focus is placed on the somatotopic arrangement and the relative change in white matter volume versus grey matter across different spinal levels, highlighting the clinical relevance for localized spinal cord injury and neurological deficit mapping.
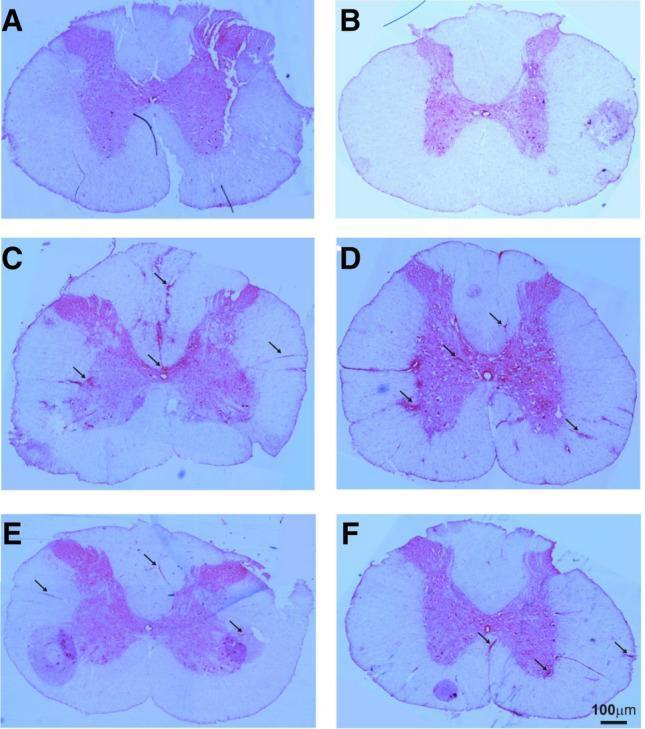
This composite diagnostic image displays six light microscopy micrographs (A-F) of spinal cord cross-sections stained with Hematoxylin and Eosin (H&E). The sections compare cervical (A, C, E) and thoracic (B, D, F) segments across different clinical states in an Experimental Autoimmune Encephalomyelitis (EAE) model. Panels A and B represent control specimens, showing normal anatomical morphology with clear differentiation between the central H-shaped grey matter (dorsal and ventral horns) and the surrounding white matter. Panels C and D illustrate untreated EAE pathology, characterized by numerous hyperchromatic inflammatory infiltrates (indicated by black arrows) distributed throughout both the white and grey matter, signifying active neuroinflammation and tissue disruption. Panels E and F demonstrate EAE sections following treatment, revealing a qualitative reduction in the size and frequency of inflammatory clusters, which are predominantly localized to the peripheral white matter. These sections illustrate the histopathological manifestations of neuroinflammatory disease and the efficacy of therapeutic intervention in preserving spinal cord architecture. A 100µm scale bar is provided in panel F.