
Explain me what tachycardia is
Explain me what tachycardia is
ECG showing sinus tachycardia
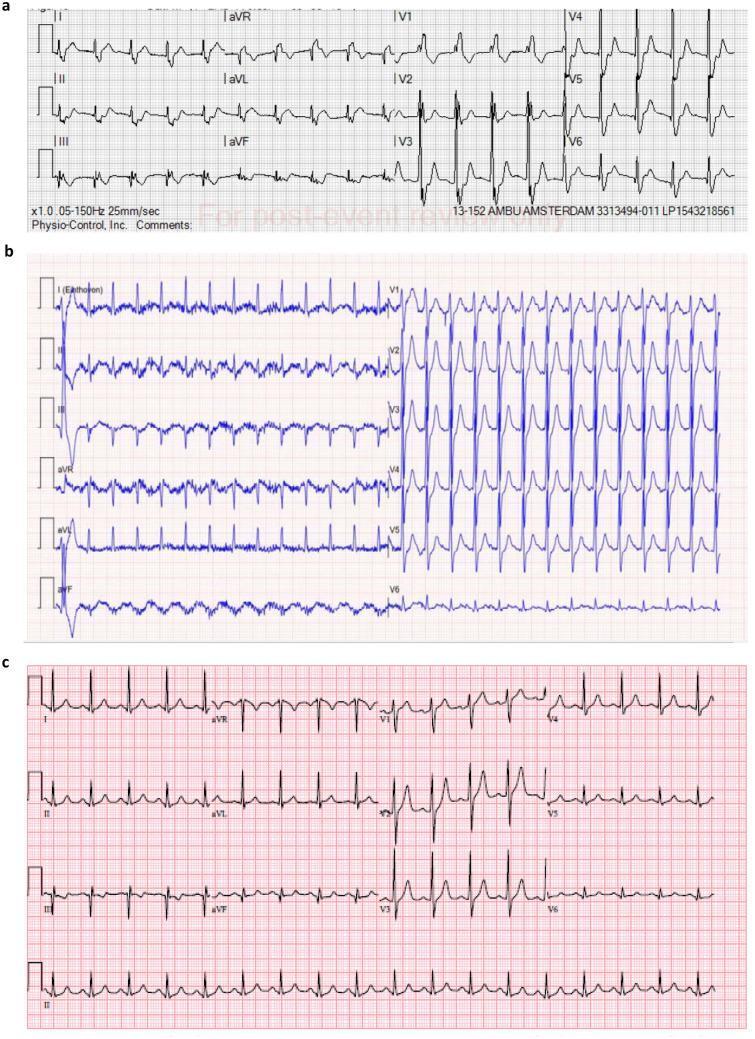
This diagnostic image series presents three successive 12-lead electrocardiograms (ECGs) documenting the evolution of cardiac rhythm and repolarization in a clinical case. Panel A displays a baseline ECG showing a sinus rhythm with prominent ST-segment depressions, most notable in the precordial leads V3 through V5, suggesting acute subendocardial ischemia or NSTEMI. Panel B illustrates a subsequent tracing characterized by a rapid supraventricular tachycardia, showing frequent QRS complexes and persistent baseline oscillations. Panel C demonstrates a follow-up ECG where the rhythm has returned to sinus tachycardia with a partial resolution of the previous ST-segment abnormalities, although minor depressions remain visible in the anterior leads. These images are essential for teaching the interpretation of dynamic ECG changes associated with acute coronary syndromes and tachycardia-induced ischemia in an emergency or critical care setting.
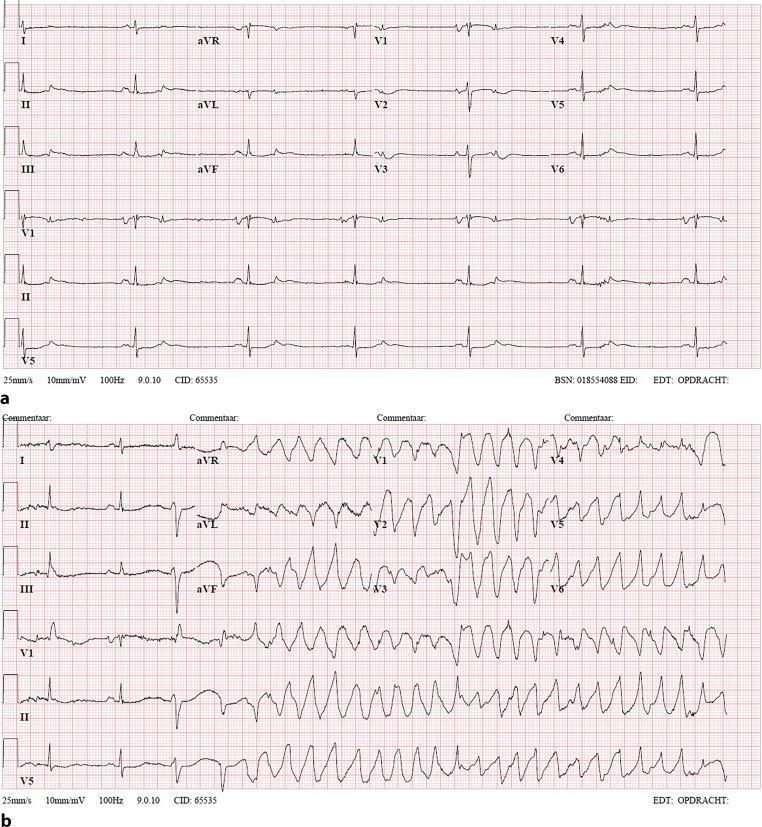
Two-part 12-lead electrocardiogram (ECG) comparison demonstrating drug-induced arrhythmia. (a) Initial ECG showing sinus bradycardia at approximately 40 bpm. Findings include narrow QRS complexes, prolonged QT interval, and T-wave abnormalities (inversions in inferior leads II, III, and aVF). This baseline demonstrates common findings in patients on QT-prolonging agents like sotalol. (b) ECG recorded during a syncopal event, displaying a transition from sinus rhythm into a polymorphic ventricular tachycardia (Torsades de Pointes). The tachycardia is characterized by wide QRS complexes (duration >120ms) with a shifting axis, rotating around the isoelectric line at a rapid rate of 150-200 bpm. The visual sequence illustrates the clinical progression from drug-induced QT prolongation to life-threatening ventricular arrhythmia. Educational focus is on identifying bradycardia, QT prolongation, and the morphology of polymorphic ventricular tachycardia in the context of syncope.
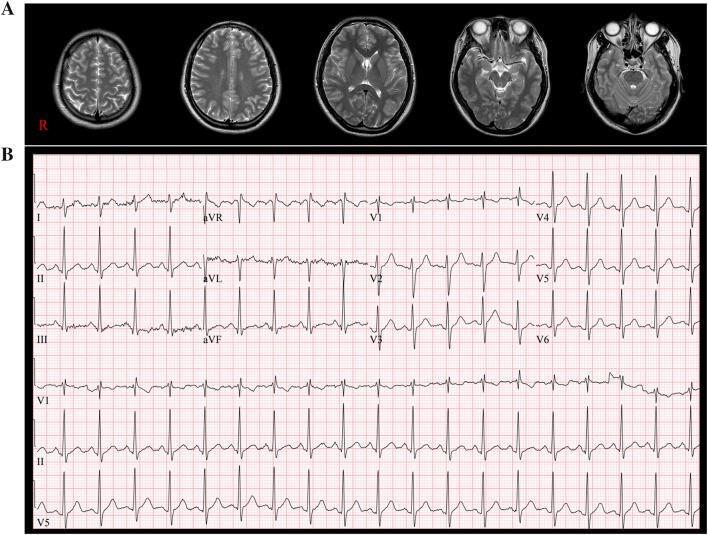
This composite medical visual contains two primary elements: diagnostic neuroimaging and a cardiovascular tracing. The top panel (A) displays a sequence of five axial T2-weighted brain MRI scans ranging from the cranial vault to the base of the skull. These images depict normal neuroanatomy, including the cerebral cortex, subcortical white matter, lateral ventricles, basal ganglia, brainstem, and cerebellum, with no visible intracranial pathology or structural abnormalities. The bottom panel (B) is a standard 12-lead electrocardiogram (ECG) printed on grid paper. The tracing shows a narrow-complex rhythm with a visible P wave preceding each QRS complex, consistent with sinus rhythm. The heart rate is notably elevated, approximately 115 beats per minute, indicating sinus tachycardia. The combination of normal brain imaging and an ECG showing sinus tachycardia is used in a clinical context to evaluate post-traumatic autonomic dysfunction, such as postural orthostatic tachycardia syndrome (POTS) or other dysautonomias following a traumatic brain injury (TBI).
tachycardia
Tachycardia
Why it happens
- Fever - each 1°F rise in body temperature raises heart rate by about 10 bpm (about 18 bpm per °C), because higher temperature speeds up the metabolic rate of the SA node itself. This trend reverses only at very high temperatures (~105°F/40.5°C), where the heart muscle starts to weaken.
- Sympathetic nervous system stimulation - stress, pain, exercise, or reflex responses to low blood pressure (e.g., after severe blood loss) can push the heart to 150-180 bpm.
- Dehydration or blood loss/anemia - the heart compensates for reduced blood volume or oxygen-carrying capacity by beating faster.
- Toxic or metabolic conditions of the heart - e.g., thyrotoxicosis, certain drugs/stimulants.
- Weakened myocardium - a failing heart pumps less blood per beat, lowering blood pressure and triggering sympathetic reflexes that raise rate to compensate.
Clinical classification
- Sinus tachycardia - normal P-wave-before-QRS pattern, just faster (physiologic response to fever, pain, exercise, anemia, hyperthyroidism, etc.)
- Supraventricular tachycardia (SVT) - arises above the ventricles (atrial or AV-nodal); typically narrow QRS (<0.12 sec)
- Ventricular tachycardia (VT) - arises in the ventricles; wide QRS (≥0.12 sec), more dangerous, can degenerate into ventricular fibrillation
- Torsades de pointes - a specific polymorphic VT linked to QT prolongation (e.g., from certain drugs), which can cause syncope or sudden cardiac arrest