
What is Myloid to erytroid ratio
The myeloid to erythroid (M:E) ratio is the ratio of myeloid (white blood cell precursors) to erythroid (red blood cell precursors) cells in the bone marrow. Normally it ranges from about 2:1 to 4:1, meaning there are roughly 2-4 myeloid precursors for every 1 erythroid precursor.
Searching sources...
Reading File
Searching the Web
myeloid to erythroid ratio bone marrow normal range clinical significance
Finding Sources
Reading File
Reading File
Loading Image
Loading Image
Myeloid to Erythroid (M:E) Ratio
The M:E ratio is a bone marrow parameter that compares the total number of myeloid (granulocytic/monocytic) precursors to erythroid (red cell) precursors. It is obtained from a bone marrow differential count and reflects the relative balance of granulopoiesis versus erythropoiesis.
How It Is Calculated
M:E ratio = (Granulocytes + Monocytes + all their precursors) / (Total nucleated erythroid precursors)
All stages of each lineage are counted - from blasts through mature forms.
Normal Range
| Source | Normal M:E Ratio |
|---|---|
| Harrison's Principles of Internal Medicine (22nd ed.) | 2.5:1 (range 2:1 to 5:1) |
| Tietz Textbook of Laboratory Medicine (7th ed.) | 1.5:1 to 4:1 |
| Creasy & Resnik's Maternal-Fetal Medicine | ~3:1 |
| Pathology Student / General reference | 2:1 to 4:1 |
The commonly cited normal range is 2:1 to 4:1, with 3:1 often given as the typical value. Because myeloid cells are the most abundant cell type in normal marrow, they naturally outnumber erythroid precursors.
Normal Bone Marrow Differential (for reference)
| Cell Type | Normal Range (%) |
|---|---|
| Myeloblasts | 0-3% |
| Promyelocytes | 1-8% |
| Myelocytes | 10-15% |
| Metamyelocytes | 10-15% |
| Bands + Segmented neutrophils | 12-25% |
| Eosinophils & precursors | 1-5% |
| Basophils & precursors | 0-1% |
| Monocytes | 0-2% |
| Lymphocytes | 10-15% |
| Plasma cells | 0-1% |
(Tietz Textbook of Laboratory Medicine, 7th ed.)
Clinical Interpretation
Increased M:E ratio (> 4:1 or > 5:1) - Myeloid hyperplasia or erythroid hypoplasia:
- Infections / reactive leukocytosis (bone marrow responding to bacterial infection)
- Chronic myeloid leukemia (CML) and other myeloproliferative neoplasms
- Pure red cell aplasia (erythroid precursors are markedly reduced)
- Leukemoid reactions
Decreased M:E ratio (< 2:1 or near 1:1) - Erythroid hyperplasia or myeloid hypoplasia:
- Acute/chronic blood loss with compensatory erythropoiesis
- Hemolytic anemias (bone marrow compensating - M:E ~1:1)
- Iron deficiency anemia with erythroid hyperplasia
- Megaloblastic anemia (increased nucleated RBC precursors)
- Polycythemia vera (erythroid hyperplasia)
- Myelodysplastic syndrome (MDS) with erythroid predominance
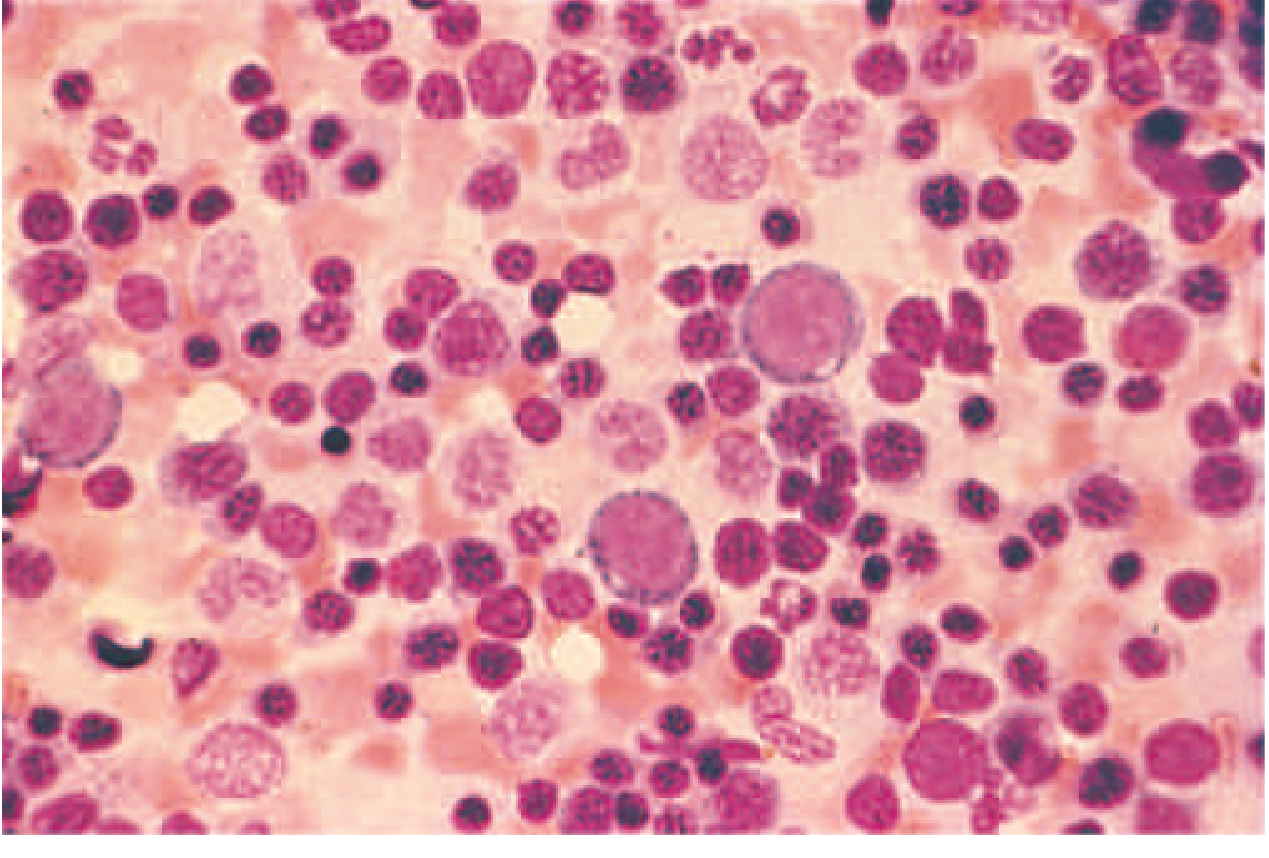
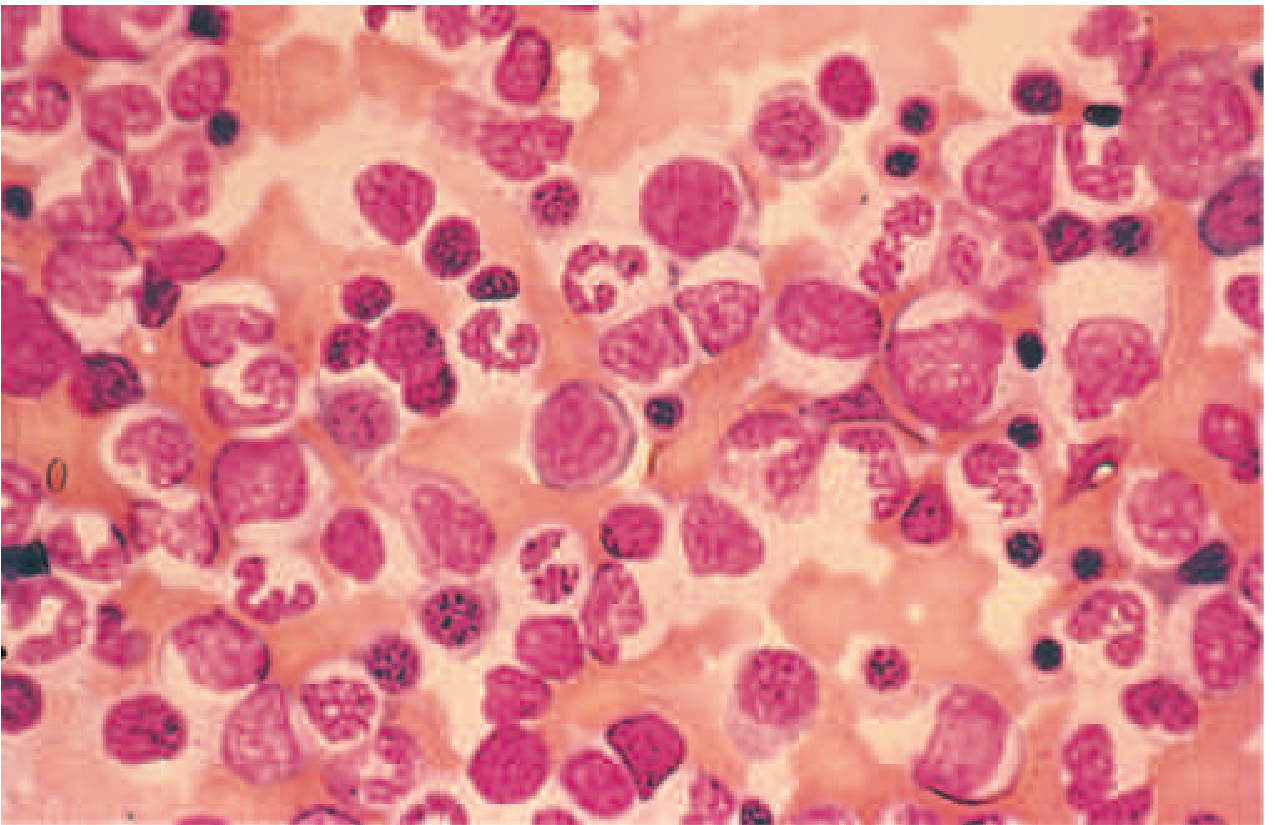
Bone Marrow Images from Harrison's (22nd Ed.)
Erythroid Hyperplasia - M:E ratio ~1:1 (increased erythroid fraction, as seen in response to blood loss or hemolysis):
Myeloid Hyperplasia - M:E ratio >3:1 (increased myeloid fraction, as seen in response to infection):
Key Points
- The M:E ratio is reported as part of bone marrow aspiration differential counts.
- It is not obtained from peripheral blood - it requires direct bone marrow sampling.
- The ratio gives a quick snapshot of whether the marrow is "shifted" toward making more white cells (infection, leukemia) or more red cells (blood loss, hemolysis).
- Normal cellularity of bone marrow is ~50% cellular (roughly equal parts hematopoietic cells and fat cells), and this changes with age.
(Harrison's Principles of Internal Medicine, 22nd ed.; Tietz Textbook of Laboratory Medicine, 7th ed.)
This is a shared conversation. Sign in to Orris to start your own chat.