
Define Incidence and Prevalence. Explain attack rate and secondary attack rate, Point Prevalence and Period Prevalence. Write uses of Incidence and Prevalence.
Reading File
Now let me search the medical library for these epidemiology topics in parallel.
Finding Sources
Finding Sources
Park's Textbook of Preventive and Social Medicine is the key source. Let me pull all relevant sections in parallel.
Finding Sources
Reading File
Reading File
Excellent. Now let me read the key sections on incidence, prevalence (definitions, point/period), and uses.
Reading File
Reading File
Let me read the rest - period prevalence, uses of prevalence, and the incidence definition sections.
Reading File
Finding Sources
Now let me get the incidence definition and the uses of prevalence sections.
Finding Sources
Reading File
Now let me get the INCIDENCE definition section and uses of prevalence:
Reading File
Reading File
Also let me get the secondary attack rate full content from block 2:
Reading File
I now have all the content needed. Let me fetch the two diagrams for the response.
Loading Image
Loading Image
I now have all the content and images needed. Here is the complete, detailed answer:
Incidence and Prevalence - Epidemiological Measures
(Source: Park's Textbook of Preventive and Social Medicine)
1. INCIDENCE
Definition: Incidence rate is defined as "the number of NEW cases occurring in a defined population during a specified period of time."
Formula:
$$\text{Incidence Rate} = \frac{\text{Number of new cases of specific disease during a given time period}}{\text{Population at risk during that period}} \times 1000$$
Example: If there are 500 new cases of an illness in a population of 30,000 in a year:
Incidence = 500/30,000 × 1000 = 16.7 per 1,000 per year
Note: The time unit must always be included (e.g., "per year"). Writing "16.7 per 1,000" alone is incomplete.
Key features of incidence:
- Refers only to new cases
- Measured during a given period (usually one year)
- Refers to a specified population at risk
- Can also refer to new spells/episodes of a disease (e.g., repeated colds in one person count as separate spells)
- Measures the rate at which new cases are occurring
- Not influenced by the duration of disease
- Generally used for acute conditions
2. SPECIAL INCIDENCE RATES
a. Attack Rate
An attack rate is an incidence rate (usually expressed as a percentage), used only when the population is exposed to risk for a limited period of time, such as during an epidemic. It relates the number of cases in the population at risk and reflects the extent of the epidemic.
Formula:
$$\text{Attack Rate} = \frac{\text{Number of new cases of a specified disease during a specified time interval}}{\text{Total population at risk during the same interval}} \times 100$$
- It is essentially a short-term, time-limited incidence rate
- Used in outbreak investigations (e.g., food poisoning outbreaks)
- Expressed as a percentage rather than per 1,000
b. Secondary Attack Rate (SAR)
Definition: SAR is defined as "the number of exposed persons developing the disease within the range of the incubation period, following exposure to the primary case."
Formula:
$$\text{SAR} = \frac{\text{Number of exposed persons developing the disease within the incubation period}}{\text{Total number of exposed/"susceptible" contacts}} \times 100$$
Important notes about the denominator and numerator:
- The denominator consists of all persons exposed to the primary case
- It may be restricted to "susceptible" contacts only if immune persons can be identified
- The primary case is excluded from both the numerator and the denominator
Example: In a family of 6 - 2 immune parents and 4 susceptible children - one child is the primary case. Within the incubation period, 2 more children develop the disease.
SAR = 2/3 = 66.6% (primary case excluded; immune parents excluded)
Limitations of SAR:
- Best applied to diseases where the primary case is infective for only a short period (e.g., measles, chickenpox)
- For long-infective diseases (e.g., tuberculosis), exposure duration matters, so the formula uses person-weeks/months of exposure in the denominator
- Difficult to identify "susceptibles" in diseases without clear immunity history (e.g., influenza)
- Of limited meaning where numerous subclinical cases exist
Uses of SAR:
- Measures communicability of an infectious disease
- Determines whether a disease of unknown aetiology is communicable (e.g., Hodgkin's disease)
- Evaluates effectiveness of control measures such as isolation and immunization
- Can compare attack rates in vaccinated vs. unvaccinated groups across families
3. PREVALENCE
Definition: "Disease prevalence refers specifically to all current cases (old and new) existing at a given point in time, or over a period of time in a given population."
Broader definition: "The total number of all individuals who have an attribute or disease at a particular time (or during a particular period) divided by the population at risk of having the attribute or disease at this point in time or midway through the period."
Although referred to as a "rate," prevalence rate is really a ratio.
Prevalence is of two types:
(a) Point Prevalence
Definition: Point prevalence is defined as the number of all current cases (old and new) of a disease at one point in time, in relation to a defined population.
- The "point" may practically consist of a day, several days, or even a few weeks (the time it takes to survey the population)
- Can be made specific for age, sex, and other variables
- When "prevalence rate" is used without qualification, it means point prevalence
Formula:
$$\text{Point Prevalence} = \frac{\text{Number of all current cases (old and new) of a specified disease at a given point in time}}{\text{Estimated population at the same point in time}} \times 100$$
(b) Period Prevalence
Definition: Period prevalence measures the frequency of all current cases (old and new) existing during a defined period of time (e.g., annual prevalence), expressed in relation to a defined population.
- Includes cases arising before but extending into or through the period
- Also includes cases arising during the period itself
- Less commonly used than point prevalence
Formula:
$$\text{Period Prevalence} = \frac{\text{Number of existing cases (old and new) during a given period of time}}{\text{Estimated mid-interval population at risk}} \times 100$$
Visual Illustration: Incidence vs. Point/Period Prevalence
The diagram below shows 8 cases over a year (Jan 1 - Dec 31). The open circle marks the start of illness; the line shows duration.
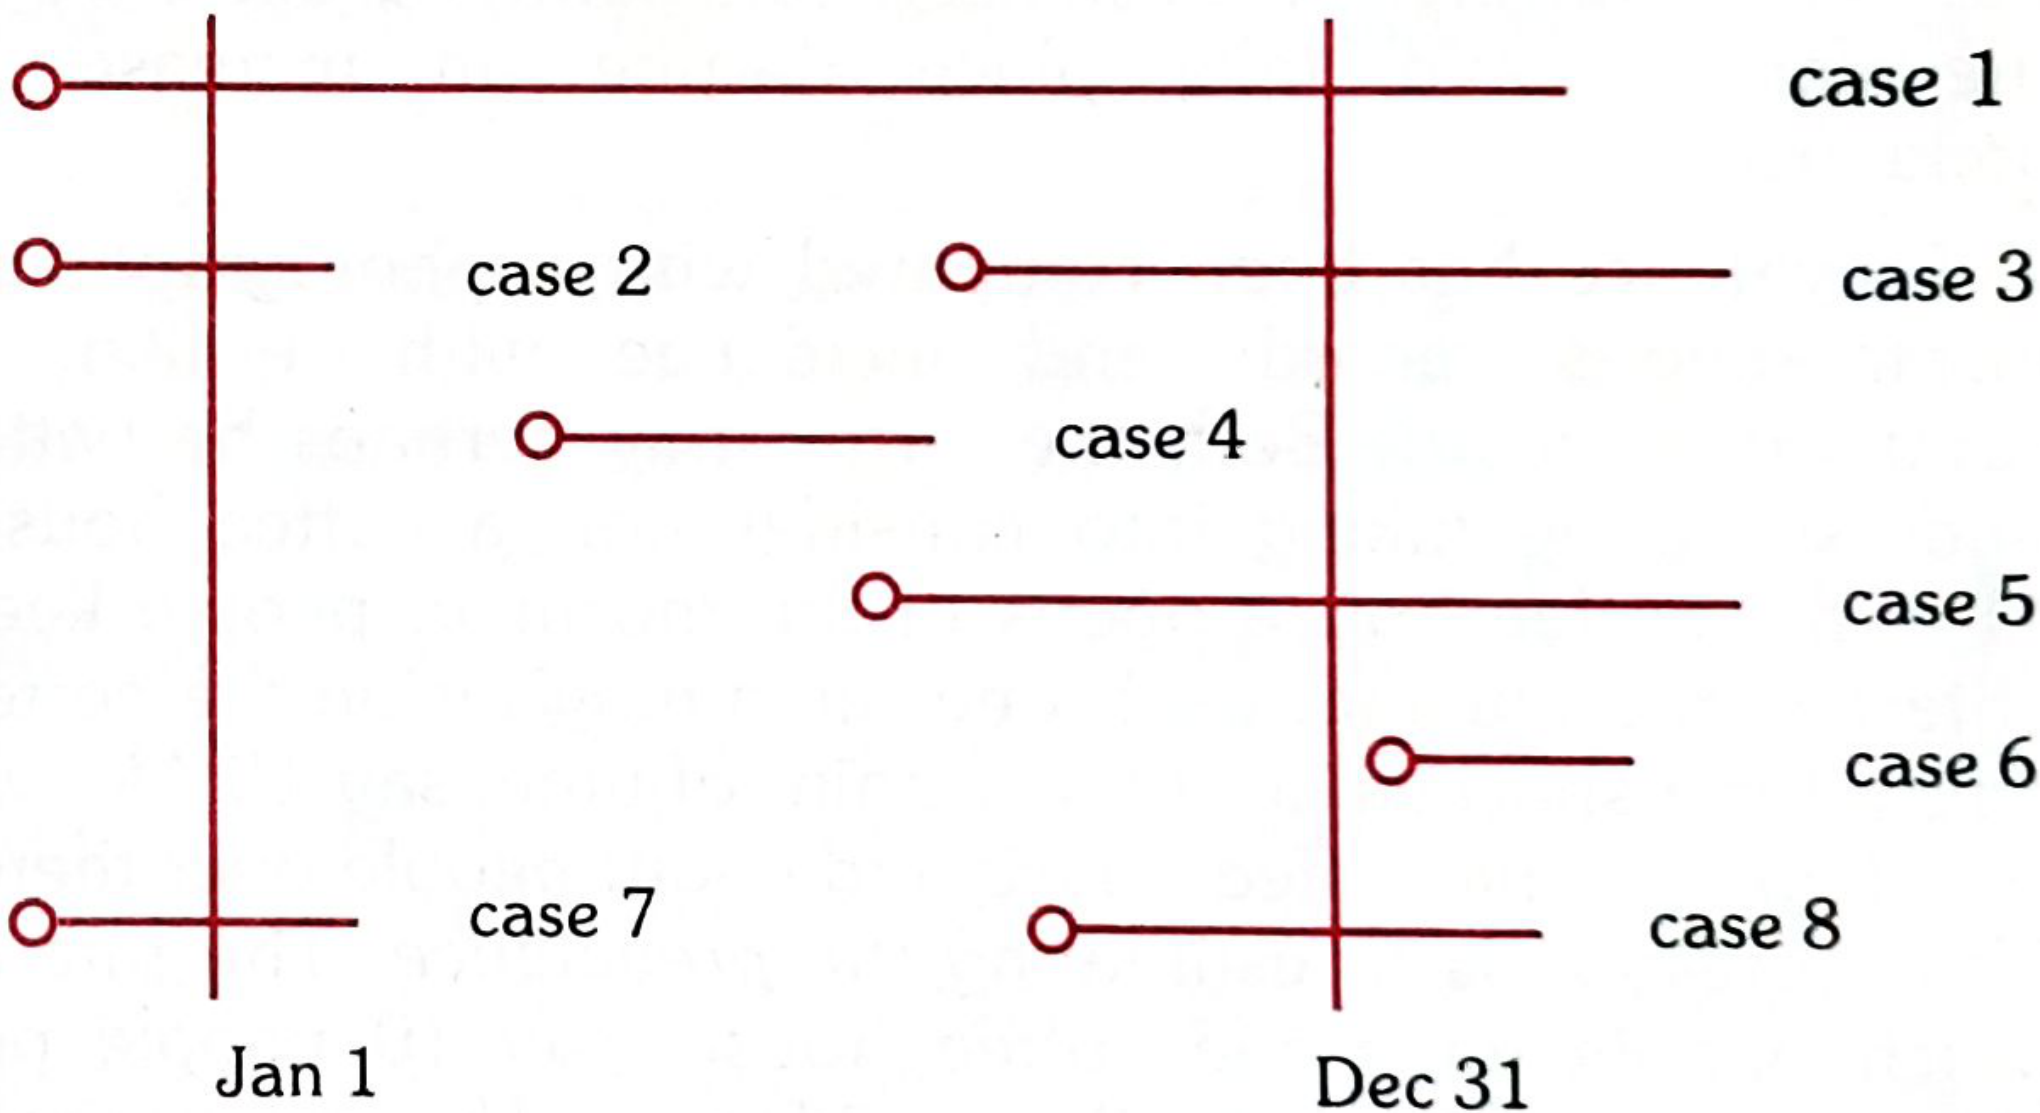
| Measure | Cases counted |
|---|---|
| Incidence (new cases during the year) | Cases 3, 4, 5, and 8 |
| Point Prevalence (Jan 1) | Cases 1, 2, and 7 |
| Point Prevalence (Dec 31) | Cases 1, 3, 5, and 8 |
| Period Prevalence (Jan-Dec) | Cases 1, 2, 3, 4, 5, 7, and 8 |
Note: Case 6 starts and ends between the two time points but is not present on either Jan 1 or Dec 31, so it is counted in period prevalence but not in either point prevalence measure.
4. RELATIONSHIP BETWEEN INCIDENCE AND PREVALENCE
$$P = I \times D$$
Where P = Prevalence, I = Incidence, D = Mean duration of disease
Example:
- Incidence = 10 cases per 1,000 population per year
- Mean duration = 5 years
- Prevalence = 10 × 5 = 50 per 1,000 population
The classic analogy: Prevalence is like a photograph (instantaneous snapshot); incidence is like a film (continuous record). In the "coffee house" analogy - counting people inside at 10 AM = prevalence; the rate at which people enter = incidence.
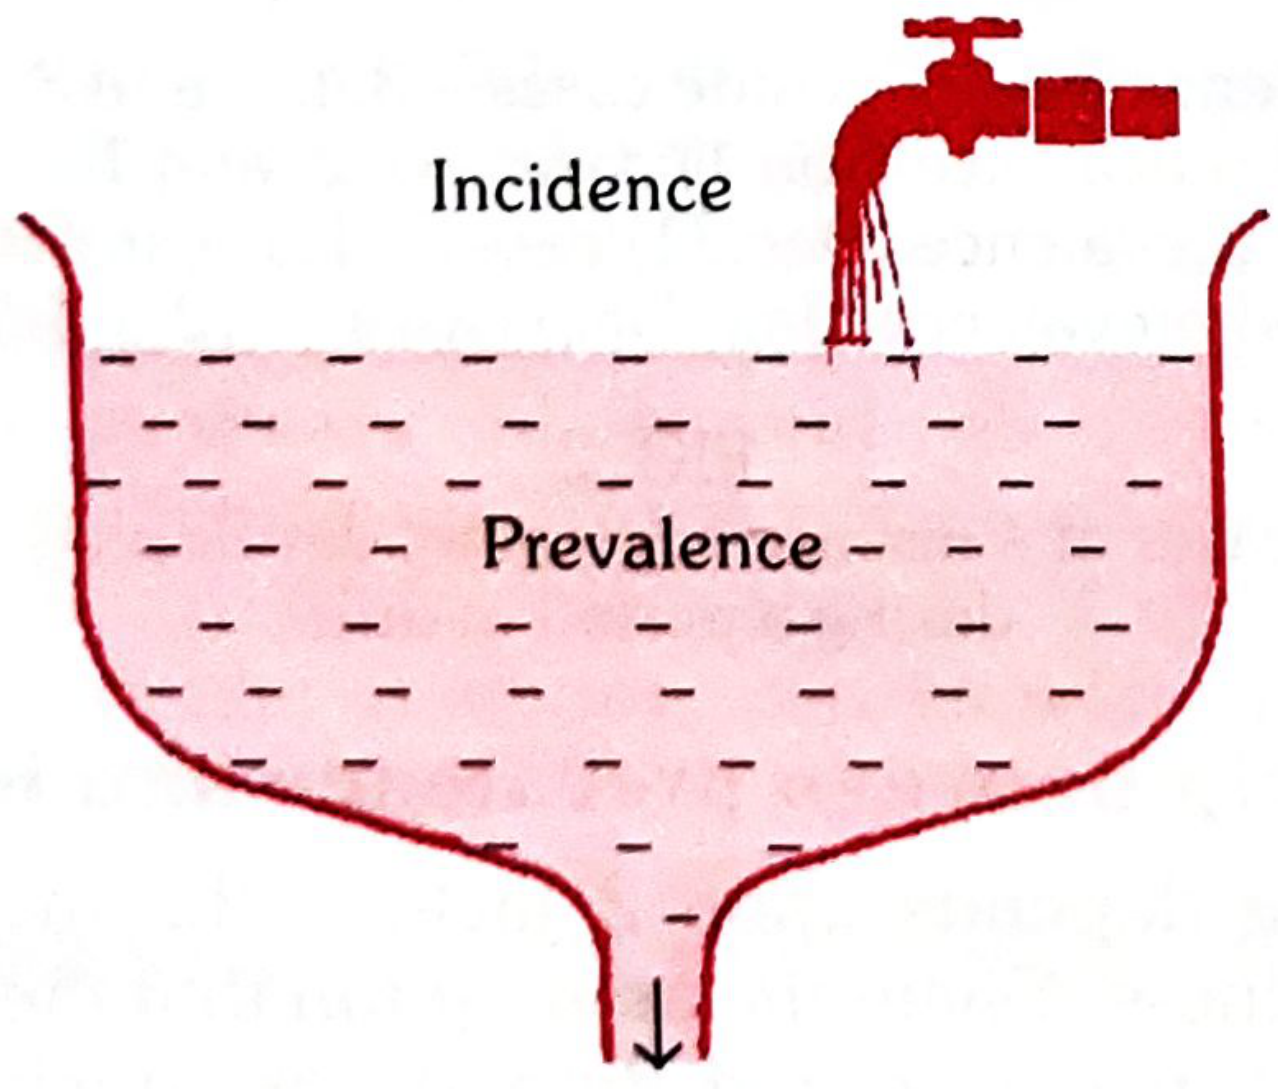
The tap (incidence) fills the pool; water drains out at the bottom through recovery or death (reduction in prevalence).
5. USES OF INCIDENCE RATE
- Disease control: If incidence is rising, it may indicate failure of current control programmes and signal the need for a new or intensified programme
- Aetiological research: Used to study causes, pathogenesis, and risk factors of disease; incidence reflects causal factors and is optimal for formulating and testing aetiological hypotheses
- Distribution studies: Analyzing differences in incidence across socio-economic groups and geographic areas provides insights into health service effectiveness
- Preventive and therapeutic efficacy: Tracks whether preventive or treatment programmes are working - a falling incidence confirms programme success
- Trend monitoring: Fluctuations in incidence may reflect changes in the agent, host, or environmental characteristics
6. USES OF PREVALENCE
- Estimating disease burden: Prevalence helps estimate the magnitude of health/disease problems in the community and identify potential high-risk populations
- Administrative and planning purposes: Prevalence rates are especially useful for planning - estimating hospital bed requirements, manpower needs, rehabilitation facilities, and budgeting for health services
- Cross-sectional studies: Prevalence forms the basis of cross-sectional (prevalence) studies, screening programmes, and health surveys
Limitation of prevalence: It is not ideal for studying disease aetiology because two factors determine it - incidence (causal factors) AND duration (prognostic factors). A high prevalence may reflect a long-duration disease rather than a high rate of new cases. For aetiological work, incidence is preferred.
Park's Textbook of Preventive and Social Medicine, pp. 73-74
Create a summary document comparing incidence, prevalence, and attack rate with formulas and examples
Asking for Preferences
What file format do you want?
Reading File
Running Command
ls /home/daytona/workspace/ && mkdir -p /home/daytona/workspace/epidemiology-summary
Writing File
~/epidemiology-summary/generate_pdf.py
from reportlab.lib.pagesizes import A4
from reportlab.lib import colors
from reportlab.lib.styles import getSampleStyleSheet, ParagraphStyle
from reportlab.lib.units import cm, mm
from reportlab.platypus import (
    SimpleDocTemplate, Paragraph, Spacer, Table, TableStyle,
    HRFlowable, KeepTogether
)
from reportlab.lib.enums import TA_CENTER, TA_LEFT, TA_JUSTIFY
from reportlab.platypus import PageBreak

OUTPUT = "/home/daytona/workspace/epidemiology-summary/Epidemiology_Measures_Summary.pdf"

doc = SimpleDocTemplate(
    OUTPUT,
    pagesize=A4,
    leftMargin=2*cm, rightMargin=2*cm,
    topMargin=2.2*cm, bottomMargin=2*cm,
    title="Epidemiology Measures: Incidence, Prevalence & Attack Rate",
    author="Orris Medical Reference"
)

# ── Colour palette ──────────────────────────────────────────────
NAVY    = colors.HexColor("#1A3A5C")
TEAL    = colors.HexColor("#1D7A8A")
GOLD    = colors.HexColor("#E6A817")
LIGHT   = colors.HexColor("#EAF4F7")
PALE    = colors.HexColor("#F5F9FA")
WHITE   = colors.white
DARK    = colors.HexColor("#1C1C1C")
MUTED   = colors.HexColor("#555555")
GREEN   = colors.HexColor("#1E7E4A")
ORANGE  = colors.HexColor("#C75000")
PURPLE  = colors.HexColor("#5B2D8E")

styles = getSampleStyleSheet()

# ── Custom styles ────────────────────────────────────────────────
def S(name, **kw):
    return ParagraphStyle(name, **kw)

style_doc_title = S("DocTitle",
    fontSize=22, fontName="Helvetica-Bold",
    textColor=WHITE, alignment=TA_CENTER, leading=28)

style_doc_sub = S("DocSub",
    fontSize=11, fontName="Helvetica",
    textColor=colors.HexColor("#BEE0EA"), alignment=TA_CENTER, leading=16)

style_section = S("Section",
    fontSize=14, fontName="Helvetica-Bold",
    textColor=WHITE, alignment=TA_LEFT, leading=20)

style_subsection = S("Subsection",
    fontSize=11, fontName="Helvetica-Bold",
    textColor=NAVY, leading=16)

style_body = S("Body",
    fontSize=9.5, fontName="Helvetica",
    textColor=DARK, leading=14, alignment=TA_JUSTIFY)

style_formula_label = S("FormulaLabel",
    fontSize=9, fontName="Helvetica-Bold",
    textColor=TEAL, leading=13)

style_formula = S("Formula",
    fontSize=9.5, fontName="Courier-Bold",
    textColor=NAVY, leading=14, leftIndent=10)

style_note = S("Note",
    fontSize=8.5, fontName="Helvetica-Oblique",
    textColor=MUTED, leading=13, leftIndent=8)

style_bullet = S("Bullet",
    fontSize=9.5, fontName="Helvetica",
    textColor=DARK, leading=14, leftIndent=14, bulletIndent=4)

style_table_header = S("TblHdr",
    fontSize=9, fontName="Helvetica-Bold",
    textColor=WHITE, alignment=TA_CENTER, leading=13)

style_table_cell = S("TblCell",
    fontSize=8.5, fontName="Helvetica",
    textColor=DARK, alignment=TA_LEFT, leading=12)

style_table_cell_c = S("TblCellC",
    fontSize=8.5, fontName="Helvetica",
    textColor=DARK, alignment=TA_CENTER, leading=12)

style_example_title = S("ExTitle",
    fontSize=9.5, fontName="Helvetica-Bold",
    textColor=GREEN, leading=14)

style_example_body = S("ExBody",
    fontSize=9, fontName="Helvetica",
    textColor=DARK, leading=13, leftIndent=8)

style_footer = S("Footer",
    fontSize=7.5, fontName="Helvetica-Oblique",
    textColor=MUTED, alignment=TA_CENTER, leading=11)

# ── Helpers ──────────────────────────────────────────────────────
W = 17*cm  # usable width

def section_header(text, color=NAVY):
    data = [[Paragraph(text, style_section)]]
    t = Table(data, colWidths=[W])
    t.setStyle(TableStyle([
        ("BACKGROUND", (0,0), (-1,-1), color),
        ("TOPPADDING",    (0,0), (-1,-1), 7),
        ("BOTTOMPADDING", (0,0), (-1,-1), 7),
        ("LEFTPADDING",   (0,0), (-1,-1), 10),
        ("RIGHTPADDING",  (0,0), (-1,-1), 10),
        ("ROUNDEDCORNERS", [4, 4, 4, 4]),
    ]))
    return t

def formula_box(label, formula_lines, note=None, bg=LIGHT):
    content = [Paragraph(label, style_formula_label)]
    for line in formula_lines:
        content.append(Paragraph(line, style_formula))
    if note:
        content.append(Paragraph(note, style_note))
    data = [[content]]
    t = Table(data, colWidths=[W - 0.4*cm])
    t.setStyle(TableStyle([
        ("BACKGROUND", (0,0), (-1,-1), bg),
        ("TOPPADDING",    (0,0), (-1,-1), 8),
        ("BOTTOMPADDING", (0,0), (-1,-1), 8),
        ("LEFTPADDING",   (0,0), (-1,-1), 10),
        ("RIGHTPADDING",  (0,0), (-1,-1), 10),
        ("BOX", (0,0), (-1,-1), 1, TEAL),
        ("LINEBELOW", (0,0), (-1,0), 0, colors.transparent),
    ]))
    return t

def example_box(title, lines, bg=colors.HexColor("#F0FAF2")):
    content = [Paragraph(title, style_example_title)]
    for l in lines:
        content.append(Paragraph(l, style_example_body))
    data = [[content]]
    t = Table(data, colWidths=[W - 0.4*cm])
    t.setStyle(TableStyle([
        ("BACKGROUND", (0,0), (-1,-1), bg),
        ("TOPPADDING",    (0,0), (-1,-1), 7),
        ("BOTTOMPADDING", (0,0), (-1,-1), 7),
        ("LEFTPADDING",   (0,0), (-1,-1), 10),
        ("RIGHTPADDING",  (0,0), (-1,-1), 10),
        ("BOX", (0,0), (-1,-1), 1, GREEN),
    ]))
    return t

def sp(n=6):
    return Spacer(1, n)

def bullet(text):
    return Paragraph(f"• {text}", style_bullet)

# ═══════════════════════════════════════════════════════════════
# BUILD STORY
# ═══════════════════════════════════════════════════════════════
story = []

# ── COVER HEADER ─────────────────────────────────────────────────
cover_data = [[
    Paragraph("Epidemiology Measures", style_doc_title),
    Paragraph("Incidence · Prevalence · Attack Rate", style_doc_sub),
    Paragraph("Formulas, Definitions, Examples & Comparison", style_doc_sub),
]]
cover_t = Table([[Paragraph("Epidemiology Measures", style_doc_title)],
                 [Paragraph("Incidence · Prevalence · Attack Rate", style_doc_sub)],
                 [Paragraph("Formulas, Definitions, Examples & Comparison", style_doc_sub)]],
                colWidths=[W])
cover_t.setStyle(TableStyle([
    ("BACKGROUND", (0,0), (-1,-1), NAVY),
    ("TOPPADDING",    (0,0), (-1,-1), 12),
    ("BOTTOMPADDING", (0,0), (-1,-1), 12),
    ("LEFTPADDING",   (0,0), (-1,-1), 14),
    ("RIGHTPADDING",  (0,0), (-1,-1), 14),
]))
story.append(cover_t)
story.append(sp(10))

intro = ("This document provides a concise, exam-ready reference on the key epidemiological "
         "measures of disease frequency: Incidence Rate, Prevalence (Point and Period), "
         "Attack Rate, and Secondary Attack Rate. Each measure is defined, its formula given, "
         "worked examples provided, and practical uses summarised. "
         "A comparative summary table is included at the end.")
story.append(Paragraph(intro, style_body))
story.append(sp(12))

# ═══════════════════════════════════════════════════════════════
# SECTION 1 - INCIDENCE
# ═══════════════════════════════════════════════════════════════
story.append(section_header("1.  Incidence Rate", NAVY))
story.append(sp(8))

story.append(Paragraph("Definition", style_subsection))
story.append(sp(3))
story.append(Paragraph(
    "Incidence rate is defined as <b>\"the number of NEW cases occurring in a defined "
    "population during a specified period of time\"</b> (Park's Textbook of Preventive "
    "and Social Medicine). It measures the <i>rate</i> at which new disease events occur "
    "in a population at risk.", style_body))
story.append(sp(8))

story.append(formula_box(
    "FORMULA",
    [
        "                  Number of NEW cases of disease in a given time period",
        "Incidence Rate =  ─────────────────────────────────────────────────────  × 1000",
        "                       Population at risk during that time period",
    ],
    note="Note: The time unit MUST be included (e.g. per 1,000 per year). Omitting it is incorrect."
))
story.append(sp(8))

story.append(Paragraph("Key Characteristics", style_subsection))
story.append(sp(3))
story.append(bullet("Counts <b>new cases only</b> - existing (old) cases are excluded"))
story.append(bullet("Requires a defined time period (usually one year)"))
story.append(bullet("Denominator is the <b>population at risk</b>"))
story.append(bullet("Can count disease <b>spells/episodes</b> (e.g. repeated colds in one person)"))
story.append(bullet("Not influenced by disease duration"))
story.append(bullet("Best suited for <b>acute conditions</b>"))
story.append(sp(8))

story.append(example_box(
    "Worked Example",
    [
        "500 new cases of malaria in a population of 30,000 over one year.",
        "",
        "Incidence Rate = (500 ÷ 30,000) × 1,000 = <b>16.7 per 1,000 per year</b>",
        "",
        "Interpretation: For every 1,000 people at risk, approximately 17 new cases of",
        "malaria occurred during the year."
    ]
))
story.append(sp(8))

story.append(Paragraph("Uses of Incidence Rate", style_subsection))
story.append(sp(3))
story.append(bullet("Monitor effectiveness of disease <b>control programmes</b> (rising rate = failure; falling rate = success)"))
story.append(bullet("Study disease <b>aetiology and causation</b> - incidence reflects causal factors"))
story.append(bullet("Track disease <b>trends</b> over time and across geographic areas"))
story.append(bullet("Evaluate <b>preventive and therapeutic</b> programme efficacy"))
story.append(bullet("Identify changes in agent, host, or environmental characteristics"))
story.append(sp(14))

# ═══════════════════════════════════════════════════════════════
# SECTION 2 - PREVALENCE
# ═══════════════════════════════════════════════════════════════
story.append(section_header("2.  Prevalence", TEAL))
story.append(sp(8))

story.append(Paragraph("Definition", style_subsection))
story.append(sp(3))
story.append(Paragraph(
    "Prevalence refers to <b>all current cases (old and new)</b> of a disease existing at "
    "a given point in time, or over a period of time, in a given population. Although "
    "called a 'rate', prevalence is technically a <b>ratio</b>. It is determined by two "
    "factors: <b>incidence</b> and <b>duration of illness</b>.", style_body))
story.append(sp(10))

# 2a - Point Prevalence
story.append(Paragraph("2a.  Point Prevalence", style_subsection))
story.append(sp(3))
story.append(Paragraph(
    "The number of all current cases (old and new) of a disease at <b>one specific point "
    "in time</b>, expressed per defined population. When 'prevalence rate' is used without "
    "qualification, point prevalence is implied.", style_body))
story.append(sp(6))

story.append(formula_box(
    "FORMULA — Point Prevalence",
    [
        "                      Number of ALL current cases (old + new) at a given point in time",
        "Point Prevalence =    ─────────────────────────────────────────────────────────────────  × 100",
        "                               Estimated population at the same point in time",
    ],
    bg=colors.HexColor("#EAF4F7")
))
story.append(sp(6))

story.append(example_box(
    "Worked Example — Point Prevalence",
    [
        "On 1 January, a survey finds 200 people with diabetes in a town of 10,000.",
        "",
        "Point Prevalence = (200 ÷ 10,000) × 100 = <b>2.0%</b>",
        "",
        "Interpretation: At that specific moment, 2 in every 100 residents had diabetes."
    ]
))
story.append(sp(10))

# 2b - Period Prevalence
story.append(Paragraph("2b.  Period Prevalence", style_subsection))
story.append(sp(3))
story.append(Paragraph(
    "Measures the frequency of all current cases (old and new) existing <b>during a defined "
    "period</b> (e.g. a full calendar year). Includes cases that began before the period but "
    "extended into it, as well as cases arising during the period. Less commonly used than "
    "point prevalence.", style_body))
story.append(sp(6))

story.append(formula_box(
    "FORMULA — Period Prevalence",
    [
        "                       Number of existing cases (old + new) during a given time period",
        "Period Prevalence =    ─────────────────────────────────────────────────────────────────  × 100",
        "                                  Estimated mid-period population at risk",
    ],
    bg=colors.HexColor("#EAF4F7")
))
story.append(sp(6))

story.append(example_box(
    "Worked Example — Period Prevalence",
    [
        "During January–December, 350 people had depression in a population of 10,000.",
        "This includes 80 carry-over cases from the previous year + 270 new cases.",
        "",
        "Period Prevalence = (350 ÷ 10,000) × 100 = <b>3.5%</b>",
    ]
))
story.append(sp(8))

story.append(Paragraph("Uses of Prevalence", style_subsection))
story.append(sp(3))
story.append(bullet("Estimate the <b>magnitude of disease burden</b> in a community"))
story.append(bullet("Identify high-risk populations"))
story.append(bullet("<b>Administrative and planning</b> purposes: hospital beds, manpower, rehabilitation needs"))
story.append(bullet("Basis for <b>cross-sectional studies</b> and health surveys"))
story.append(bullet("Budget allocation and health service planning"))
story.append(sp(14))

# ═══════════════════════════════════════════════════════════════
# SECTION 3 - ATTACK RATE
# ═══════════════════════════════════════════════════════════════
story.append(section_header("3.  Attack Rate", colors.HexColor("#7B3A00")))
story.append(sp(8))

story.append(Paragraph("Definition", style_subsection))
story.append(sp(3))
story.append(Paragraph(
    "Attack rate is a special form of incidence rate (expressed as a <b>percentage</b>), "
    "used when a population is exposed to risk for a <b>limited period</b> - typically "
    "during an <b>epidemic or outbreak</b>. It reflects the extent of spread of the epidemic.", style_body))
story.append(sp(6))

story.append(formula_box(
    "FORMULA — Attack Rate",
    [
        "                  Number of NEW cases of a disease during a specified time interval",
        "Attack Rate =     ─────────────────────────────────────────────────────────────────  × 100",
        "                          Total population at risk during the same interval",
    ],
    note="Expressed as a percentage (%). Used for outbreaks of limited duration (days to weeks).",
    bg=colors.HexColor("#FEF3E6")
))
story.append(sp(6))

story.append(example_box(
    "Worked Example — Attack Rate",
    [
        "At a school canteen, 45 out of 180 students who ate the lunch fell ill with food poisoning.",
        "",
        "Attack Rate = (45 ÷ 180) × 100 = <b>25.0%</b>",
        "",
        "Interpretation: 25% of exposed students developed illness - suggesting a common",
        "source outbreak from that meal."
    ],
    bg=colors.HexColor("#FEF3E6")
))
story.append(sp(10))

# 3b - Secondary Attack Rate
story.append(Paragraph("3b.  Secondary Attack Rate (SAR)", style_subsection))
story.append(sp(3))
story.append(Paragraph(
    "SAR is defined as <b>\"the number of exposed persons developing the disease within "
    "the range of the incubation period, following exposure to the primary case.\"</b> "
    "It is a measure of <b>communicability</b> within a household or closed group. "
    "The <b>primary case is excluded</b> from both numerator and denominator.", style_body))
story.append(sp(6))

story.append(formula_box(
    "FORMULA — Secondary Attack Rate",
    [
        "       Number of exposed persons developing disease within the incubation period",
        "SAR =  ──────────────────────────────────────────────────────────────────────────  × 100",
        "           Total number of exposed susceptible contacts (excluding primary case)",
    ],
    bg=colors.HexColor("#FEF3E6")
))
story.append(sp(6))

story.append(example_box(
    "Worked Example — Secondary Attack Rate",
    [
        "Family of 6: 2 immune parents + 4 susceptible children.",
        "One child develops measles (primary case).",
        "Within the incubation period, 2 more children develop measles.",
        "",
        "SAR = (2 ÷ 3) × 100 = <b>66.6%</b>",
        "",
        "Denominator = 3 (remaining susceptible children; primary case and immune parents excluded).",
        "A high SAR indicates the disease is highly communicable."
    ],
    bg=colors.HexColor("#FEF3E6")
))
story.append(sp(12))

# ═══════════════════════════════════════════════════════════════
# SECTION 4 - P = I × D relationship
# ═══════════════════════════════════════════════════════════════
story.append(section_header("4.  Relationship: Prevalence = Incidence × Duration", colors.HexColor("#4A1A7A")))
story.append(sp(8))

story.append(Paragraph(
    "When a population is stable and incidence and duration are constant:", style_body))
story.append(sp(5))

story.append(formula_box(
    "KEY RELATIONSHIP",
    [
        "  P = I × D",
        "",
        "  P = Prevalence      I = Incidence Rate      D = Mean Duration of Disease",
    ],
    bg=colors.HexColor("#F3EEFF")
))
story.append(sp(6))

story.append(example_box(
    "Numerical Example",
    [
        "Incidence = 10 cases per 1,000 per year",
        "Mean duration of disease = 5 years",
        "Prevalence = 10 × 5 = 50 per 1,000 population",
        "",
        "Also: I = P ÷ D     and     D = P ÷ I",
        "",
        "Analogy: Prevalence is like a PHOTOGRAPH (snapshot); Incidence is like a FILM (continuous record).",
        "The tap (incidence) fills the pool; water drains out through recovery or death."
    ],
    bg=colors.HexColor("#F3EEFF")
))
story.append(sp(14))

# ═══════════════════════════════════════════════════════════════
# SECTION 5 - COMPARISON TABLE
# ═══════════════════════════════════════════════════════════════
story.append(section_header("5.  Comparative Summary Table", colors.HexColor("#1A3A5C")))
story.append(sp(10))

hdr = [
    Paragraph("Feature", style_table_header),
    Paragraph("Incidence Rate", style_table_header),
    Paragraph("Point Prevalence", style_table_header),
    Paragraph("Period Prevalence", style_table_header),
    Paragraph("Attack Rate", style_table_header),
    Paragraph("Secondary Attack Rate", style_table_header),
]

def c(txt): return Paragraph(txt, style_table_cell)
def cc(txt): return Paragraph(txt, style_table_cell_c)

rows = [
    hdr,
    [c("Cases counted"), c("New cases only"), c("All current cases at one time point"), c("All cases over a defined period"), c("New cases during outbreak"), c("New cases in contacts after primary case")],
    [c("Time reference"), c("Specified period (usually 1 year)"), c("Single point in time"), c("Defined time period"), c("Short epidemic period"), c("Within one incubation period")],
    [c("Denominator"), c("Population at risk"), c("Population at same time point"), c("Mid-period population at risk"), c("Total exposed population"), c("Susceptible contacts (primary case excluded)")],
    [c("Multiplier"), cc("× 1,000"), cc("× 100"), cc("× 100"), cc("× 100"), cc("× 100")],
    [c("Disease type"), c("Acute conditions"), c("Chronic conditions"), c("Both acute and chronic"), c("Epidemic / outbreak"), c("Infectious diseases")],
    [c("Main use"), c("Aetiology, trends, programme evaluation"), c("Planning health services"), c("Mental health, chronic disease surveys"), c("Outbreak investigation"), c("Measuring communicability")],
    [c("Influenced by duration?"), cc("No"), cc("Yes"), cc("Yes"), cc("No"), cc("No")],
    [c("Analogy"), c("Flow rate of a tap"), c("Snapshot / photograph"), c("Album of photos over a year"), c("Flash flood rate"), c("Ripple spread in a pond")],
]

col_w = [3.0*cm, 2.8*cm, 2.8*cm, 2.8*cm, 2.5*cm, 3.1*cm]
comp_table = Table(rows, colWidths=col_w, repeatRows=1)
comp_table.setStyle(TableStyle([
    # Header
    ("BACKGROUND",     (0, 0), (-1, 0), NAVY),
    ("TEXTCOLOR",      (0, 0), (-1, 0), WHITE),
    ("FONTNAME",       (0, 0), (-1, 0), "Helvetica-Bold"),
    ("FONTSIZE",       (0, 0), (-1, 0), 8),
    ("ALIGN",          (0, 0), (-1, 0), "CENTER"),
    ("VALIGN",         (0, 0), (-1, -1), "MIDDLE"),
    # Alternating rows
    ("BACKGROUND",     (0, 1), (-1, 1), PALE),
    ("BACKGROUND",     (0, 2), (-1, 2), WHITE),
    ("BACKGROUND",     (0, 3), (-1, 3), PALE),
    ("BACKGROUND",     (0, 4), (-1, 4), WHITE),
    ("BACKGROUND",     (0, 5), (-1, 5), PALE),
    ("BACKGROUND",     (0, 6), (-1, 6), WHITE),
    ("BACKGROUND",     (0, 7), (-1, 7), PALE),
    ("BACKGROUND",     (0, 8), (-1, 8), WHITE),
    # Row label column highlight
    ("BACKGROUND",     (0, 1), (0, -1), colors.HexColor("#D6EAF0")),
    ("FONTNAME",       (0, 1), (0, -1), "Helvetica-Bold"),
    ("FONTSIZE",       (0, 1), (0, -1), 8),
    # Grid
    ("GRID",           (0, 0), (-1, -1), 0.4, colors.HexColor("#AACDD6")),
    ("TOPPADDING",     (0, 0), (-1, -1), 5),
    ("BOTTOMPADDING",  (0, 0), (-1, -1), 5),
    ("LEFTPADDING",    (0, 0), (-1, -1), 4),
    ("RIGHTPADDING",   (0, 0), (-1, -1), 4),
    ("FONTSIZE",       (0, 1), (-1, -1), 8),
]))
story.append(comp_table)
story.append(sp(14))

# ═══════════════════════════════════════════════════════════════
# SECTION 6 - QUICK REFERENCE CARD
# ═══════════════════════════════════════════════════════════════
story.append(section_header("6.  Quick Reference: All Formulas at a Glance", TEAL))
story.append(sp(8))

formulas = [
    ("Incidence Rate",         "New cases ÷ Population at risk × 1,000",              "per 1,000 per year"),
    ("Point Prevalence",       "All current cases at one point ÷ Population × 100",   "% at that instant"),
    ("Period Prevalence",      "All cases during period ÷ Mid-period population × 100","% over the period"),
    ("Attack Rate",            "New cases during outbreak ÷ Exposed population × 100","% in an epidemic"),
    ("Secondary Attack Rate",  "New cases in contacts ÷ Susceptible contacts × 100",  "% communicability"),
    ("Prevalence Formula",     "P = Incidence (I) × Mean Duration (D)",               "for stable population"),
]

f_hdr = [Paragraph("Measure", style_table_header),
         Paragraph("Formula", style_table_header),
         Paragraph("Result Unit", style_table_header)]
f_rows = [f_hdr]
for i, (m, f, u) in enumerate(formulas):
    bg = PALE if i % 2 == 0 else WHITE
    f_rows.append([
        Paragraph(f"<b>{m}</b>", style_table_cell),
        Paragraph(f, style_formula),
        Paragraph(u, style_table_cell_c),
    ])

f_table = Table(f_rows, colWidths=[4.5*cm, 9.0*cm, 3.5*cm], repeatRows=1)
f_table.setStyle(TableStyle([
    ("BACKGROUND",    (0, 0), (-1, 0), TEAL),
    ("TEXTCOLOR",     (0, 0), (-1, 0), WHITE),
    ("BACKGROUND",    (0, 1), (-1, 1), PALE),
    ("BACKGROUND",    (0, 2), (-1, 2), WHITE),
    ("BACKGROUND",    (0, 3), (-1, 3), PALE),
    ("BACKGROUND",    (0, 4), (-1, 4), WHITE),
    ("BACKGROUND",    (0, 5), (-1, 5), PALE),
    ("BACKGROUND",    (0, 6), (-1, 6), WHITE),
    ("GRID",          (0, 0), (-1, -1), 0.4, colors.HexColor("#AACDD6")),
    ("VALIGN",        (0, 0), (-1, -1), "MIDDLE"),
    ("TOPPADDING",    (0, 0), (-1, -1), 6),
    ("BOTTOMPADDING", (0, 0), (-1, -1), 6),
    ("LEFTPADDING",   (0, 0), (-1, -1), 6),
    ("RIGHTPADDING",  (0, 0), (-1, -1), 6),
]))
story.append(f_table)
story.append(sp(14))

# ═══════════════════════════════════════════════════════════════
# FOOTER / SOURCE
# ═══════════════════════════════════════════════════════════════
story.append(HRFlowable(width=W, thickness=0.5, color=colors.HexColor("#AACDD6")))
story.append(sp(5))
story.append(Paragraph(
    "Source: Park's Textbook of Preventive and Social Medicine (PSM) · "
    "Generated by Orris Medical Reference · July 2026",
    style_footer))

# ── Build ────────────────────────────────────────────────────────
doc.build(story)
print(f"PDF created: {OUTPUT}")
Running Command
python3 /home/daytona/workspace/epidemiology-summary/generate_pdf.py
Running Command
ls -lh /home/daytona/workspace/epidemiology-summary/
Your PDF is ready to download:
Epidemiology Measures Summary
PDF Document · PDF
Here is what the document includes:
Section 1 - Incidence Rate
- Definition, formula (× 1,000), worked example (16.7 per 1,000/year), key characteristics, and uses
Section 2 - Prevalence
- Point prevalence (definition, formula × 100, worked example) and Period prevalence (definition, formula, worked example), plus uses of prevalence
Section 3 - Attack Rate & Secondary Attack Rate
- Both definitions and formulas with worked examples (food poisoning outbreak = 25%; measles household SAR = 66.6%)
Section 4 - P = I × D Relationship
- The key prevalence-incidence-duration formula with a numerical example and the "tap and pool" analogy
Section 5 - Comparative Summary Table
- Side-by-side comparison of all five measures across: cases counted, time reference, denominator, multiplier, disease type, main use, and influence of duration
Section 6 - Quick Reference Card
- All formulas on one table for rapid revision
Define Incidence and Prevalence. Explain attack rate and secondary attack rate, Point Prevalence and Period Prevalence. Write uses of Incidence and Prevalence.
The answer to this question was covered in full detail just above in this conversation. Here is the complete response again for reference:
Incidence and Prevalence - Epidemiological Measures
(Source: Park's Textbook of Preventive and Social Medicine)
1. INCIDENCE
Definition: Incidence rate is defined as "the number of NEW cases occurring in a defined population during a specified period of time."
Formula:
$$\text{Incidence Rate} = \frac{\text{Number of new cases of specific disease during a given time period}}{\text{Population at risk during that period}} \times 1000$$
Example: 500 new cases in a population of 30,000 in one year:
Incidence = 500/30,000 × 1000 = 16.7 per 1,000 per year
The time unit must always be stated. Writing "16.7 per 1,000" alone is incorrect.
Key features:
- Counts new cases only - existing (old) cases are excluded
- Requires a defined time period (usually one year)
- Denominator is the population at risk
- Can count disease spells/episodes (e.g., repeated colds in one person)
- Not influenced by duration of disease
- Generally used for acute conditions
2. SPECIAL INCIDENCE RATES
a. Attack Rate
An attack rate is an incidence rate (expressed as a percentage), used only when the population is exposed to risk for a limited period of time, such as during an epidemic. It reflects the extent of the epidemic.
Formula:
$$\text{Attack Rate} = \frac{\text{Number of new cases during a specified time interval}}{\text{Total population at risk during the same interval}} \times 100$$
- Used in outbreak investigations (e.g., food poisoning)
- Expressed as a percentage rather than per 1,000
- Short-term, time-limited form of incidence
b. Secondary Attack Rate (SAR)
Definition: SAR is defined as "the number of exposed persons developing the disease within the range of the incubation period, following exposure to the primary case."
Formula:
$$\text{SAR} = \frac{\text{Number of exposed persons developing disease within the incubation period}}{\text{Total number of exposed susceptible contacts}} \times 100$$
Key rules:
- Denominator = all exposed contacts; may be restricted to susceptibles only if immune persons can be identified
- The primary case is excluded from both numerator and denominator
Example: Family of 6 - 2 immune parents + 4 susceptible children. One child is the primary case (measles). Within the incubation period, 2 more children develop measles.
SAR = 2/3 × 100 = 66.6% (primary case excluded; immune parents excluded)
Limitations of SAR:
- Best applied where the primary case is infective for a short period (measles, chickenpox)
- For long-infective diseases (e.g., tuberculosis), person-weeks of exposure are used in the denominator
- Difficult to identify susceptibles in diseases without clear immunity history (e.g., influenza)
- Limited meaning when numerous subclinical cases exist
Uses of SAR:
- Measures communicability of infectious disease
- Determines whether a disease of unknown aetiology is communicable (e.g., Hodgkin's disease)
- Evaluates effectiveness of isolation and immunization programmes
- Compares attack rates in vaccinated vs. unvaccinated groups
3. PREVALENCE
Definition: Prevalence refers to all current cases (old and new) existing at a given point in time, or over a period of time, in a given population.
Broader definition: "The total number of all individuals who have an attribute or disease at a particular time (or during a particular period) divided by the population at risk of having the attribute or disease at this point in time or midway through the period."
Although called a "rate," prevalence is technically a ratio. It is determined by two factors: incidence and duration of illness.
Prevalence is of two types:
(a) Point Prevalence
Definition: The number of all current cases (old and new) of a disease at one specific point in time, in relation to a defined population.
- The "point" may practically span a day, several days, or a few weeks (time needed to survey the population)
- When "prevalence rate" is used without qualification, point prevalence is implied
- Can be made specific for age, sex, and other variables
Formula:
$$\text{Point Prevalence} = \frac{\text{Number of all current cases (old and new) at a given point in time}}{\text{Estimated population at the same point in time}} \times 100$$
(b) Period Prevalence
Definition: Measures the frequency of all current cases (old and new) existing during a defined period (e.g., annual prevalence), expressed in relation to a defined population.
- Includes cases arising before the period but extending into or through it
- Also includes cases arising during the period
- Less commonly used than point prevalence
Formula:
$$\text{Period Prevalence} = \frac{\text{Number of existing cases (old and new) during a given period of time}}{\text{Estimated mid-period population at risk}} \times 100$$
4. VISUAL ILLUSTRATION: Incidence vs. Prevalence
The diagram below shows 8 cases over a year (Jan 1 - Dec 31). The open circle = start of illness; line = duration.
| Measure | Cases Counted |
|---|---|
| Incidence (new cases during the year) | Cases 3, 4, 5, and 8 |
| Point Prevalence (Jan 1) | Cases 1, 2, and 7 |
| Point Prevalence (Dec 31) | Cases 1, 3, 5, and 8 |
| Period Prevalence (Jan-Dec) | Cases 1, 2, 3, 4, 5, 7, and 8 |
5. RELATIONSHIP BETWEEN INCIDENCE AND PREVALENCE
$$P = I \times D$$
Where P = Prevalence, I = Incidence, D = Mean Duration of Disease
Example:
- Incidence = 10 cases per 1,000 per year
- Mean duration = 5 years
- Prevalence = 10 × 5 = 50 per 1,000 population
The classic analogy: Prevalence is like a photograph (instantaneous snapshot); incidence is like a film (continuous record).
The tap (incidence) fills the pool; water drains out at the bottom through recovery or death.
6. USES OF INCIDENCE RATE
- Disease control monitoring - Rising incidence signals failure of current control programmes and prompts new interventions; falling incidence confirms programme success
- Aetiological research - Incidence reflects causal factors and is the optimal measure for formulating and testing aetiological hypotheses
- Distribution studies - Differences in incidence across socioeconomic groups and geographic areas reveal disparities in health service effectiveness
- Preventive and therapeutic efficacy - Tracks whether preventive measures or treatments are working
- Trend monitoring - Fluctuations may reflect changes in the agent, host, or environmental characteristics
7. USES OF PREVALENCE
- Estimating disease burden - Helps estimate the magnitude of health/disease problems in the community and identify high-risk populations
- Administrative and planning purposes - Especially useful for planning hospital beds, manpower requirements, rehabilitation facilities, and health service budgeting
- Cross-sectional studies and surveys - Forms the basis of health surveys and screening programmes
- Chronic disease monitoring - Better suited than incidence for long-duration conditions like diabetes, hypertension, and mental health disorders
Limitation of prevalence for aetiology: Two factors determine prevalence - incidence (causal factors) and duration (prognostic factors). A high prevalence may reflect a long-lasting disease rather than a high rate of new cases. For studying causes of disease, incidence is preferred.
Source: Park's Textbook of Preventive and Social Medicine, pp. 73-75
This is a shared conversation. Sign in to Orris to start your own chat.