
Carbohydrates detailed comprehensive notes
What context are these carbohydrate notes for? · How detailed should the notes be?
glycolysis pathway diagram biochemistry
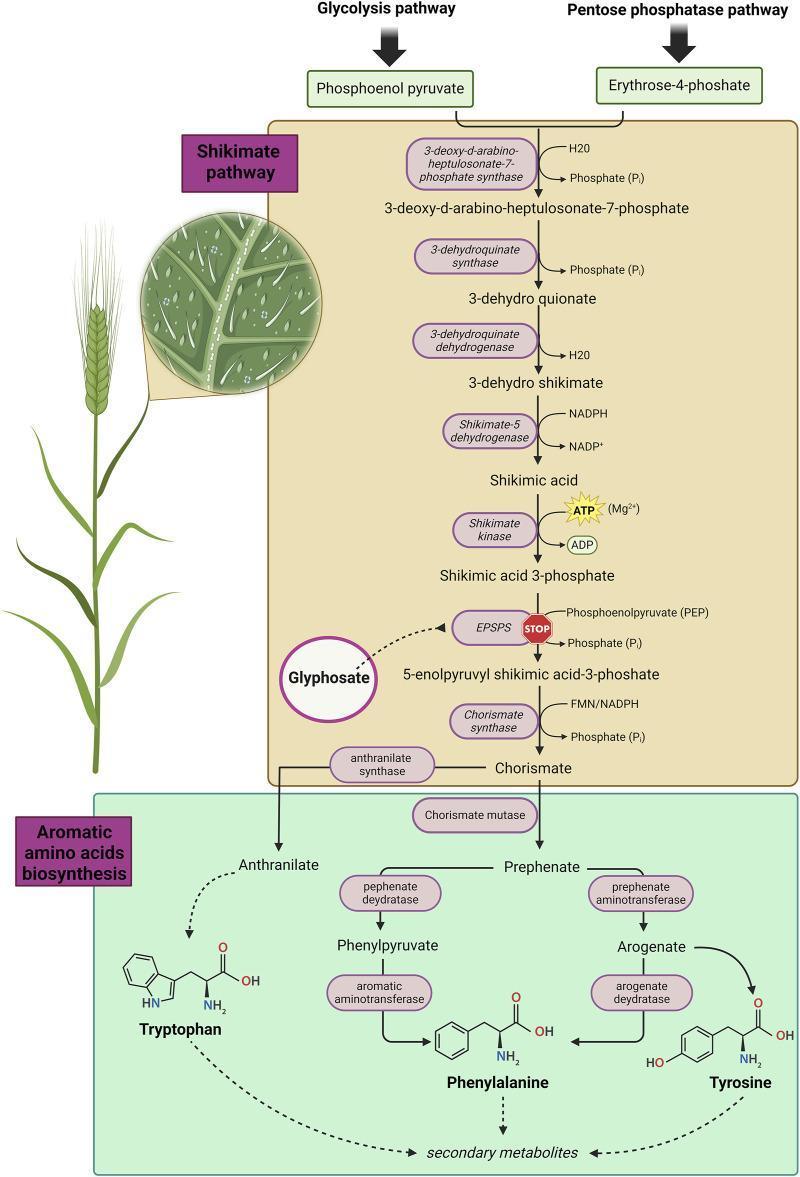
A detailed biochemical flowchart illustrating the shikimate pathway and its role in the biosynthesis of aromatic amino acids. The diagram initiates with phosphoenol pyruvate (from the glycolysis pathway) and erythrose-4-phosphate (from the pentose phosphate pathway). These precursors undergo a series of enzymatic steps involving 3-deoxy-d-arabino-heptulosonate-7-phosphate synthase, 3-dehydroquinate synthase, 3-dehydroquinate dehydrogenase, shikimate-5 dehydrogenase, and shikimate kinase to produce shikimic acid 3-phosphate. A key regulatory point is highlighted where the herbicide glyphosate inhibits the enzyme 5-enolpyruvylshikimate-3-phosphate synthase (EPSPS), indicated by a 'STOP' sign. The pathway continues to produce chorismate, which serves as the central branch point for the 'Aromatic amino acids biosynthesis' section. This downstream segment depicts the enzymatic conversion of chorismate into the essential aromatic amino acids: Tryptophan, Phenylalanine, and Tyrosine, including their chemical structures. The diagram serves as an educational tool for understanding metabolic biochemistry, enzyme inhibition, and the mechanism of action of glyphosate in preventing the synthesis of essential amino acids required for plant and microbial life.
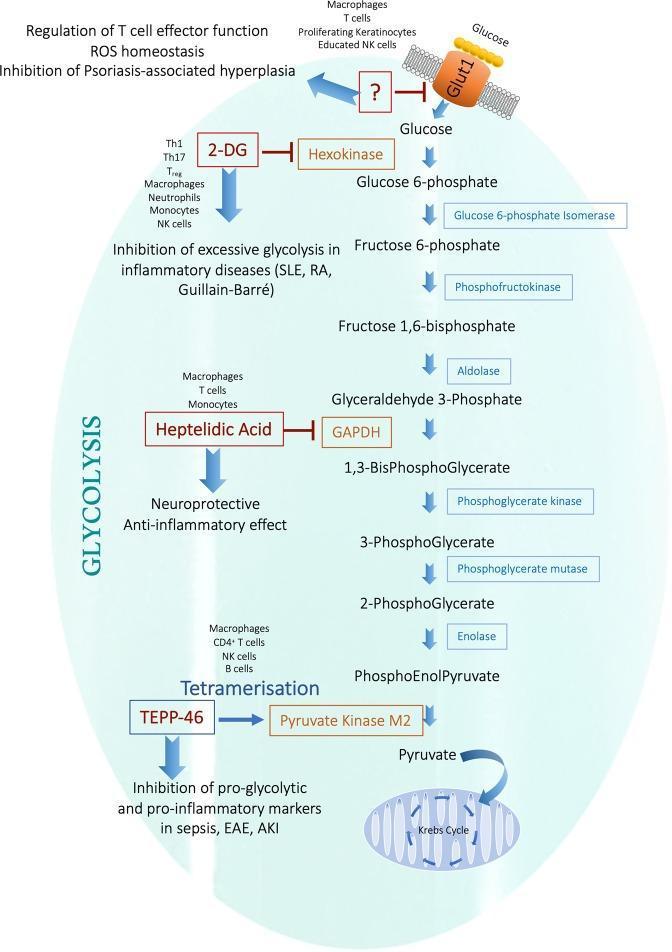
This pathophysiology diagram illustrates the glycolysis pathway as a therapeutic target for anti-inflammatory strategies. The metabolic flowchart depicts the sequence from glucose entry via the Glut1 transporter through various intermediates including glucose-6-phosphate, fructose-1,6-bisphosphate, and glyceraldehyde-3-phosphate, culminating in pyruvate entry into the Krebs cycle within the mitochondria. Key regulatory interventions are highlighted: 2-DG (2-deoxyglucose) inhibiting hexokinase to treat inflammatory diseases like SLE, RA, and Guillain-Barré; Heptelidic Acid inhibiting GAPDH for neuroprotective and anti-inflammatory effects; and TEPP-46 promoting the tetramerization of Pyruvate Kinase M2 to inhibit pro-inflammatory markers in sepsis, EAE, and AKI. The diagram identifies specific immune cell types affected by these interventions, such as Th1, Th17, macrophages, and NK cells. The educational focus is on how modulating metabolic enzymes can alter immune cell phenotype and manage systemic inflammatory conditions.
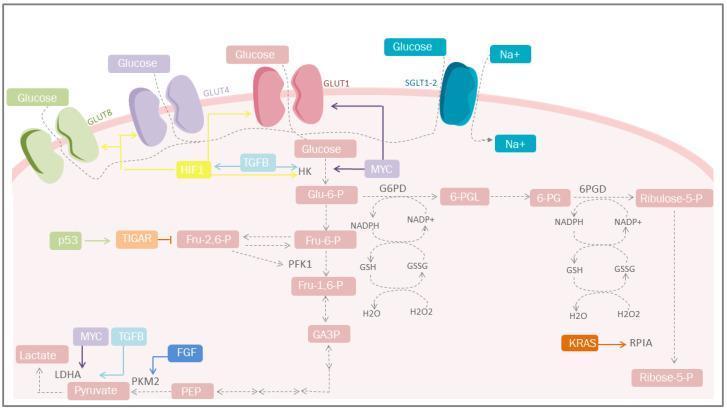
This pathophysiology diagram illustrates the metabolic reprogramming of a cell, specifically focusing on the Warburg effect and altered glucose metabolism common in cancer biology. The diagram depicts the plasma membrane featuring multiple glucose transporters, including SGLT1-2 (sodium-coupled), GLUT1, GLUT4, and GLUT8, which facilitate increased glucose uptake. The primary glycolytic pathway is shown progressing from Glucose to Glu-6-P (via HK), through Fru-6-P, Fru-1,6-P, GA3P, and PEP, ultimately leading to Pyruvate and Lactate (via LDHA). Parallel to glycolysis, the Pentose Phosphate Pathway (PPP) is detailed, converting G6P to Ribose-5-P while generating NADPH for redox homeostasis (GSH/GSSG balance) to mitigate ROS. Key regulatory mediators are highlighted: HIF-1 and MYC stimulate glucose transporters and glycolytic enzymes; TGFB and FGF influence PKM2 and LDHA activity; p53 regulates the process through TIGAR to inhibit Fru-2,6-P. The visual summarizes how oncogenic signaling (including KRAS) drives aerobic glycolysis and pentose production to support rapid cell proliferation and antioxidant defense.
carbohydrate structure monosaccharide glucose ring form
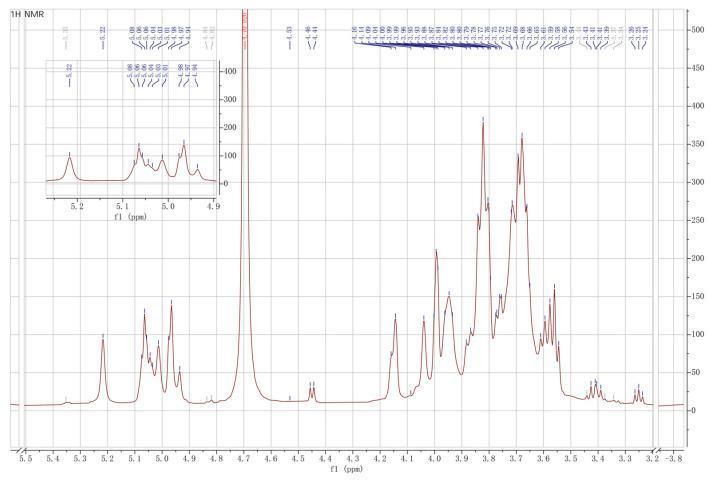
This diagnostic image displays a 1H Proton Nuclear Magnetic Resonance (NMR) spectrum used in the structural characterization of an exopolysaccharide (EPS) derived from Lacticaseibacillus plantarum. The spectrum provides biochemical data regarding the molecular structure of the carbohydrate polymer, which has clinical significance in probiotic and gut microbiome research. The horizontal axis (f1) represents chemical shifts in parts per million (ppm), ranging from approximately 3.2 to 5.5 ppm. A dominant, high-intensity peak is visible at 4.7 ppm, characteristic of a solvent peak (D2O). The anomeric region, crucial for identifying sugar residues, is expanded in an upper-left inset covering 4.9 to 5.3 ppm. This inset reveals specific resonance signals at 5.22, 5.06, 5.01, and 4.97 ppm, corresponding to anomeric protons of α-d-glucose, α-d-mannose, and β-d-galactose. The region between 3.4 and 4.2 ppm shows a complex cluster of signals representing the ring protons (H2–H6) of the monosaccharide units. This spectral fingerprint is used to determine the homogeneity and repeating unit sequence of the EPS, influencing its potential immunomodulatory and prebiotic medical applications.
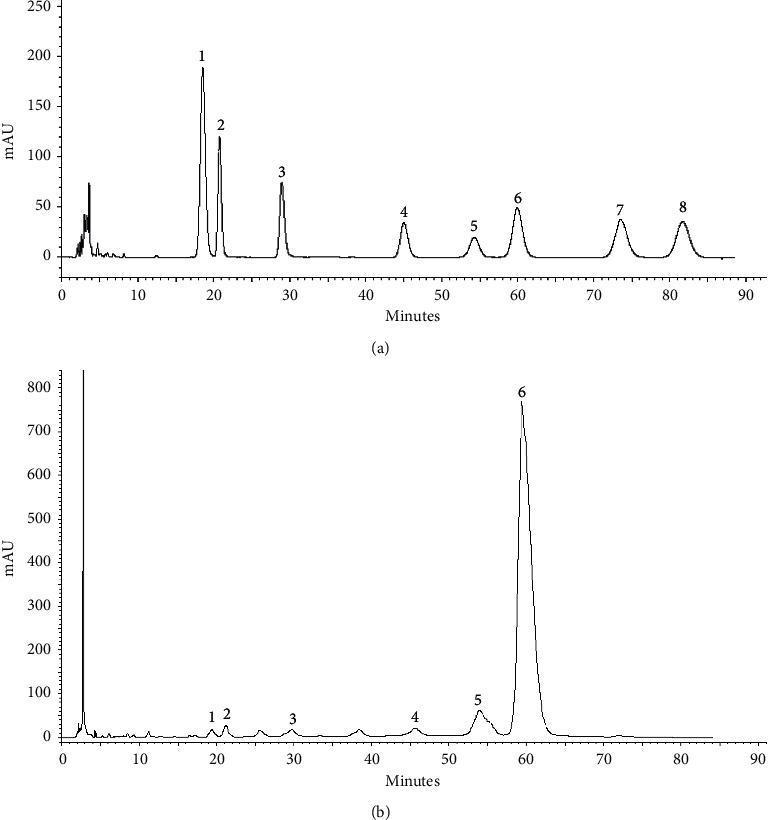
High-Performance Liquid Chromatography (HPLC) chromatograms illustrating the monosaccharide composition analysis of a carbohydrate-based sample. Panel (a) shows the reference standard profile with eight labeled peaks corresponding to specific monosaccharides and their retention times: 1 (PMP), 2 (d-mannose), 3 (d-rhamnose), 4 (glucuronic acid), 5 (galacturonic acid), 6 (d-glucose), 7 (d-galactose), and 8 (d-arabinose). The peaks are distributed across a 90-minute timeframe with varying intensities (mAU). Panel (b) displays the analysis of the GBSPII-1 sample, characterized by a dominant, high-intensity peak (peak 6) at approximately 59 minutes, identifying d-glucose as the primary constituent. Smaller peaks corresponding to mannose, rhamnose, and uronic acids are also visible, indicating a complex but glucose-rich polysaccharide structure. This comparative analytical visualization is used in biochemistry and pharmacology to determine the chemical fingerprint and purity of bioactive carbohydrate compounds.
Carbohydrates - Comprehensive Medical Biochemistry Notes
1. INTRODUCTION & OVERVIEW
- Energy source - glucose is the primary fuel for the brain and RBCs; 1 g CHO yields ~4 kcal
- Energy storage - glycogen in liver and muscle
- Structural components - cell walls, connective tissue (glycoproteins, proteoglycans)
- Cell signaling & recognition - blood group antigens, receptor ligands
2. CLASSIFICATION OF CARBOHYDRATES
A. Monosaccharides (Simple Sugars)
| Feature | Details |
|---|---|
| General formula | (CH₂O)n |
| Classification by carbon number | Trioses (3C), tetroses (4C), pentoses (5C), hexoses (6C), heptoses (7C) |
| Classification by functional group | Aldoses (aldehyde group) vs. Ketoses (keto group) |
| Most important hexose | D-Glucose (aldohexose) |
| Sugar | Type | Significance |
|---|---|---|
| Glucose | Aldohexose | Primary blood sugar, brain fuel |
| Fructose | Ketohexose | Fruit sugar, very sweet, liver metabolism |
| Galactose | Aldohexose | Milk sugar component, galactosemia if enzyme deficient |
| Ribose | Aldopentose | Component of RNA, ATP, NADH |
| Deoxyribose | Pentose | Component of DNA |
| Mannose | Aldohexose | Glycoprotein component |
B. Structural Properties of Monosaccharides
- When monosaccharides cyclize (forming a ring via hemiacetal or hemiketal bond), the resulting -OH at carbon 1 can be in two positions
- α-anomer: -OH is on the same side as the ring oxygen (axial in glucose)
- β-anomer: -OH is opposite the ring oxygen (equatorial in glucose - more stable)
- This is important because α-1,4 bonds form starch/glycogen (digestible), while β-1,4 bonds form cellulose (non-digestible)
C. Disaccharides
| Disaccharide | Components | Linkage | Source | Enzyme to digest |
|---|---|---|---|---|
| Sucrose (table sugar) | Glucose + Fructose | α-1,β-2 | Sugar cane/beet | Sucrase |
| Lactose (milk sugar) | Galactose + Glucose | β-1,4 | Milk | Lactase |
| Maltose | Glucose + Glucose | α-1,4 | Starch hydrolysis | Maltase |
| Trehalose | Glucose + Glucose | α-1,α-1 | Insect hemolymph | Trehalase |
| Cellobiose | Glucose + Glucose | β-1,4 | Cellulose hydrolysis | (not human) |
- Sucrose and maltose together represent 30-40% of dietary carbohydrates
- Reducing sugars have a free anomeric carbon (can reduce cupric ions) - glucose, fructose, galactose, maltose, lactose are reducing; sucrose is non-reducing
D. Oligosaccharides
- Found attached to proteins (glycoproteins) and lipids (glycolipids)
- Important for cell-cell recognition
E. Polysaccharides (Glycans)
| Polysaccharide | Composition | Linkage | Function |
|---|---|---|---|
| Starch (Amylose) | Glucose | α-1,4 only | Plant energy storage (straight chain) |
| Starch (Amylopectin) | Glucose | α-1,4 + α-1,6 (branch) | Plant energy storage (branched) |
| Glycogen | Glucose | α-1,4 + α-1,6 (more branches) | Animal energy storage |
| Cellulose | Glucose | β-1,4 | Plant cell wall; dietary fiber |
| Chitin | N-acetylglucosamine | β-1,4 | Arthropod exoskeleton |
| Hyaluronic acid | GlcUA + GlcNAc | β-1,3 + β-1,4 | Connective tissue |
| Heparin | GlcUA + GlcNS | Anticoagulant |
- Amylose is a straight-chain glucose polymer with α-1,4 linkages
- Amylopectin is a massive branched polymer (up to 1 million glucose residues); α-1,6 linkages at branch points
- Glycogen - "animal starch" - more highly branched than amylopectin; branches every ~8-12 residues (vs every ~25-30 in amylopectin)
- Starch accounts for 45-60% of dietary carbohydrate in Western diets
3. DIETARY CARBOHYDRATE DIGESTION
Phases of Digestion
Phase 1: Salivary Digestion
- Salivary α-amylase (ptyalin) begins starch hydrolysis in the mouth
- Cleaves α-1,4 bonds at random internal points → oligosaccharides (maltose, maltotriose, α-limit dextrins)
- Very limited action (food is swallowed quickly); inactivated by gastric acid
Phase 2: Pancreatic Digestion
- Pancreatic α-amylase is the major amylase
- Secreted into duodenum; much more active than salivary amylase
- Produces maltose, maltotriose, and α-limit dextrins (oligosaccharides containing α-1,6 branches)
- Cannot cleave α-1,6 bonds or terminal α-1,4 bonds
Phase 3: Brush Border (Luminal Surface) Digestion
| Enzyme | Substrate | Products |
|---|---|---|
| Sucrase-isomaltase | Sucrose, isomaltose (α-limit dextrins) | Glucose + Fructose |
| Lactase (LPH) | Lactose | Galactose + Glucose |
| Maltase-glucoamylase | Maltose, maltotriose | Glucose + Glucose |
| Trehalase | Trehalose | Glucose + Glucose |
Key: Lactase is the enzyme most commonly deficient in adults worldwide, leading to lactose intolerance.
4. CARBOHYDRATE ABSORPTION
Glucose and Galactose: Secondary Active Transport
- Transported via SGLT-1 (Sodium-Glucose Linked Transporter 1) on the apical membrane
- Na⁺ gradient (maintained by Na⁺/K⁺-ATPase on basolateral side) drives glucose/galactose uptake against their concentration gradients
- Exits enterocytes via GLUT-2 on the basolateral membrane into the portal blood
Fructose: Facilitated Diffusion
- Transported via GLUT-5 on the apical membrane
- Exits via GLUT-2 on the basolateral membrane
- Passive, no energy or Na⁺ required; slower than glucose/galactose transport
Glucose Transporters (GLUTs) - Key Summary
| Transporter | Tissue | Key Feature |
|---|---|---|
| GLUT-1 | Most tissues (RBCs, brain, endothelium) | High affinity, low Km; constitutive glucose uptake |
| GLUT-2 | Liver, kidney, pancreatic β cells, intestine (basolateral) | Low affinity, high Km; glucose sensor |
| GLUT-3 | Brain neurons | High affinity; ensures brain glucose supply |
| GLUT-4 | Skeletal muscle, adipose tissue | Insulin-responsive; recruited to membrane by insulin |
| GLUT-5 | Small intestine | Fructose transporter |
Insulin mechanism: Insulin causes GLUT-4 vesicles (stored intracellularly) to fuse with the plasma membrane, dramatically increasing glucose uptake in muscle and fat. This is the basis of insulin resistance in T2DM.
5. GLYCOLYSIS
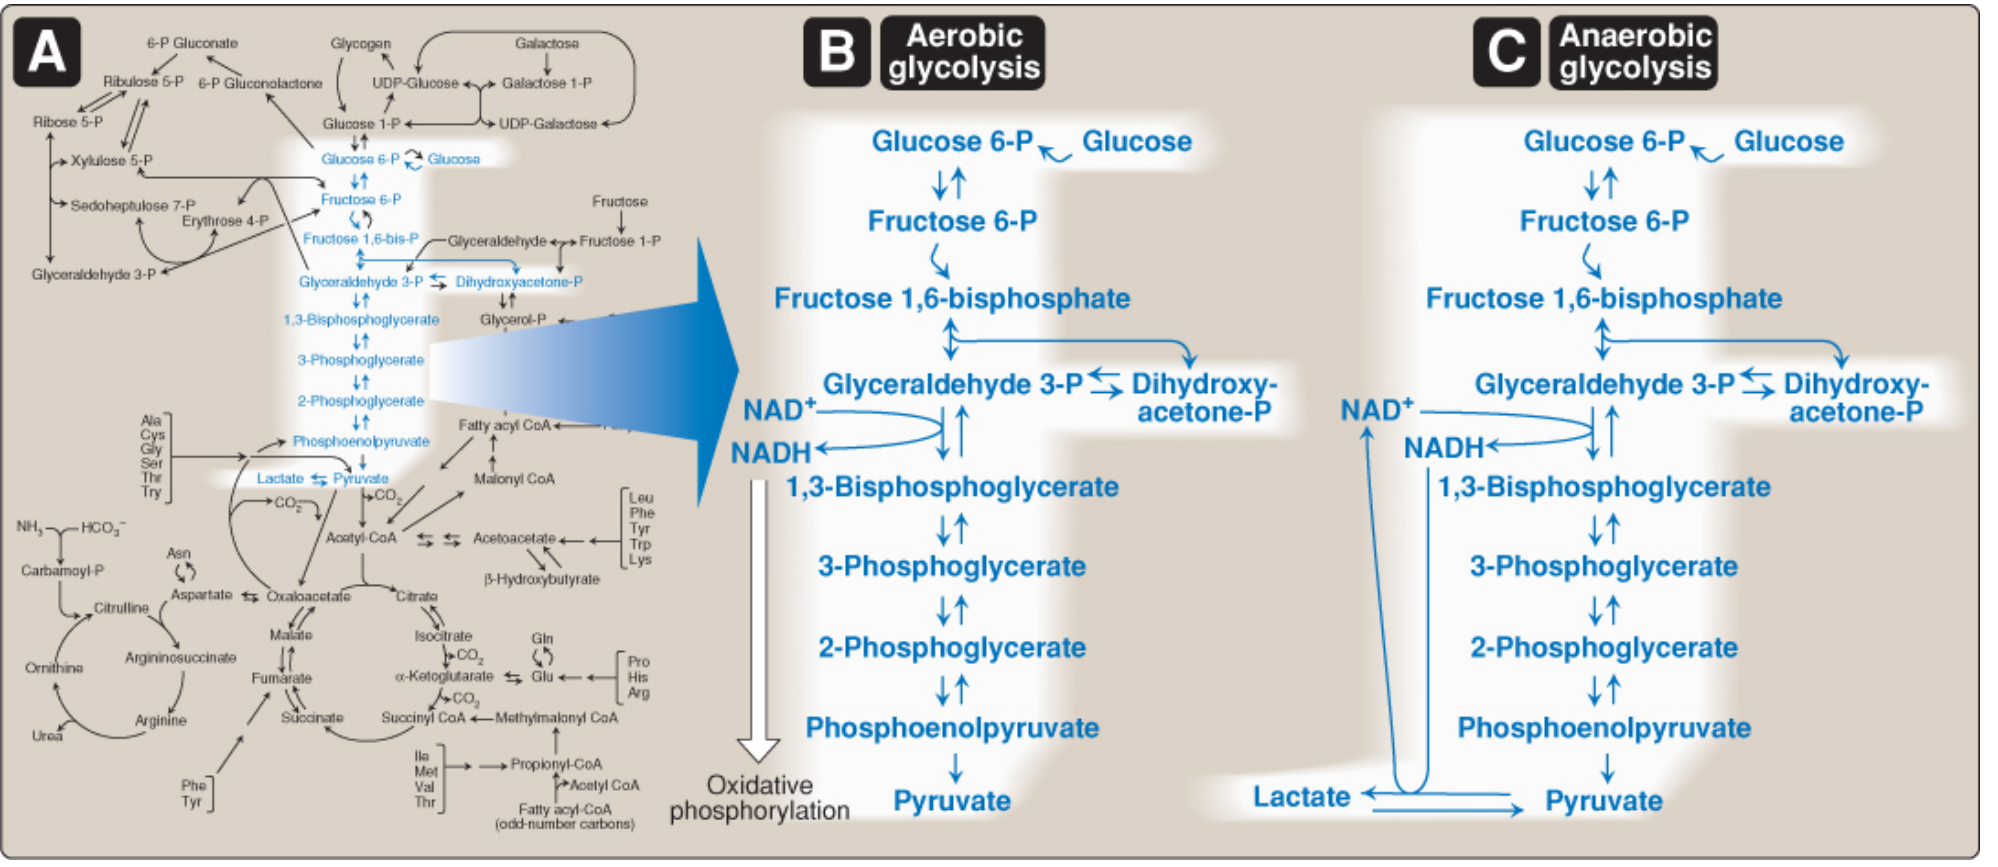
Net equation (aerobic): Glucose + 2 NAD⁺ + 2 ADP + 2 Pi → 2 Pyruvate + 2 NADH + 2 ATP + 2 H₂O
Overview
Two Phases
The 10 Reactions of Glycolysis
| Step | Reaction | Enzyme | Key Points |
|---|---|---|---|
| 1 | Glucose → Glucose-6-P | Hexokinase (HK I-III) or Glucokinase (HK IV) | Irreversible; traps glucose in cell; HK inhibited by G6P; glucokinase is the liver/β-cell glucose sensor |
| 2 | Glucose-6-P → Fructose-6-P | Phosphoglucose isomerase | Reversible; aldose-ketose isomerization |
| 3 | Fructose-6-P → Fructose-1,6-bisP | Phosphofructokinase-1 (PFK-1) | Rate-limiting, committed step; irreversible; activated by AMP/ADP; inhibited by ATP, citrate |
| 4 | Fructose-1,6-bisP → DHAP + G3P | Aldolase | Reversible; cleaves hexose into two trioses |
| 5 | DHAP → Glyceraldehyde-3-P | Triose phosphate isomerase | Rapid equilibrium; only G3P continues |
| 6 | G3P → 1,3-Bisphosphoglycerate | G3P dehydrogenase | NAD⁺ → NADH; this is the key oxidation step |
| 7 | 1,3-BPG → 3-Phosphoglycerate | Phosphoglycerate kinase | First substrate-level phosphorylation; 2 ATP/glucose |
| 8 | 3-PG → 2-Phosphoglycerate | Phosphoglycerate mutase | Reversible |
| 9 | 2-PG → Phosphoenolpyruvate (PEP) | Enolase | Dehydration; inhibited by fluoride (used in F⁻ blood tubes) |
| 10 | PEP → Pyruvate | Pyruvate kinase (PK) | Second substrate-level phosphorylation, 2 ATP/glucose; irreversible; activated by F-1,6-bisP (feedforward); inhibited by ATP, alanine |
Regulation of Glycolysis - Three Key Enzymes
- Hexokinase (I-III): Inhibited by product glucose-6-phosphate (feedback)
- PFK-1 (main regulatory enzyme):
- Activated by: AMP, ADP, Pi, fructose-2,6-bisphosphate (F-2,6-bisP) - most potent activator
- Inhibited by: ATP (high energy = stop glycolysis), citrate
- Pyruvate kinase:
- Activated by: fructose-1,6-bisphosphate (feedforward activation)
- Inhibited by: ATP, alanine; phosphorylated (inactivated) by glucagon-triggered PKA in the liver
Fructose-2,6-bisphosphate (F-2,6-bisP): Made by PFK-2 (a bifunctional enzyme). In the fed state (insulin), PFK-2 is active → F-2,6-bisP high → PFK-1 activated → glycolysis activated. In fasting (glucagon), PKA phosphorylates PFK-2, activating its phosphatase domain → F-2,6-bisP falls → glycolysis slows.
Aerobic vs. Anaerobic Glycolysis
| Feature | Aerobic | Anaerobic |
|---|---|---|
| O₂ required | Yes (to reoxidize NADH) | No |
| End product | Pyruvate → Acetyl-CoA → TCA | Lactate |
| Net ATP/glucose | 30-32 ATP (total) | 2 ATP |
| NADH fate | Enters ETC | Oxidized by lactate dehydrogenase |
| Tissues | All aerobic tissues | RBCs, renal medulla, exercising muscle, hypoxic tissue |
- Regenerates NAD⁺ for continued glycolysis
- Lactate is not a dead end - it is taken up by the liver and heart and reconverted to pyruvate
Fate of Pyruvate
- Aerobic (mitochondria): Pyruvate → Acetyl-CoA (by pyruvate dehydrogenase complex, PDC)
- Anaerobic: Pyruvate → Lactate (by LDH)
- Gluconeogenesis: Pyruvate → OAA → Glucose (in liver)
- Transamination: Pyruvate → Alanine
- Carboxylation: Pyruvate → OAA (by pyruvate carboxylase; requires biotin)
6. PYRUVATE DEHYDROGENASE COMPLEX (PDC)
Reaction: Pyruvate + CoA + NAD⁺ → Acetyl-CoA + CO₂ + NADH
Irreversible - commits pyruvate to oxidative catabolism or fatty acid synthesis
- TPP (thiamine pyrophosphate - B1)
- Lipoic acid
- FAD (B2/riboflavin)
- NAD⁺ (B3/niacin)
- CoA (pantothenate/B5)
- Activated by: NAD⁺, CoA, AMP, Ca²⁺ (in muscle), pyruvate (substrate), insulin (activates phosphatase)
- Inhibited by: NADH, Acetyl-CoA, ATP, fatty acids; phosphorylation by PDH kinase inactivates PDC
PDC Deficiency: Causes lactic acidosis, neurological dysfunction; accumulated pyruvate → lactate; treated with ketogenic diet. Thiamine deficiency also impairs PDC → Wernicke-Korsakoff syndrome.
7. TRICARBOXYLIC ACID (TCA) CYCLE / CITRIC ACID CYCLE (KREBS CYCLE)
Input: 1 Acetyl-CoA (2C)
Output per turn: 3 NADH + 1 FADH₂ + 1 GTP + 2 CO₂
- 2 pyruvate → 2 Acetyl-CoA → 2 TCA turns
- Yields: 10 NADH + 2 FADH₂ + 2 GTP (from TCA alone)
- Total ATP per glucose (with oxidative phosphorylation): 30-32 ATP
TCA Cycle Reactions
| Step | Reaction | Enzyme | Key Points |
|---|---|---|---|
| 1 | Acetyl-CoA + OAA → Citrate | Citrate synthase | Regulated by ATP, NADH, succinyl-CoA |
| 2 | Citrate → Isocitrate | Aconitase | Contains iron-sulfur center |
| 3 | Isocitrate → α-Ketoglutarate + CO₂ | Isocitrate dehydrogenase | Rate-limiting; NADH produced; activated by ADP, Ca²⁺ |
| 4 | α-KG → Succinyl-CoA + CO₂ | α-KG dehydrogenase complex | NADH produced; requires same cofactors as PDC |
| 5 | Succinyl-CoA → Succinate | Succinyl-CoA synthetase | GTP produced (substrate-level phosphorylation) |
| 6 | Succinate → Fumarate | Succinate dehydrogenase | FADH₂ produced; inhibited by malonate (competitive) |
| 7 | Fumarate → Malate | Fumarase | Hydration |
| 8 | Malate → OAA | Malate dehydrogenase | NADH produced; OAA regenerated for next turn |
Anapleurotic Reactions (Replenishing TCA intermediates)
- Pyruvate → OAA (pyruvate carboxylase)
- Pyruvate → Malate (malic enzyme)
- Amino acids → TCA intermediates (e.g., Glu → α-KG, Asp → OAA)
8. OXIDATIVE PHOSPHORYLATION
Process: NADH and FADH₂ donate electrons to the electron transport chain (ETC); the proton gradient drives ATP synthase.
| Substrate | ATP produced |
|---|---|
| 1 NADH | ~2.5 ATP |
| 1 FADH₂ | ~1.5 ATP |
- Glycolysis: 2 ATP + 2 NADH (cytoplasmic)
- PDC: 2 NADH
- TCA: 2 GTP + 6 NADH + 2 FADH₂
- Grand total: ~30-32 ATP
9. GLYCOGEN METABOLISM
Overview
- α-1,4 linkages in linear chains
- α-1,6 linkages at branch points (every ~8-12 residues)
| Location | Amount | Function |
|---|---|---|
| Liver | ~100g (~10% of fresh weight) | Maintains blood glucose during fasting; depleted in <24h |
| Skeletal muscle | ~400g (~1-2% of fresh weight) | Provides ATP for muscle contraction; cannot export glucose |
Glycogenesis (Glycogen Synthesis)
- Glucose → Glucose-6-P (hexokinase/glucokinase)
- Glucose-6-P → Glucose-1-P (phosphoglucomutase)
- Glucose-1-P + UTP → UDP-Glucose + PPi (UDP-glucose pyrophosphorylase) - activated form
- UDP-Glucose → Glycogen(n+1) (glycogen synthase) - adds to non-reducing end via α-1,4 bond
- Branching enzyme (amyloglucosidase/branching enzyme): transfers ~7 glucose units to form new α-1,6 branch point
Activation: Insulin (via dephosphorylation), glucose-6-phosphate
Inhibition: Glucagon/epinephrine (via phosphorylation by PKA)
Glycogenolysis (Glycogen Breakdown)
- Glycogen phosphorylase cleaves α-1,4 bonds: Glycogen(n) + Pi → Glycogen(n-1) + Glucose-1-P
- Key regulatory enzyme - different isoforms in liver (PYGL) and muscle (PYGM)
- Activated by: phosphorylation (glucagon/epinephrine → cAMP → PKA), AMP (muscle), Ca²⁺ (muscle)
- Inhibited by: dephosphorylation (insulin), ATP, glucose-6-P (liver form only)
- Stops 4 residues from a branch point (cannot cleave near branch)
- Debranching enzyme (bifunctional): transfers 3 residues from branch to main chain, then hydrolyzes the α-1,6 bond → free glucose (this is the ONLY step that releases free glucose from glycogenolysis)
- Glucose-1-P → Glucose-6-P (phosphoglucomutase)
- Liver only: Glucose-6-P → Glucose (glucose-6-phosphatase) → exported to blood
- Muscle lacks glucose-6-phosphatase → cannot contribute to blood glucose
Hormonal Regulation
| Hormone | Glycogen Synthesis | Glycogenolysis |
|---|---|---|
| Insulin (fed state) | ↑ (activates synthase) | ↓ (inactivates phosphorylase) |
| Glucagon (fasting, liver only) | ↓ | ↑ |
| Epinephrine (stress, both) | ↓ | ↑ |
10. GLUCONEOGENESIS
Location: Liver (~90% after overnight fast); kidney (~10%, increases to ~40% in prolonged starvation); small intestine can also contribute.
Occurs when: Glycogen is depleted (>4-6h fast), prolonged exercise, high-fat/low-carb states.
Gluconeogenic Precursors
- Lactate - from anaerobic glycolysis in RBCs and exercising muscle (Cori cycle)
- Glycerol - from lipolysis of triacylglycerols in adipose tissue
- Glucogenic amino acids - ALL except leucine and lysine; especially alanine (glucose-alanine cycle)
- Propionyl-CoA - from odd-chain fatty acid oxidation → succinyl-CoA → OAA → glucose
Unique Gluconeogenic Enzymes (bypass irreversible glycolytic steps)
| Glycolytic Step (irreversible) | Gluconeogenic Bypass Enzyme |
|---|---|
| Pyruvate kinase: PEP → Pyruvate | Pyruvate carboxylase (Pyruvate → OAA) then PEPCK (OAA → PEP) |
| PFK-1: F6P → F-1,6-bisP | Fructose-1,6-bisphosphatase (FBPase-1) (F-1,6-bisP → F6P) |
| Hexokinase: Glucose → G6P | Glucose-6-phosphatase (G6P → Glucose) - liver/kidney only |
- Pyruvate + CO₂ + ATP → OAA (pyruvate carboxylase; requires biotin; activated by acetyl-CoA)
- OAA must be converted to malate (crosses mitochondrial membrane), reconverted to OAA in cytosol
- OAA → PEP + CO₂ (PEPCK; requires GTP)
Cori Cycle
Glucose-Alanine Cycle
Regulation of Gluconeogenesis
| Activators | Inhibitors |
|---|---|
| Glucagon, cortisol, epinephrine | Insulin |
| High acetyl-CoA (activates pyruvate carboxylase) | AMP (inhibits FBPase-1) |
| High NADH (promotes lactate → OAA conversion) | F-2,6-bisP (potently inhibits FBPase-1) |
11. PENTOSE PHOSPHATE PATHWAY (Hexose Monophosphate Shunt)
Does NOT produce or consume ATP
Two main products:
- NADPH - reducing power for biosynthesis (fatty acids, cholesterol, steroids) and antioxidant defense
- Ribose-5-phosphate - for nucleotide and nucleic acid synthesis
Phase 1: Oxidative (Irreversible)
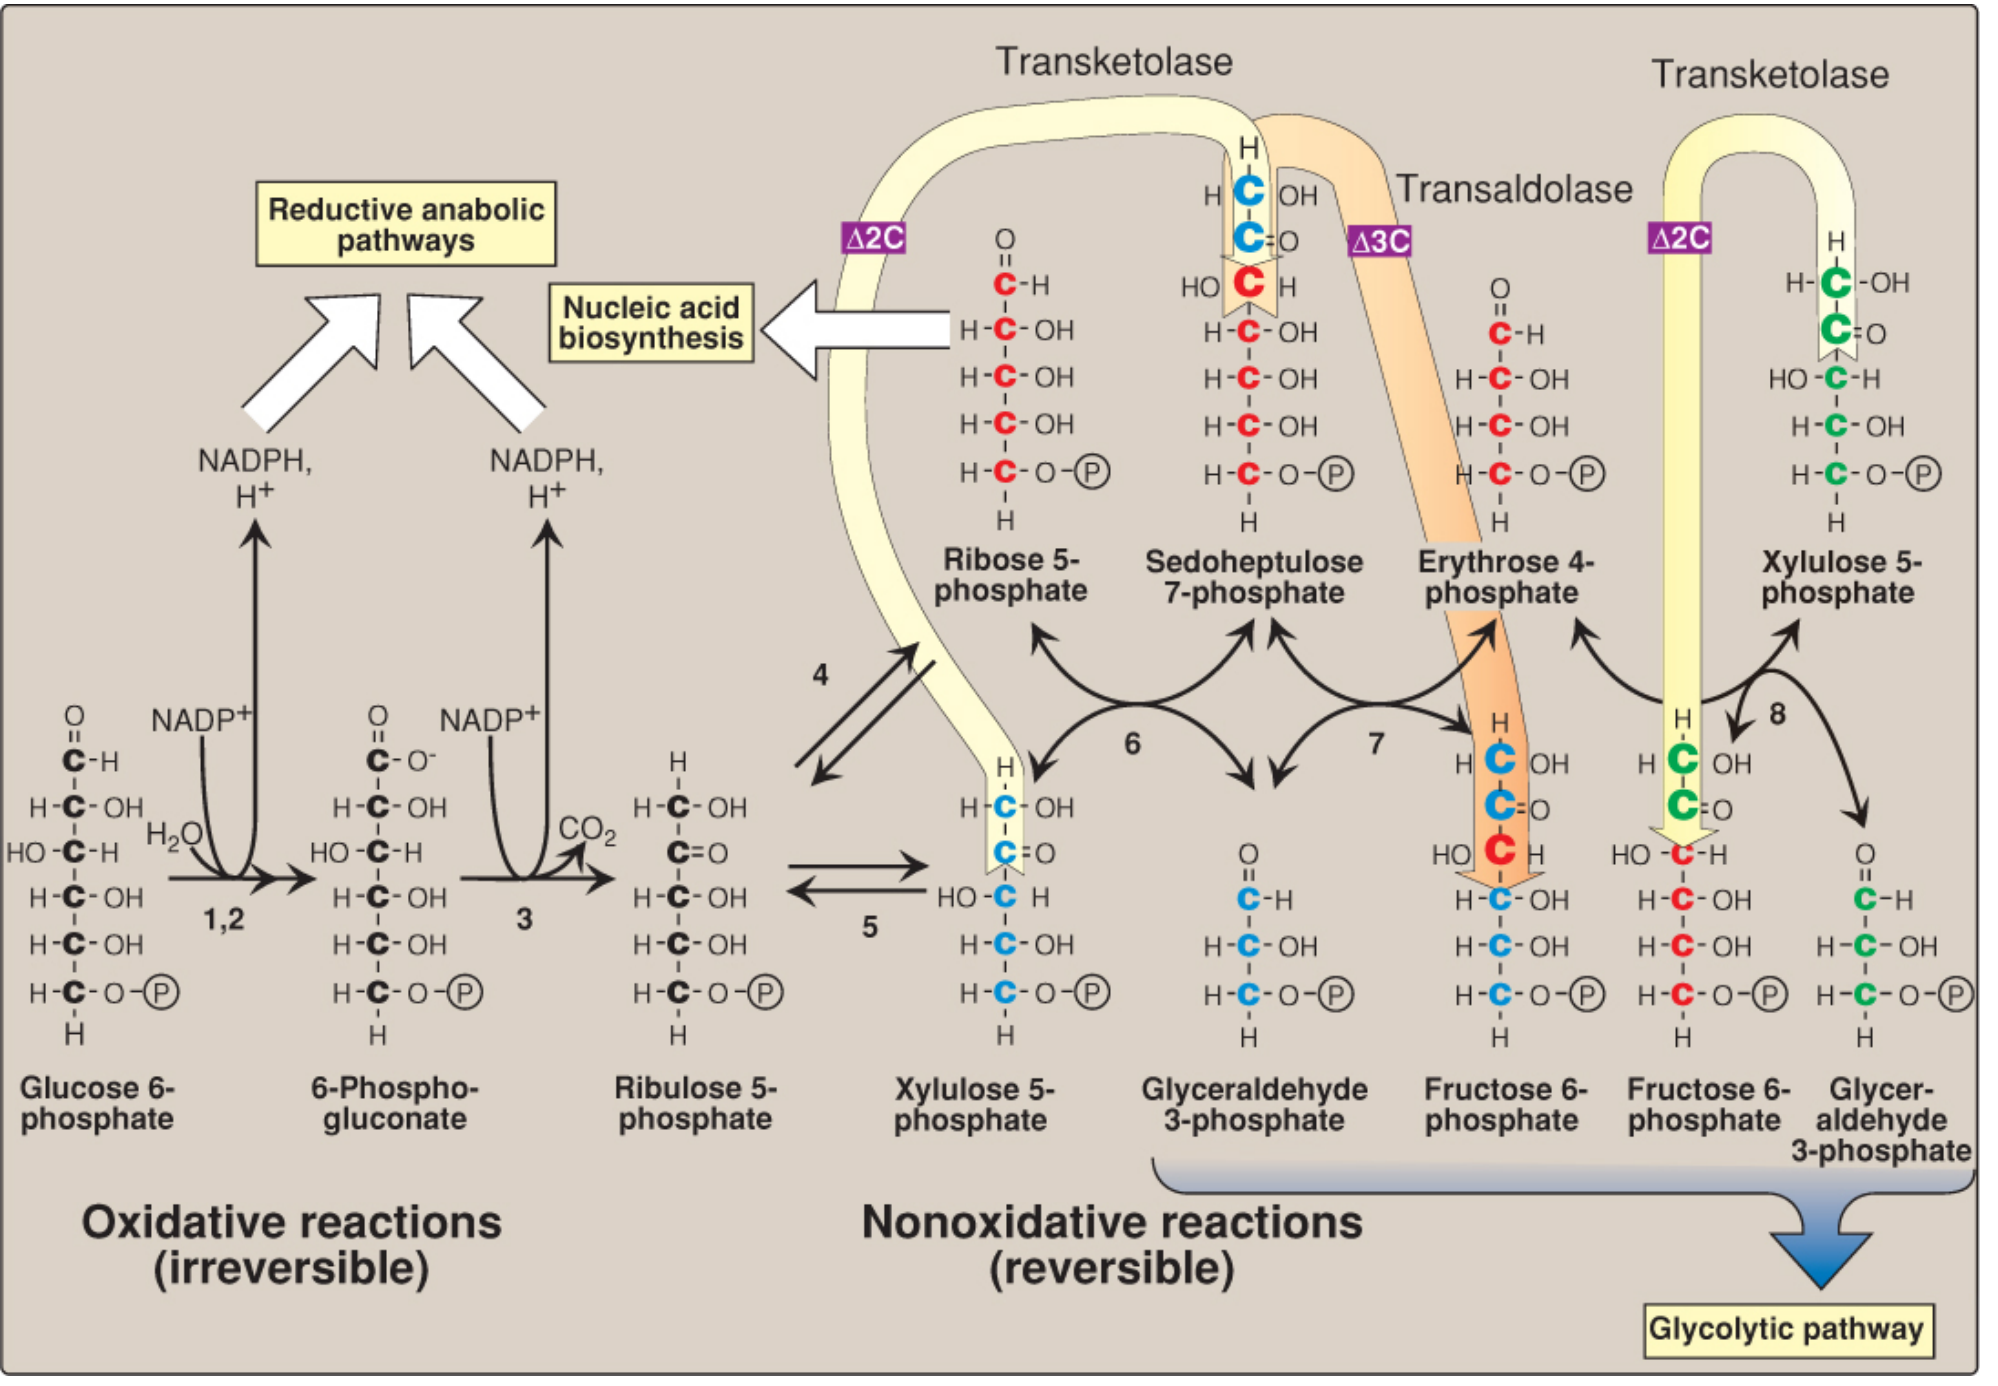
Produces 2 NADPH per glucose-6-P
Rate-limiting enzyme: Glucose-6-phosphate dehydrogenase (G6PD)
Phase 2: Non-oxidative (Reversible)
- Ribulose-5-P can be isomerized to ribose-5-P or xylulose-5-P
- Transketolase (requires thiamine/B1) and Transaldolase interconvert C3, C4, C5, C6, C7 sugars
- Can feed intermediates back into glycolysis (as F-6-P and G3P) when NADPH is more needed than ribose
- Reversibility allows the cell to tune the ratio of NADPH to ribose production
G6PD Deficiency (Clinically Important)
- Most common enzyme deficiency worldwide (X-linked)
- Insufficient NADPH in RBCs → cannot reduce glutathione → RBCs vulnerable to oxidant stress
- Triggers: Primaquine, dapsone, nitrofurantoin, sulfonamides, fava beans, infection
- Presentation: Acute hemolytic anemia; Heinz bodies (denatured Hb) on blood smear; "bite cells"
- Key lab: Low G6PD activity on enzyme assay; elevated reticulocytes after crisis
12. FRUCTOSE AND GALACTOSE METABOLISM
Fructose Metabolism (Liver)
- Fructose → Fructose-1-P (fructokinase) - very rapid, no feedback inhibition → ATP depletion if fructose load is high
- Fructose-1-P → DHAP + Glyceraldehyde (aldolase B - liver specific)
- Products enter glycolysis at the triose level
Fructokinase bypasses the regulated PFK-1 step - hence fructose enters glycolysis unregulated, promoting fat synthesis.
Hereditary fructose intolerance: Aldolase B deficiency → F-1-P accumulates → severe liver/kidney damage; hypoglycemia; vomiting; avoidance of sucrose/fructose is treatment.
Galactose Metabolism (Leloir Pathway)
- Galactose → Galactose-1-P (galactokinase)
- Gal-1-P + UDP-Glucose → Glucose-1-P + UDP-Galactose (Gal-1-P uridylyltransferase - GALT)
- UDP-Galactose → UDP-Glucose (UDP-galactose-4-epimerase)
| Type | Enzyme Deficient | Presentation |
|---|---|---|
| Classic (Type I) | Gal-1-P uridylyltransferase (GALT) | Jaundice, cataracts, liver failure, intellectual disability, E. coli sepsis in newborns |
| Type II (Galactokinase deficiency) | Galactokinase | Cataracts only (galactitol accumulates in lens) |
| Type III (Epimerase deficiency) | UDP-galactose-4-epimerase | Variable |
- Accumulated galactose → galactitol (via aldose reductase) → cataracts
- Galactose-1-P accumulates → toxic to liver, brain, kidney
- Treatment: Eliminate galactose/lactose from diet; newborn screening
13. GLYCOGEN STORAGE DISEASES (GSDs)
| Type | Eponym | Enzyme Deficient | Organ | Key Features |
|---|---|---|---|---|
| Type 0 | - | Glycogen synthase | Liver | Hypoglycemia, hyperketonemia |
| Type I | Von Gierke | Glucose-6-phosphatase | Liver, kidney | Severe fasting hypoglycemia, hepatomegaly, lactic acidosis, lipemia |
| Type II | Pompe | Lysosomal α-glucosidase (acid maltase) | All organs (lysosomes) | Infantile: cardiomegaly, severe hypotonia, death by age 2; adult form: myopathy |
| Type III | Cori/Forbes | Debranching enzyme (AGL) | Liver, muscle | Hepatomegaly, mild hypoglycemia, myopathy; short outer branches |
| Type IV | Andersen | Branching enzyme (GBE1) | Liver | Hepatosplenomegaly; long outer branches; often fatal |
| Type V | McArdle | Muscle glycogen phosphorylase (PYGM) | Skeletal muscle | Exercise intolerance, muscle cramps, myoglobinuria; no rise in venous lactate with exercise |
| Type VI | Hers | Liver glycogen phosphorylase (PYGL) | Liver | Hepatomegaly, mild hypoglycemia; good prognosis |
| Type VII | Tarui | Phosphofructokinase-1 | Muscle, RBCs | Similar to Type V + hemolytic anemia |
| Type IX | - | Phosphorylase kinase | Liver and/or muscle | Similar to Type VI |
Memory tip for Von Gierke (Type I): No G6Pase → glucose-6-P accumulates → excess lactate (glycolysis), hyperuricemia (purine synthesis), hyperlipidemia (lipogenesis) + severe fasting hypoglycemia.
Pompe: "Pompe pumps glycogen into lysosomes" - lysosomal storage disease.
McArdle: "McArdle can't exercise" - ischemic forearm exercise test shows no lactate rise.
14. BLOOD GLUCOSE REGULATION
Normal Values
| State | Glucose (mg/dL) |
|---|---|
| Fasting (normal) | 70-99 |
| 2h postprandial (normal) | < 140 |
| Impaired fasting glucose | 100-125 |
| Impaired glucose tolerance (2h) | 140-199 |
| Diabetes mellitus (fasting) | ≥ 126 (on 2 occasions) |
| Hypoglycemia | < 70 |
Hormones Regulating Blood Glucose
| Hormone | Source | Effect on Glucose |
|---|---|---|
| Insulin | Pancreatic β cells | ↓ glucose (anabolic: ↑ glycogenesis, ↑ glycolysis, ↑ lipogenesis; ↓ gluconeogenesis, ↓ glycogenolysis) |
| Glucagon | Pancreatic α cells | ↑ glucose (catabolic in liver: ↑ gluconeogenesis, ↑ glycogenolysis) |
| Epinephrine | Adrenal medulla | ↑ glucose (↑ glycogenolysis in liver and muscle, ↑ gluconeogenesis) |
| Cortisol | Adrenal cortex | ↑ glucose (↑ gluconeogenesis from amino acids, anti-insulin) |
| Growth hormone | Anterior pituitary | ↑ glucose (long-term anti-insulin action) |
| Somatostatin | Pancreatic δ cells, hypothalamus | ↓ both insulin and glucagon secretion |
Postprandial State (Fed State)
Fasting State
15. CARBOHYDRATE MALABSORPTION
Lactose Intolerance (Most Common)
- Primary: Age-related decline in lactase (adult-type hypolactasia); most common in East Asians, Africans, Middle Easterners
- Secondary: Mucosal damage (celiac disease, Crohn's, giardiasis, viral gastroenteritis)
- Pathophysiology: Undigested lactose → osmotic diarrhea + colonic bacterial fermentation → H₂/CO₂/short-chain fatty acids → bloating, flatulence, cramps, diarrhea
- Diagnosis: Hydrogen breath test (gold standard), lactose tolerance test, genetic testing (LCT gene)
- Treatment: Lactase enzyme supplements, lactose-free dairy, calcium supplementation
Sucrase-Isomaltase Deficiency
- Rare; presents in infancy when sucrose is introduced
- Osmotic diarrhea after sucrose/starch ingestion
- Treatment: sucrose-free diet, sacrosidase enzyme replacement
Malabsorptive Diarrhea General Mechanism
16. DIABETES MELLITUS (Carbohydrate Perspective)
Type 1 DM
- Autoimmune destruction of β cells → absolute insulin deficiency
- No insulin → GLUT-4 not inserted → hyperglycemia; unrestrained lipolysis → ketoacidosis
- Glucosuria when blood glucose exceeds renal threshold (~180 mg/dL)
Type 2 DM
- Insulin resistance + progressive β-cell dysfunction
- Initially compensatory hyperinsulinemia, then β-cell failure
- GLUT-4 translocation impaired in muscle/adipose
Hemoglobin A1c (HbA1c)
- Glycated hemoglobin reflects average blood glucose over ~3 months (RBC lifespan)
- Normal: <5.7%; Prediabetes: 5.7-6.4%; DM: ≥6.5%
- HbA1c is formed by non-enzymatic glycation (not regulated by insulin)
17. QUICK CLINICAL PEARLS & HIGH-YIELD FACTS
| Fact | Detail |
|---|---|
| Most common sugar in blood | Glucose |
| Only sugar made by mammary glands | Lactose (galactose + glucose) |
| Storage form in animals | Glycogen (liver and muscle) |
| Only non-reducing disaccharide | Sucrose |
| Vitamin B1 (thiamine) in metabolism | Required for PDC, α-KG dehydrogenase, transketolase - deficiency causes lactic acidosis + Wernicke's |
| Enzyme bypassing PFK-1 regulation | Fructokinase (fructose enters glycolysis unregulated) |
| Muscle cannot export glucose | Lacks glucose-6-phosphatase |
| Brain cannot use fatty acids | Relies on glucose (normal) or ketone bodies (starvation) |
| Cori cycle | Muscle lactate → liver glucose; transfers "metabolic debt" |
| Glucose-alanine cycle | Muscle alanine → liver glucose + urea |
| Most potent activator of PFK-1 | Fructose-2,6-bisphosphate |
| Warburg effect | Cancer cells prefer aerobic glycolysis (lactate production even in O₂) - high GLUT expression |
| G6PD deficiency trigger drugs | "Primaquine, dapsone, nitrofurantoin, sulfonamides" |
| Von Gierke screening test | Glucagon does NOT raise blood glucose (cannot mobilize glucose-6-P to blood) |
| McArdle diagnosis | Ischemic forearm test: lactate does NOT rise, ammonia rises normally |
18. INTEGRATION SUMMARY
DIETARY CHO
     ↓  (digestion by amylases + brush border enzymes)
MONOSACCHARIDES (glucose, galactose, fructose)
     ↓  (absorbed via SGLT1/GLUT5 → GLUT2)
PORTAL BLOOD → LIVER
     ↓
GLUCOSE-6-PHOSPHATE  ←────────────────────────────────┐
     ├──→ GLYCOLYSIS → Pyruvate → Acetyl-CoA → TCA    │
     │                                → OXIDATIVE PHOS│
     ├──→ GLYCOGENESIS → GLYCOGEN (storage)            │
     ├──→ PENTOSE PHOSPHATE PATHWAY → NADPH + Ribose-5P│
     └──→ GLUCONEOGENESIS (fasting) ───────────────────┘
- Biochemistry, 8th ed. Lippincott Illustrated Reviews (Harvey & Ferrier)
- Basic Medical Biochemistry: A Clinical Approach, 6th ed. (Lieberman & Peet)
- Medical Physiology (Boron & Boulpaep)
- Guyton and Hall Textbook of Medical Physiology
- Sleisenger and Fordtran's Gastrointestinal and Liver Disease