
Alcoholic liver disease
"alcoholic liver disease"[MeSH Terms] AND treatment
alcoholic liver disease histology fatty liver cirrhosis
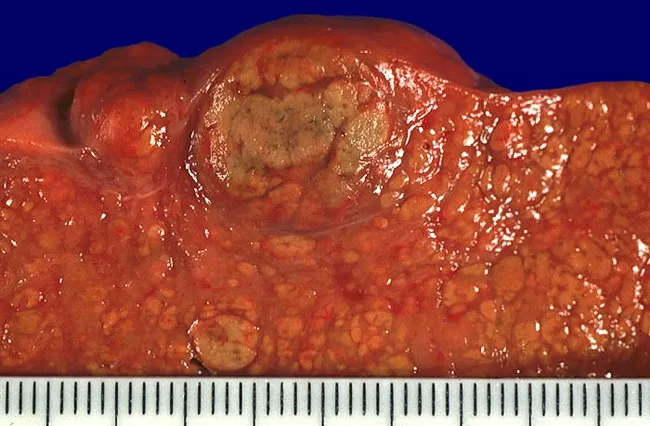
Gross pathology photograph of the liver surface from a case of alcoholic liver disease. The image shows diffuse micronodularity of the parenchyma with a coarse, irregular texture and reddish-brown coloration. Nodularity is predominantly micronodular (<3 mm) due to widespread fibrosis, with occasional larger regenerative nodules that may reflect hepatocyte regeneration during abstinence. The hepatic surface is nodular and uneven, indicating bridging fibrosis and loss of normal lobular architecture. A centimeter-scale ruler is present for size reference, confirming small nodules and expanded fibrous septa. This macroscopic pattern is characteristic of cirrhosis in advanced alcoholic liver disease, where irreversible architectural remodeling yields a nodular, firm liver with altered contour. Pathological significance includes portal hypertension risk, impaired synthetic function, and increased hepatocellular carcinoma risk. Clinically, this appearance correlates with long-standing alcohol exposure, potential ascites, and abnormal liver function tests. The image serves as an educational reference for hepatology, pathology, and medical education, illustrating end-stage liver disease, nodular regeneration, and fibrosis. Differential considerations include cirrhosis from other etiologies (viral hepatitis, biliary disease, nonalcoholic fatty liver disease) and variation in nodularity with disease stage and abstinence. This photograph aids gross-pathology correlation with histology and radiology in teaching cases and supports case-based learning.
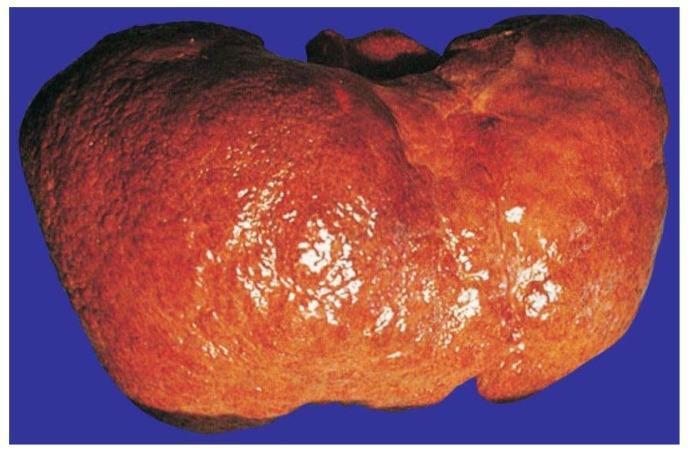
This clinical photograph displays a macroscopic view of a human liver specimen exhibiting advanced alcoholic cirrhosis. The organ demonstrates a characteristic micronodular surface, where the normally smooth capsule is replaced by a diffuse, granular texture. These numerous small, rounded protrusions represent regenerative nodules of hepatocytes surrounded by dense fibrotic septa. The liver color is predominantly reddish-brown with yellowish-tan areas, likely reflecting steatosis (fatty change) and variation in tissue density. Bright, fragmented light reflexes on the surface highlight the irregular, cobweb-like topography and uneven capsule tension typical of end-stage chronic liver disease. The specimen illustrates the pathological progression from chronic alcohol-induced injury to extensive fibrosis and architectural distortion, which are key diagnostic features of cirrhosis in hepatology and pathology education.
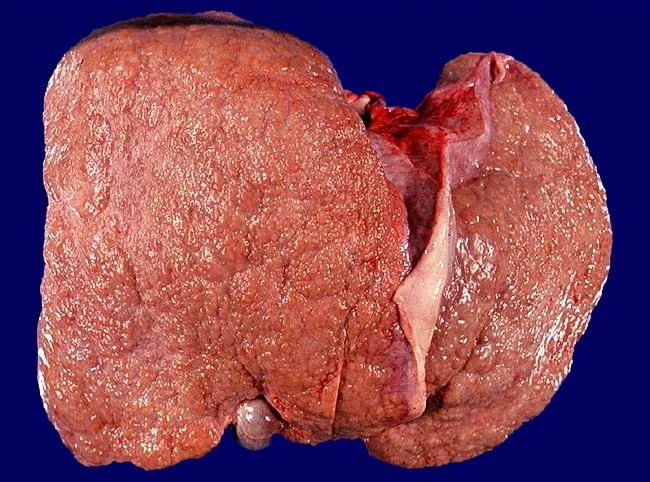
This is a gross pathology photograph of a human liver showing diffuse micronodular cirrhosis with nodules smaller than 3 mm on the surface, consistent with alcoholic liver disease. The organ appears enlarged and firm, with a coarse, irregular exterior and a nodular regenerative pattern that distorts normal lobular architecture. Coloration is mottled brownish-red, reflecting parenchymal degeneration and fibrotic remodeling; the capsule surface is intact but irregular. The microscopic correlate would reveal widespread hepatic fibrosis with fibrous septa and numerous tiny regenerative nodules; histology would show steatosis, ballooning degeneration, inflammation, and eventual cirrhotic architecture. The described micronodularity (<3 mm) indicates advanced fibrosis rather than macro-nodular cirrhosis, and underscores the progression from steatosis to steatohepatitis to cirrhosis in long-term alcohol exposure. Clinically, this morphology signals portal hypertension risk, reduced synthetic function, and potential progression to hepatic failure; timely management includes alcohol cessation, nutritional support, surveillance for varices, and evaluation for liver transplantation in end-stage disease. This image is informative for education on liver gross anatomy, correlation with histopathology, and teaching about alcohol-related liver disease staging. It is appropriate for pathology, hepatology, and radiology-pathology correlation. Note the dominant nodularity and preserved capsule, features commonly seen in alcoholic micronodular cirrhosis for teaching and research applications.
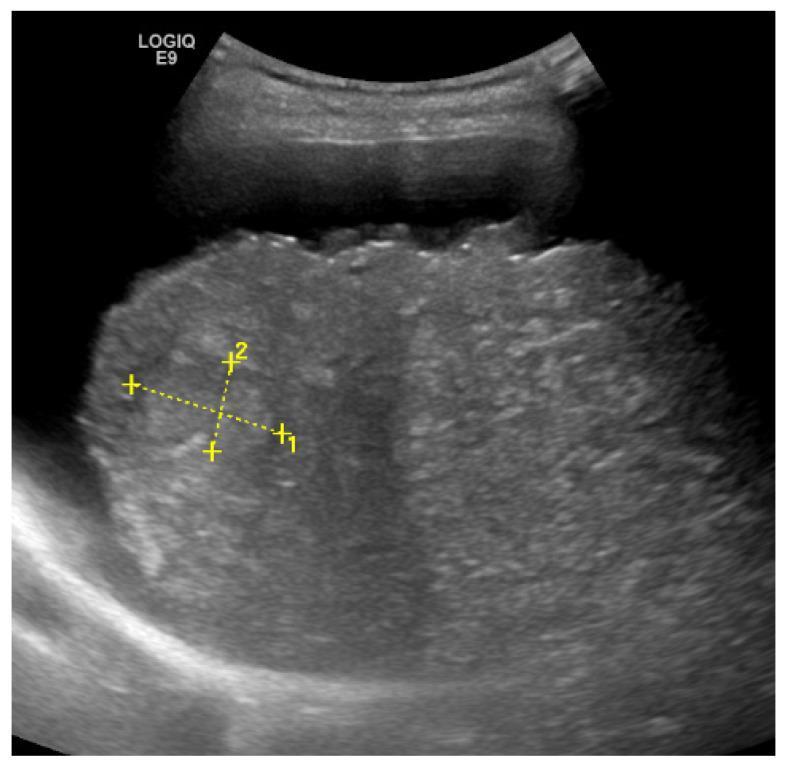
This diagnostic B-mode transabdominal ultrasound image displays the right lobe of the liver in a patient with Non-Alcoholic Fatty Liver Disease (NAFLD) progressing to cirrhosis. Key sonographic features include a markedly nodular and irregular liver surface, which is a pathognomonic indicator of advanced cirrhosis. The liver parenchyma exhibits an inhomogeneous, coarse echotexture with increased echogenicity relative to normal tissue. An anechoic layer of perihepatic ascites is visible between the abdominal wall and the liver capsule, enhancing the visualization of the surface nodularity. Within the right lobe, a discrete, hypoechoic focal lesion is identified and demarcated with yellow measurement calipers (labeled 1 and 2), representing a finding highly suspicious for hepatocellular carcinoma (HCC) in the clinical context of cirrhosis. This image serves as an educational tool for identifying the complications of chronic liver disease, specifically the morphological transition from steatosis to cirrhosis and secondary malignancy.
"alcohol-associated liver disease" AND management
alcoholic hepatitis Mallory Denk bodies histology neutrophil infiltration
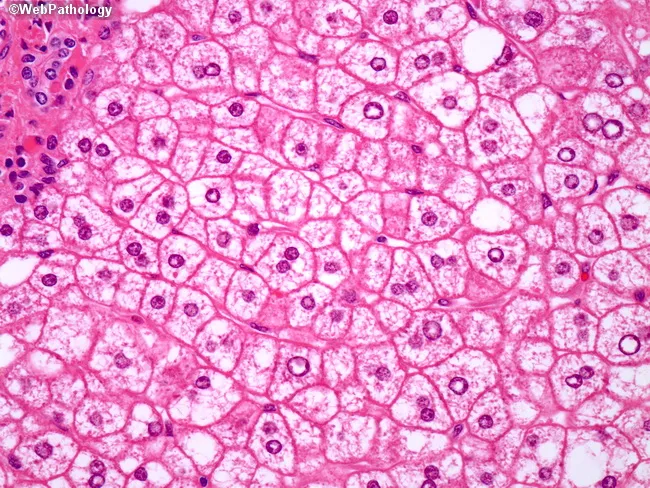
This is a liver biopsy histology image prepared for light microscopy, stained with hematoxylin and eosin (H&E). The primary subject is hepatocytes within the hepatic parenchyma showing features of alcoholic steatohepatitis. Macrovesicular steatosis is evident, with numerous large fat vesicles displacing the cytoplasm. More striking are ballooned hepatocytes, enlarged cells with pale, cytoplasmic clearing and disrupted cytoskeletal architecture. Within several ballooned cells, Mallory-Denk bodies (Mallory hyaline) appear as irregular eosinophilic, hyaline inclusions. The nuclear morphology is variably preserved, with occasionally pyknotic or shrunken nuclei in chronically damaged hepatocytes. The overall cellular morphology indicates hepatocellular injury with cytoskeletal disruption and intracellular inclusions consistent with steatohepatitis. Notably, CK8/18 immunostaining would reveal reduced or absent intermediate filament networks in ballooned hepatocytes, a feature that helps distinguish steatohepatitic ballooning from non-steatohepatitic ballooning seen in viral hepatitis where CK8/18 loss is less pronounced. In alcoholic liver disease, Mallory-Denk bodies and cytoplasmic clearing correlate with ongoing inflammation and progressive fibrosis risk, informing diagnostic significance and clinical management. This image is valuable for education on histologic differentiation between alcoholic steatohepatitis and other causes of hepatocellular ballooning, and for teaching pathology students about steatosis-related cytoskeletal disruption. Correlation with alcohol history and fibrosis staging enhances clinical decision making.
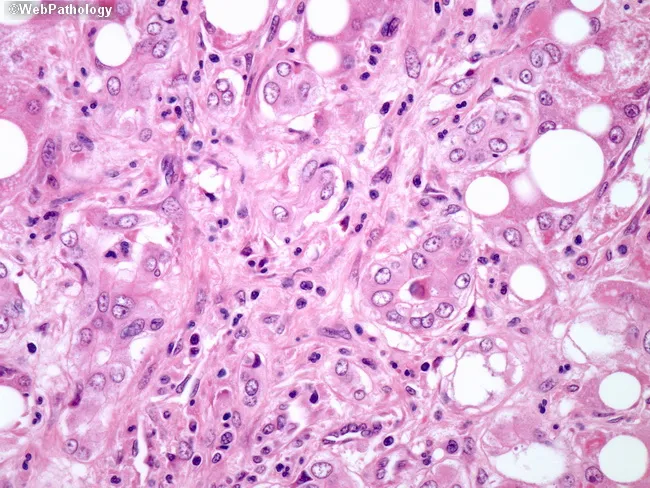
Light microscopy of a formalin‑fixed, paraffin‑embedded liver biopsy stained with Hematoxylin and Eosin demonstrates features of alcoholic liver disease with residual steatohepatitis and cirrhosis. Macrovesicular steatosis is evident in hepatocytes, with hepatocellular ballooning and intracellular Mallory‑Denk bodies representing damaged cytokeratin aggregates. Intermixed neutrophils and lymphocytes comprise the inflammatory infiltrate, including CD4+ and CD8+ T‑cell subsets, consistent with active inflammatory activity. Pericellular, “chicken‑wire” fibrosis surrounds hepatocytes and extends into bridging fibrosis, reflecting advanced architectural distortion and nodularity characteristic of cirrhosis. Lobular disarray and hepatocyte loss contribute to disrupted lobular architecture, while residual portal and central zones display inflammatory activity. These histologic features—steatosis, ballooning degeneration, Mallory‑Denk inclusions, lobular inflammation, and pericellular fibrosis—define a spectrum of steatohepatitis within alcoholic liver disease and correlate with progressive hepatic injury. Clinically, the pattern supports a history of chronic alcohol exposure and bears significance for prognosis, risk of portal hypertension, and hepatocellular carcinoma surveillance. Differential considerations include nonalcoholic steatohepatitis and drug‑induced liver injury; however, Mallory‑Denk bodies and neutrophil predominance strongly favor alcohol‑related injury. Correlate with laboratory data (AST>ALT, elevated GGT) and clinical history for comprehensive assessment. This microcosm illustrates bridging fibrosis, residual cirrhotic nodules, and preservation of some lobular units, guiding staging, prognosis, and therapy decisions in alcoholic liver disease management.
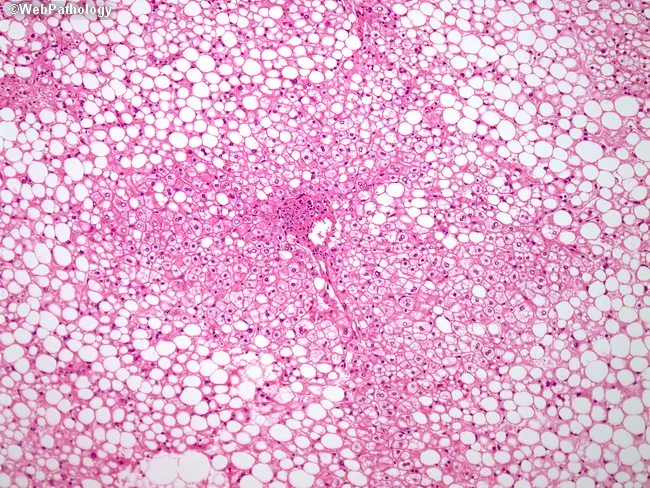
This light microscopy hematoxylin and eosin (H&E) stained liver biopsy section demonstrates alcoholic steatohepatitis with classic macrovesicular steatosis, strongest in acinar zone 3 (centrilobular/perivenular region). Large intracellular lipid droplets displace hepatocyte nuclei to the cell margins, producing a foamy cytoplasm. Hepatocellular ballooning is apparent, with occasional Mallory-Denk bodies representing cytoskeletal inclusions. Neutrophilic and lymphocytic inflammatory infiltrates interrupt hepatocyte plates around damaged cells. Pericellular (chicken-wire) fibrosis encircles hepatocytes, indicating early fibrotic remodeling that may progress to bridging fibrosis and cirrhosis. In early disease, steatosis predominates in centrilobular zones whereas periportal hepatocytes show ballooning with little lipid accumulation. The histologic constellation—macrovesicular steatosis, ballooned hepatocytes, Mallory-Denk bodies, and mixed inflammatory infiltrate with pericellular fibrosis—is highly suggestive of alcoholic hepatitis. Differential considerations include nonalcoholic steatohepatitis when ethanol exposure is uncertain; however, the distribution and cytoplasmic features support alcohol-related injury. Clinically, these findings correlate with substantial alcohol use and risk of progression to cirrhosis and hepatic failure. The image is valuable for education, biopsy interpretation, and research on hepatocellular injury, steatosis patterns, and fibrotic remodeling in alcoholic liver disease.
Alcoholic Liver Disease (ALD)
Epidemiology
- Estimated 15-30% of chronic heavy drinkers eventually develop severe liver disease.
- Cirrhosis develops in 10-30% of heavy drinkers. - Mulholland and Greenfield's Surgery, 7e
- In women, the minimum threshold is 30 g alcohol/day; in men, 50 g/day, for at least 5 years. - Mulholland
- Alcohol-related cirrhosis accounts for approximately 30% of all liver transplants in the US and 19% in Europe.
- Women are more susceptible to alcohol hepatotoxicity than men at equivalent intake levels.
- Concurrent infection with hepatitis B or C markedly amplifies the risk of severe liver disease.
Spectrum of Disease
| Stage | Key Features | Reversibility |
|---|---|---|
| Alcoholic fatty liver (steatosis) | Macrovesicular fat accumulation, hepatomegaly | Reversible with abstinence |
| Alcoholic steatohepatitis (ASH) | Neutrophil infiltration, hepatocyte injury, inflammation | Partially reversible |
| Alcoholic hepatitis | Acute inflammatory syndrome, bilirubin >3 mg/dL, high short-term mortality | Variable |
| Fibrosis | Perivenular and pericellular collagen deposition | Partially reversible (early) |
| Cirrhosis | Irreversible architectural distortion, micronodular pattern | Irreversible |
Pathogenesis
-
Ethanol metabolism - Ethanol is oxidized to acetaldehyde by alcohol dehydrogenase (ADH), catalase, or the microsomal ethanol oxidizing system (MEOS/CYP2E1). CYP2E1 is concentrated in perivenular Zone 3 of the hepatic acinus, which also has relative hypoxia and low glutathione levels - explaining why injury is centrilobular. - Mulholland and Greenfield's Surgery, 7e
-
Acetaldehyde toxicity - Acetaldehyde causes lipid peroxidation of cell membranes, producing macrosteatosis and hepatocyte "ballooning degeneration." It also increases intestinal permeability, allowing bacterial LPS (endotoxin) to reach the liver.
-
Innate immune activation - LPS activates Kupffer cells via TLR4, triggering an inflammatory cascade. TNF-alpha plays a pivotal role in ALD progression and is a key therapeutic target. - Katzung's Basic and Clinical Pharmacology, 16e
-
Oxidative stress - Failure of homeostatic antioxidant mechanisms (low Zone 3 glutathione, reduced aldehyde dehydrogenase activity) amplifies injury. - Mulholland
-
Nutritional factors - Folate deficiency and elevated hepatic homocysteine/SAH contribute to pathogenesis. Malabsorption of water-soluble vitamins compounds injury. - Yamada's Textbook of Gastroenterology, 7e
-
Hepatic stellate cell (HSC) activation - Both direct alcohol effects and acetaldehyde activate HSCs, driving fibrogenesis and collagen deposition.
Histopathology
- Macrovesicular steatosis - large fat vacuoles displacing hepatocyte nuclei, predominantly Zone 3
- Hepatocyte ballooning degeneration - pale, swollen hepatocytes with cytoskeletal disruption
- Mallory-Denk bodies (Mallory hyaline) - eosinophilic aggregates of cytokeratin intermediate filaments within ballooned hepatocytes
- Neutrophilic (lobular) inflammation - distinguishes ASH from NASH
- Pericellular "chicken-wire" fibrosis - surrounds individual hepatocytes in early fibrosis
- Perivenular and periportal fibrosis - progressing to bridging fibrosis
- Megamitochondria - characteristic finding
- Micronodular cirrhosis - nodules <3 mm, in advanced disease
Diagnosis
Lab Findings - Symptom to Diagnosis, 4e; Washington Manual
- AST:ALT ratio >2 in 70-80% of patients; ratios >3 are more specific (mean ~2.6 in ALD vs. 0.9 in NASH)
- Transaminases are usually <500 U/L (ALT <300 U/L, AST <500 U/L) - markedly elevated levels suggest another etiology
- GGT (gamma-glutamyl transpeptidase) often elevated; GGT/ALP ratio >2.5 is suggestive
- Elevated bilirubin (>3-4.5 mg/dL in alcoholic hepatitis)
- Coagulopathy (elevated PT/INR)
- Hypoalbuminemia, thrombocytopenia (in advanced disease)
Imaging
- Ultrasound or CT: can show fatty infiltration, hepatomegaly, ascites, signs of cirrhosis; primarily used to exclude other diagnoses (biliary obstruction, malignancy)
Biopsy
- Gold standard but not always necessary
- Indicated when the diagnosis is unclear or histologic staging would change management
Scoring Systems for Severity (Alcoholic Hepatitis)
| Score | Calculation | Significance |
|---|---|---|
| Maddrey Discriminant Function (mDF) | 4.6 x (PT - control) + bilirubin (mg/dL) | Score ≥32 = severe disease, consider corticosteroids |
| Glasgow Alcoholic Hepatitis Score (GAHS) | Age, WBC, BUN, PT ratio, bilirubin | Score >9 = benefit from corticosteroids |
| Lille Score | Based on bilirubin response after 7 days of steroids | Score >0.45 = non-responder, poor prognosis |
Clinical Presentations
Alcoholic Fatty Liver
- Often asymptomatic; found incidentally
- Hepatomegaly on exam
- Mild transaminase elevation
- Fully reversible with abstinence
Alcoholic Steatohepatitis / Chronic Disease
- Fatigue, RUQ discomfort, hepatomegaly
- Progressive elevation in liver enzymes
- Gradual fibrosis over years
Alcoholic Hepatitis (Acute Syndrome)
- Acute onset in a patient with long-standing heavy drinking
- Jaundice (bilirubin >3 mg/dL), fever, RUQ pain, tender hepatomegaly
- Leukocytosis with neutrophilia
- Can progress to acute liver failure with hepatic encephalopathy, ascites, hepatorenal syndrome
- In-hospital mortality for severe cases is high due to sepsis and renal failure
Cirrhosis and Complications
- Portal hypertension: esophageal/gastric varices (risk of massive hemorrhage), ascites, splenomegaly
- Hepatic encephalopathy
- Coagulopathy, hypoalbuminemia
- Hepatocellular carcinoma (HCC) risk
- Hepatorenal, hepatopulmonary, portopulmonary syndromes
Management
1. Alcohol Abstinence
- Fatty liver is reversible with complete abstinence
- Abstinence improves 5-year survival in cirrhosis: 60% with sobriety vs. 30% if drinking continues
- Referral to alcohol rehabilitation programs
- Naltrexone is most strongly supported by RCT evidence for pharmacologic treatment of alcohol use disorder
2. Nutritional Support
- Assess and correct nutrient deficiencies (folate, thiamine/B1, B12, zinc, vitamins A, C, D, K)
- Oral or enteral (small-bore feeding tube) or parenteral nutrition
- Adequate caloric intake improves nitrogen balance and may improve liver function tests
- Thiamine must be given before glucose to prevent Wernicke's encephalopathy
3. Severe Alcoholic Hepatitis (mDF ≥32)
- 40 mg/day PO for 4 weeks, then taper over 2-4 weeks
- Prednisolone preferred over prednisone (avoids hepatic conversion step)
- Reduces 28-day mortality; no proven benefit at 90 days or 1 year
- Contraindicated with active infection, GI bleeding, renal failure
- Score >0.45 = non-responder → discontinue steroids (25% vs. 85% 6-month survival)
- 400 mg PO three times daily for 4 weeks
- Nonselective phosphodiesterase inhibitor; inhibits TNF-alpha
- Recent RCT data (STOPAH trial) showed pentoxifylline did not improve survival
- May be considered in patients intolerant of corticosteroids
4. Complications Management
- Variceal hemorrhage: non-selective beta-blockers (propranolol/nadolol) for primary prophylaxis; endoscopic band ligation; TIPS for refractory cases
- Ascites: sodium restriction, spironolactone ± furosemide, paracentesis for tense ascites; spontaneous bacterial peritonitis prophylaxis
- Hepatic encephalopathy: lactulose, rifaximin, protein restriction avoidance
- HRS (hepatorenal syndrome): vasoconstrictors (terlipressin or norepinephrine) + albumin
5. Liver Transplantation - Sabiston Textbook of Surgery; Washington Manual
- Considered for end-stage liver disease (ESLD) and selected cases of severe alcoholic hepatitis
- Traditionally requires 6 months of sobriety prior to listing (the "6-month rule")
- Early liver transplantation (without 6-month abstinence) is being evaluated for highly selected patients with severe alcoholic hepatitis and excellent psychosocial support
- Accounts for ~39% of all liver transplant listings in the US (leading indication)
- Post-transplant outcomes are good in carefully selected patients who maintain abstinence
Prognosis
- Alcoholic steatosis: generally excellent with abstinence
- Alcoholic hepatitis (severe, mDF ≥32): in-hospital mortality 30-50% without treatment
- Cirrhosis with decompensation: 5-year survival ~30-60% depending on abstinence
- More than half of alcoholics with cirrhosis die within 4 years of diagnosis; two-thirds of those with concomitant alcoholic hepatitis die within 4 years - Mulholland
Key Differentials
- Non-alcoholic steatohepatitis (NASH/MASLD): AST:ALT usually <1; no alcohol history; shared histology but lacks neutrophil predominance
- Viral hepatitis (B, C): serology distinguishes; transaminases often much higher
- Drug-induced liver injury: medication history
- Autoimmune hepatitis: autoantibodies, plasma cell infiltrate on biopsy
Fatty liver
"metabolic dysfunction-associated steatotic liver disease" AND management
nonalcoholic fatty liver disease NAFLD steatosis histology ultrasound
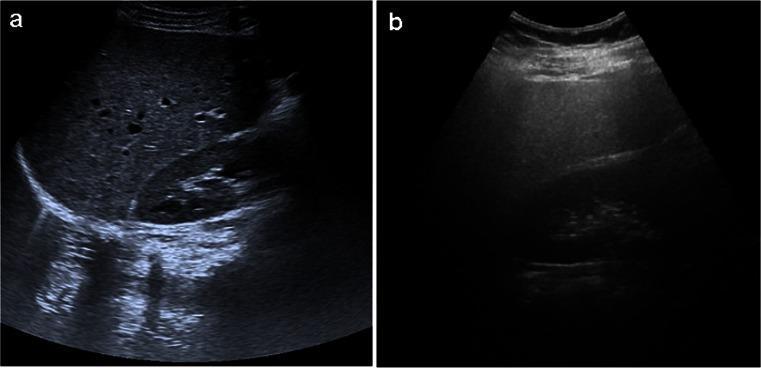
This side-by-side comparison displays two abdominal ultrasound images (B-mode) in the longitudinal plane, illustrating the diagnostic features of nonalcoholic fatty liver disease (NAFLD). Image (a) represents a normal liver, showing a solid, homogeneous echo texture with an echogenicity similar to or slightly higher than the adjacent renal cortex. Vascular structures are well-defined with clear borders, and there is minimal acoustic attenuation, allowing for distinct visualization of deep posterior structures and the diaphragm. Image (b) demonstrates hepatic steatosis (fatty liver). Key diagnostic findings include diffusely increased hepatic echogenicity (the 'bright liver' sign), which creates a significant contrast discrepancy with the renal parenchyma. Furthermore, there is a noticeable blurring of intrahepatic vascular margins and increased acoustic attenuation, resulting in poor visualization of the deeper liver parenchyma and posterior diaphragm. These findings are characteristic of moderate to severe steatosis in the context of NAFLD.
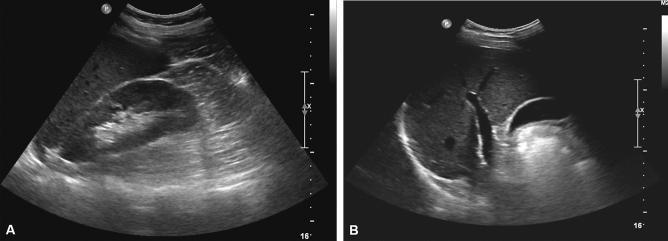
Two B-mode ultrasound images (A and B) of the liver in a 41-year-old male with nonalcoholic fatty liver disease (NAFLD). Image A shows a longitudinal view of the right upper quadrant, comparing the echogenicity of the hepatic parenchyma to the right renal cortex; the liver appears isoechoic to the kidney, which is a finding typically interpreted as no ultrasound-evident fatty liver. Image B provides a broader view of the hepatic anatomy, demonstrating clear visualization of the hepatic vessel walls and the curvilinear, hyperechoic diaphragm. There is an absence of visual indicators for chronic liver disease or cirrhosis, such as surface nodularity or coarse parenchymal texture. These images illustrate a case of discordant findings where B-mode ultrasound failed to detect hepatic steatosis that was otherwise confirmed by a high MRI proton density fat fraction (MRI-PDFF) of 9.1%. This case serves as an educational example of the sensitivity limitations of qualitative B-mode ultrasonography in detecting mild steatosis.
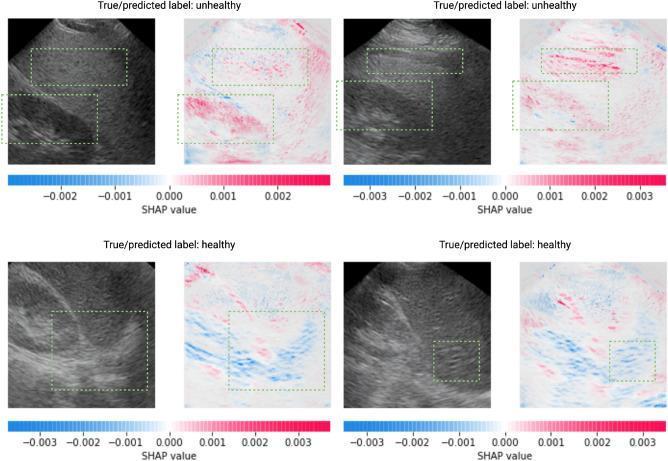
This diagnostic comparison chart features synthetic B-mode liver ultrasound images alongside SHAP (Shapley Additive Explanations) heatmaps, illustrating the classification of Nonalcoholic Fatty Liver Disease (NAFLD). The top row showcases 'unhealthy' cases characterized by increased liver echogenicity (hyperechoic) relative to the renal cortex and blurred hepatic vein boundaries, indicative of hepatic steatosis. The bottom row displays 'healthy' cases with iso-echogenic patterns between the liver and kidney and well-defined vascular structures. Each ultrasound image is paired with a SHAP value heatmap where red pixels indicate positive contributions toward an 'unhealthy' classification (concentrated in the liver and kidney cortex of fatty livers) and blue pixels indicate features contributing to a 'healthy' classification (focused on clear diaphragmatic and portal vein boundaries). Green dotted rectangles highlight specific regions of interest used by the CNN classifier to differentiate between normal and diseased liver states. This visual aid is designed for advanced medical imaging informatics and radiology education regarding AI-driven diagnostic features in hepatology.
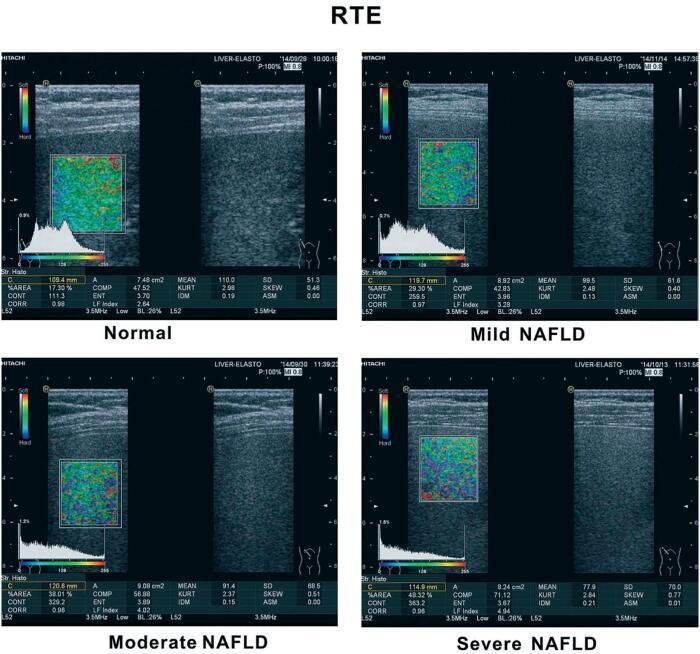
A comparative diagnostic image panel demonstrating Real-time Tissue Elastography (RTE) of the liver across four clinical stages: Normal, Mild Nonalcoholic Fatty Liver Disease (NAFLD), Moderate NAFLD, and Severe NAFLD. Each quadrant displays a B-mode ultrasound image of the liver parenchyma paired with a corresponding color-coded elastogram overlay and a histogram of strain distribution. The color scale indicates tissue stiffness, ranging from blue (hard) to red (soft). Progression from normal to severe NAFLD shows an increase in tissue heterogeneity and a visible shift in the histogram morphology. Quantitative parameters below each image track the evolution of disease, specifically showing an increasing '%AREA' (17.30% to 48.32%) and a decreasing 'MEAN' elasticity value (110.0 to 77.9), alongside increasing standard deviation (SD) values. This visual comparison illustrates the use of strain elastography to non-invasively assess and stage liver steatosis and fibrosis, providing critical diagnostic markers for metabolic liver disease management.
PMID: 41201884
NAFLD MASLD pathogenesis mechanism insulin resistance two-hit model diagram
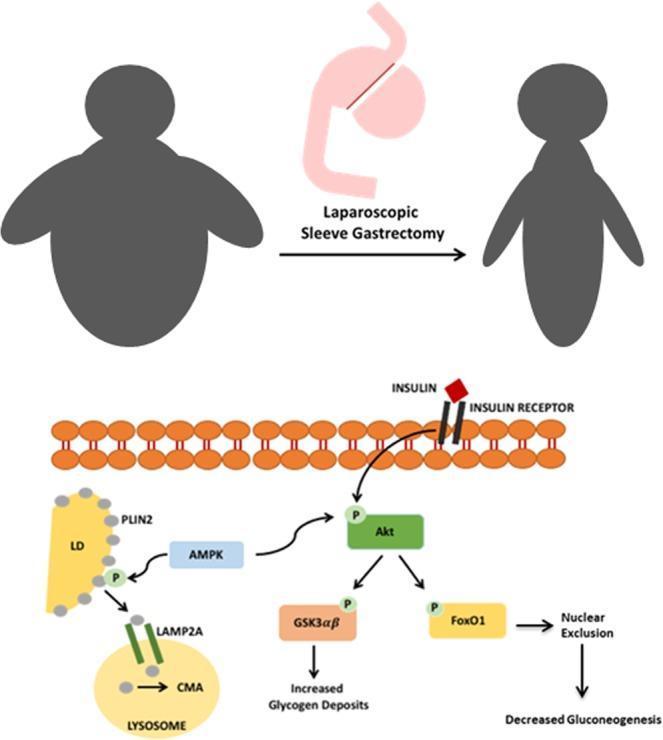
This pathophysiology diagram illustrates the proposed metabolic mechanisms underlying the reversal of Non-Alcoholic Fatty Liver Disease (NAFLD) and insulin resistance following Laparoscopic Sleeve Gastrectomy (SG). The upper section shows a clinical progression from an obese silhouette to a post-surgical weight-loss state. The lower section details cellular signaling pathways in a hepatocyte. Key features include: 1) Insulin receptor activation leading to Akt phosphorylation. 2) Downstream signaling where activated Akt phosphorylates GSK3αβ, resulting in increased glycogen deposits, and FoxO1, leading to nuclear exclusion and decreased gluconeogenesis. 3) An AMPK-mediated pathway where AMPK phosphorylates PLIN2 on lipid droplets (LD). This phosphorylation facilitates PLIN2 binding to LAMP2A, initiating Chaperone-Mediated Autophagy (CMA) within a lysosome. This mechanism demonstrates how reduced caloric intake post-SG enhances lipid catabolism and improves insulin sensitivity. The diagram is a high-level educational resource for endocrinology and gastroenterology, focusing on the interplay between bariatric surgery, AMPK activation, and hepatic metabolic regulation.
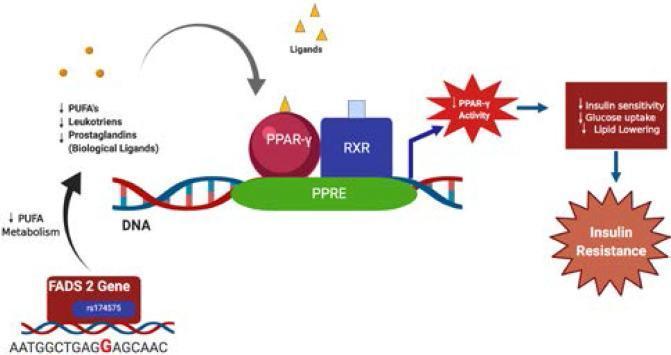
This pathophysiology diagram illustrates the suggestive molecular mechanism linking the FADS2 gene SNP rs174575 (G allele) to insulin resistance. The pathway begins with the FADS2 gene and the highlighted rs174575 variant, which leads to decreased polyunsaturated fatty acid (PUFA) metabolism. This reduction results in lower levels of biological ligands, specifically PUFAs, leukotrienes, and prostaglandins. These ligands normally bind to the Peroxisome Proliferator-Activated Receptor-gamma (PPAR-γ). In this model, altered ligand availability leads to diminished PPAR-γ activity. The diagram shows the PPAR-γ/RXR heterodimer complex bound to the Peroxisome Proliferator Response Element (PPRE) on a DNA sequence. The downstream functional consequences of decreased PPAR-γ activity are listed as reduced insulin sensitivity, decreased glucose uptake, and decreased lipid lowering. This sequence culminates in the development of insulin resistance, represented as a final starburst outcome. The illustration utilizes standard biochemical symbols, including a DNA double helix, geometric shapes for proteins (RXR, PPAR-γ), and flow arrows to indicate regulatory relationships in a cellular signaling context relevant to metabolic syndrome and Type 2 Diabetes Mellitus.
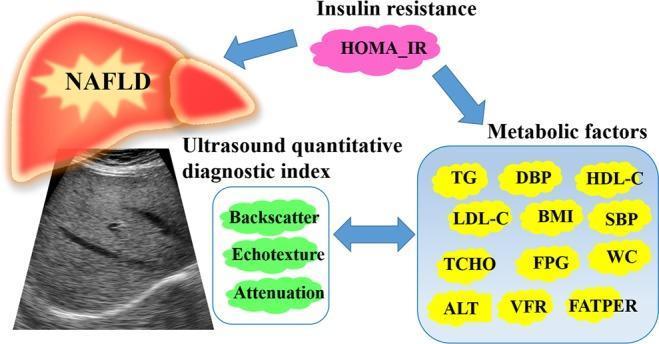
This medical infographic illustrates the pathophysiology and diagnostic interrelationships of non-alcoholic fatty liver disease (NAFLD) and metabolic syndrome. The diagram is organized into four primary domains: clinical pathology, metabolic indicators, insulin resistance, and diagnostic imaging. At the top, a pink cloud representing insulin resistance (labeled HOMA_IR) connects via directional arrows to NAFLD (depicted as a stylized liver illustration) and to a blue panel of 'Metabolic factors'. These factors include clinical and laboratory parameters such as BMI, waist circumference (WC), blood pressure (SBP/DBP), lipid profiles (TG, HDL-C, LDL-C, TCHO), glycemic markers (FPG), and liver enzymes (ALT). The lower-left portion features a diagnostic B-mode ultrasound image of the liver showing a granular echotexture characteristic of hepatic steatosis. This imaging modality is linked to an 'Ultrasound quantitative diagnostic index' (QDI), which focuses on three key acoustic parameters: Backscatter, Echotexture, and Attenuation. A bidirectional arrow between the QDI parameters and the metabolic factors highlights the correlation between quantitative imaging biomarkers and the patient's systemic metabolic state, emphasizing the role of ultrasound in grading NAFLD severity and monitoring metabolic disarrangement.
Fatty Liver Disease (Hepatic Steatosis)
Nomenclature (2023 Update)
| Old Term | New Term | Definition |
|---|---|---|
| NAFLD | MASLD (Metabolic Dysfunction-Associated Steatotic Liver Disease) | Hepatic steatosis + ≥1 cardiometabolic risk factor; alcohol <20 g/d (women) or <30 g/d (men) |
| NASH | MASH (Metabolic Dysfunction-Associated Steatohepatitis) | MASLD + steatohepatitic injury (inflammation + ballooning ± fibrosis) |
| - | MetALD | Metabolic dysfunction + moderate alcohol use (20-50 g/d women; 30-60 g/d men) |
| ALD | ALD | Heavy alcohol use regardless of metabolic status |
Epidemiology
- 25-30% of U.S. adults currently have MASLD; projected to exceed 30% by 2030
- At least 3-6% of MASLD patients have MASH with hepatocyte injury
- MASH is increasingly common in patients ≥50 years (found in ~14% undergoing colon cancer screening)
- Prevalence of clinically significant fibrosis (≥F2) has more than doubled in the past two decades
- MASLD/MASH is now a leading indication for liver transplantation in the US
- The disease is rising in children and adolescents, paralleling the childhood obesity epidemic
- Cardiovascular disease (not liver disease) is the most common cause of death in NAFLD/MASLD patients - Washington Manual; Robbins Pathology
Types of Steatosis
Macrovesicular Steatosis
- A single large fat vacuole (triglyceride) displaces the nucleus to the cell periphery
- Characteristic of ALD and MASLD
- Most common form
Microvesicular Steatosis
- Multiple small fat globules with a central, intact nucleus
- Associated with mitochondrial dysfunction (acute fatty liver of pregnancy, Reye syndrome, valproate toxicity, tetracycline toxicity)
- Often more clinically severe
Causes and Risk Factors
Metabolic / MASLD
- Obesity (central/visceral adiposity)
- Type 2 diabetes mellitus / insulin resistance
- Metabolic syndrome (dyslipidemia, hypertension)
- Polycystic ovarian syndrome
- Rapid weight loss, prolonged fasting, total parenteral nutrition
Alcohol-Related (ALD)
- Women: >30 g/day; Men: >50 g/day for >5 years (threshold for cirrhosis risk)
- Alcoholic fatty liver develops in ~90% of heavy drinkers (>6 drinks/day)
Secondary Causes
- Medications: corticosteroids, tamoxifen, amiodarone, methotrexate, valproate, tetracycline
- Nutritional: protein malnutrition (kwashiorkor), starvation
- Metabolic disorders: Wilson's disease, lipodystrophy, abetalipoproteinemia
- Surgical: post-jejunoileal bypass, extensive small bowel resection
- Other liver diseases: hepatitis C (especially genotype 3), hemochromatosis (superimposed injury accelerates MASLD)
Pathogenesis of MASLD
Step 1 - Steatosis (Lipid Accumulation)
- Resistance to insulin → overactivity of lipoprotein lipase → increased release of free fatty acids (FFAs) from adipocytes
- Dysfunctional adipocytes reduce adiponectin production → less FFA oxidation by skeletal muscle → increased FFA uptake by hepatocytes
- FFAs are stored as triglycerides in hepatocytes
- Hepatocytes also down-regulate lipophagy (selective autophagy of lipid droplets), further trapping fat
- High dietary fructose independently increases steatosis and fibrosis risk
Step 2 - Hepatocellular Injury (MASH)
- Fat-laden hepatocytes are highly susceptible to lipid peroxidation from oxidative stress
- Mitochondrial and plasma membrane damage → apoptosis or necrosis
- Dysfunctional adipocytes release proinflammatory cytokines (particularly TNF-α)
- Gut-derived endotoxin (LPS) - increased gut permeability activates Kupffer cells via TLR4
- High fructose diet and obstructive sleep apnea (via intermittent hypoxia) promote progression
Step 3 - Fibrosis and Cirrhosis
- TNF-α and TGF-β from Kupffer cells activate hepatic stellate cells (HSCs)
- HSC activation → collagen deposition → pericellular ("chicken-wire") fibrosis → bridging fibrosis → cirrhosis
- Genetic variants (e.g., PNPLA3 I148M SNP) significantly modulate risk and severity
Histopathology
Simple Steatosis (MASL)
- Macrovesicular fat droplets in ≥5% of hepatocytes
- No inflammation or ballooning
- Low risk of progression
MASH (requires all three for diagnosis):
- Steatosis (≥5% of hepatocytes)
- Lobular inflammation (mixed inflammatory infiltrate - lymphocytes predominate in MASH vs. neutrophils in ASH)
- Hepatocyte ballooning (swollen, pale hepatocytes with cytoskeletal injury)
Additional features:
- Mallory-Denk bodies (cytokeratin aggregates; more common and prominent in ALD)
- Pericellular/sinusoidal fibrosis ("chicken-wire" pattern - blue fibers on Masson trichrome)
- Periportal/portal fibrosis (more common in pediatric MASLD, unlike ALD which is predominantly perivenular)
- Progression to bridging fibrosis and ultimately macronodular cirrhosis
Histology Images (from Robbins Pathology):
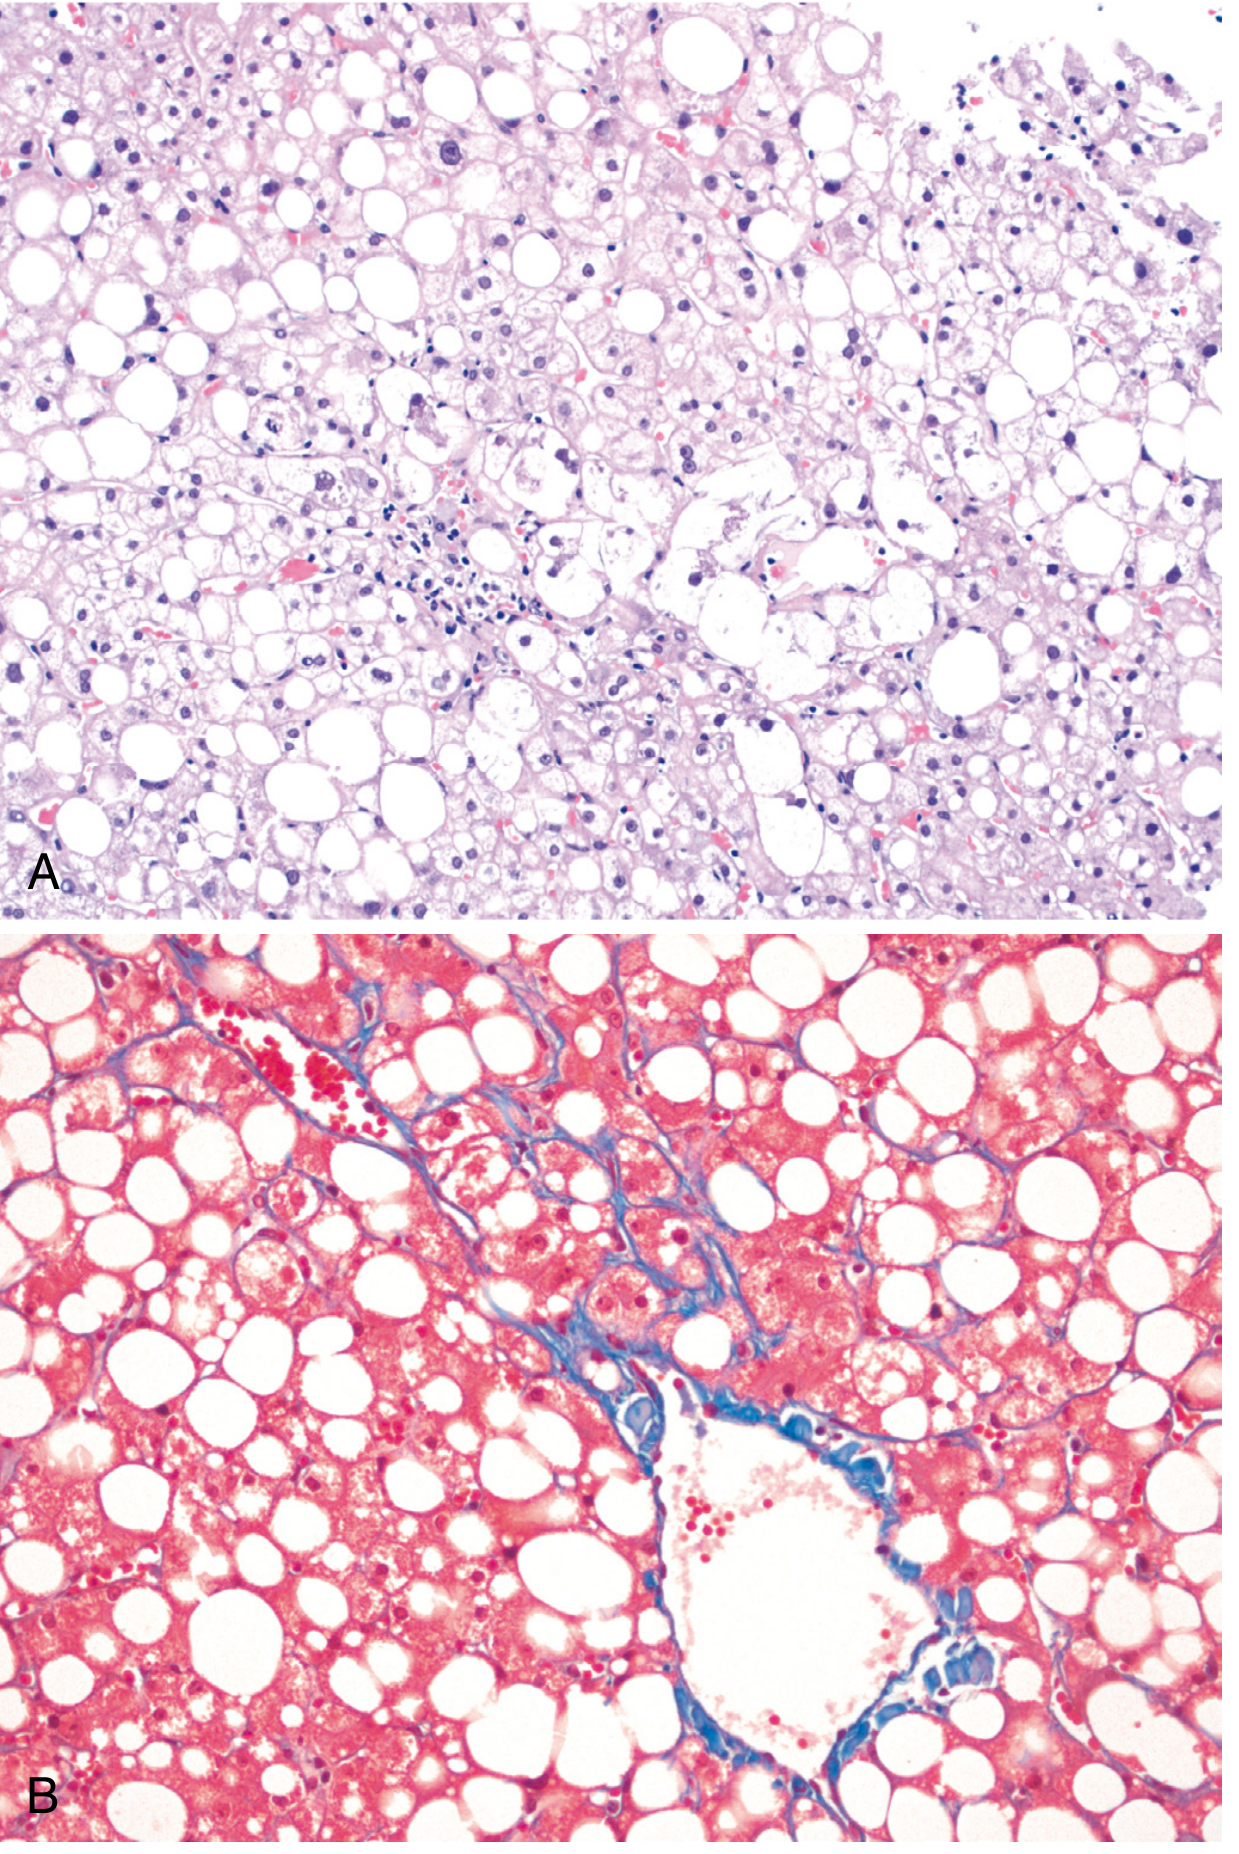
Clinical Features
- Often asymptomatic - most patients discovered incidentally (imaging, routine LFTs)
- Nonspecific symptoms: fatigue, right-sided abdominal discomfort, hepatomegaly
- Features of metabolic syndrome on examination (obesity, hypertension, acanthosis nigricans)
- Advanced disease: signs of portal hypertension, ascites, splenomegaly, encephalopathy
Diagnosis
Laboratory Tests
- AST and ALT mildly elevated (typically 1-4x upper limit of normal); unlike ALD, ALT often > AST (AST:ALT <1 in MASLD vs. >2 in ALD)
- GGT may be elevated
- Elevated fasting glucose, insulin, triglycerides; low HDL
- Elevated ferritin (reflects inflammation, not iron overload)
- Advanced disease: low albumin, elevated PT/INR, thrombocytopenia
Imaging
- "Bright liver" sign - increased echogenicity vs. renal cortex
- Blurring of intrahepatic vessel margins and posterior acoustic attenuation (moderate-severe steatosis)
- Sensitive for >30% steatosis; insensitive for mild steatosis
Fibrosis Staging - Non-Invasive Tests (NITs)
| FIB-4 Score | Interpretation | Action |
|---|---|---|
| <1.3 | Low risk for advanced fibrosis | Follow in primary care every 1-3 years |
| 1.3-2.67 | Indeterminate | Second-line testing (VCTE or ELF) |
| ≥2.67 | High risk for advanced fibrosis | Refer to hepatology |
- <8 kPa = Low risk, <8-12 kPa = Intermediate, >12 kPa = High risk
Liver Biopsy
- Gold standard for diagnosis of MASH and staging of fibrosis
- Required when diagnosis is uncertain after NITs, or when therapeutic decisions depend on histology
- Not routinely needed in all patients - NITs are preferred for initial risk stratification
- Graded by NAS (NAFLD Activity Score) or SAF score for research purposes
Evaluation Algorithm (Harrison's 22e):
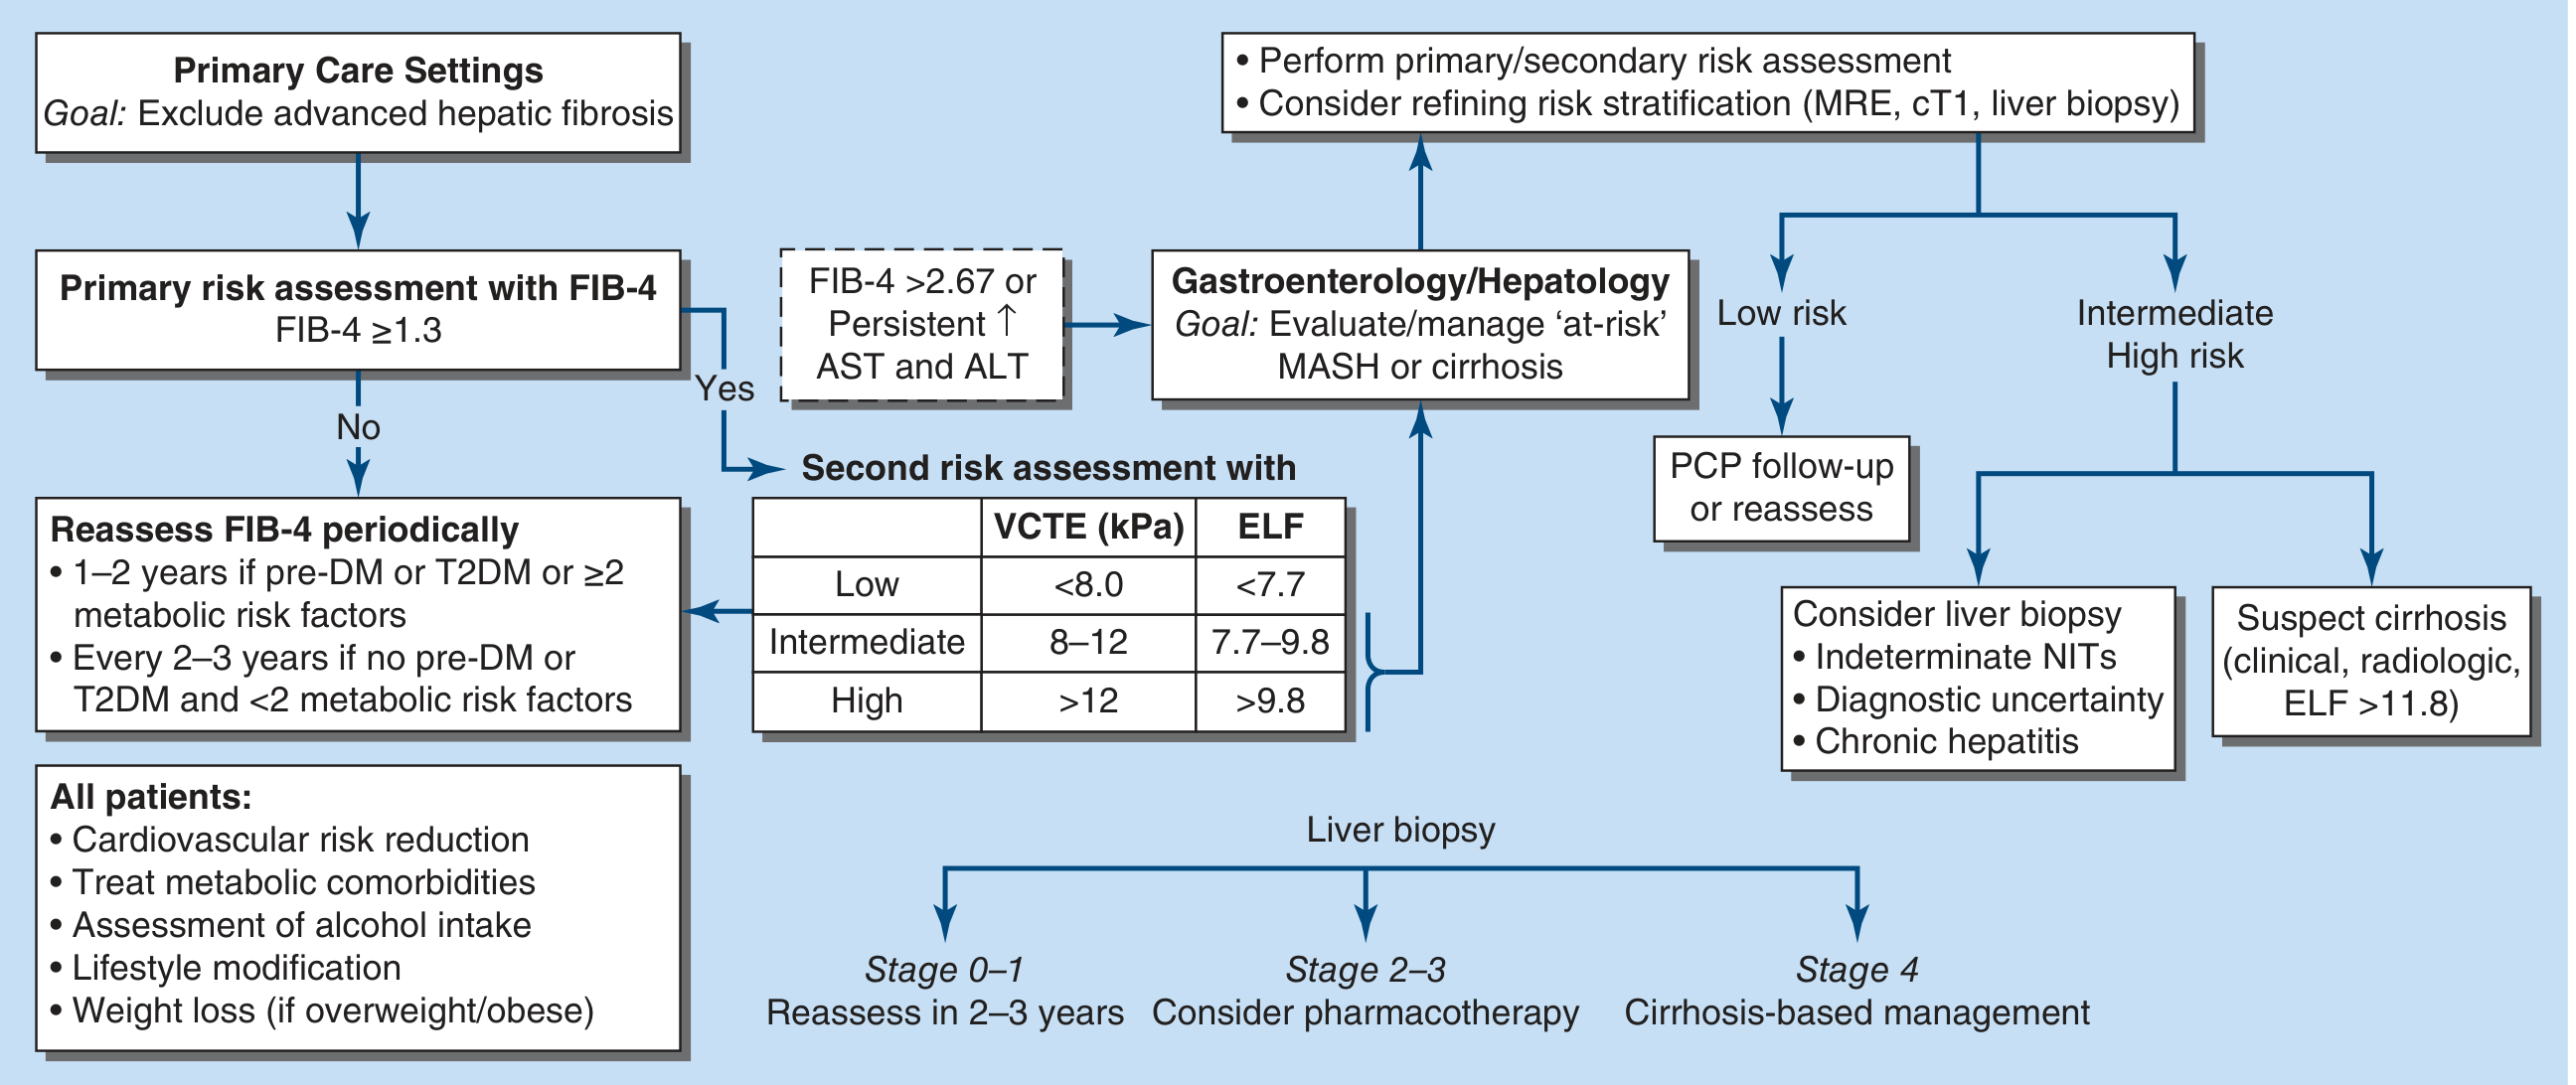
Management
1. Lifestyle Modification (Cornerstone of All Treatment)
- 3% body weight loss → improvement in steatosis
- 7-10% body weight loss → resolution of MASH on histology
- ≥10% body weight loss → fibrosis regression
- <20% of patients maintain weight loss long-term (major limitation)
- Mediterranean diet - preferred for long-term adherence, cardiovascular benefit, and cultural flexibility
- Low carbohydrate, low fructose, reduced saturated fat
- Coffee (≥3 cups/day) - epidemiologic and meta-analysis data support reduced fibrosis and HCC risk
- Moderate aerobic exercise ≥5 times/week, ≥150 min/week total
- Improves insulin sensitivity and MASLD independent of weight loss
- Aerobic and resistance training are both beneficial
2. Pharmacologic Therapies
FDA-Approved (as of 2025-2026):
- Selective thyroid hormone receptor-beta (THR-β) agonist
- Indication: MASH with moderate-to-advanced fibrosis (F2-F3), without cirrhosis
- Dose: 80 or 100 mg orally once daily
- MAESTRO-NASH trial (52 weeks, 966 patients): resmetirom 100 mg vs. placebo
- MASH resolution: 30% vs. 10% (p<0.0001)
- ≥1 stage fibrosis improvement: 26% vs. 14% (p<0.0001)
- Side effects: transient nausea, loose stools (early)
- GLP-1 receptor agonist
- Indication: MASH with stage F2-F3 fibrosis
- ESSENCE trial (72 weeks): vs. placebo
- MASH resolution: 62.9% vs. 34.3% (p<0.001)
- ≥1 stage fibrosis reduction: 36.8% vs. 22.4% (p<0.001)
- Patient selection using NITs: VCTE 8-15 kPa, MRE 3.1-4.4 kPa, or ELF 9.2-10.5
- Side effects: nausea, diarrhea, constipation, vomiting (mild and transient); monitor for pancreatitis, gallbladder disease, thyroid C-cell tumors
- Lifestyle modification remains essential alongside semaglutide
- Not approved for MASH cirrhosis (VCTE >20 kPa)
Other Agents (Non-first-line, used in selected patients):
| Drug | Evidence | Current Role |
|---|---|---|
| Vitamin E (800 IU/day) | Improves histology in biopsy-proven MASH (non-diabetic adults) | Considered in non-diabetic, non-cirrhotic MASH after discussion of risks (prostate cancer) |
| Pioglitazone (TZD) | Improves steatosis, inflammation, possibly fibrosis in MASH with T2DM | Considered in biopsy-proven MASH + T2DM; risk of fluid retention, weight gain |
| Metformin | Improves insulin sensitivity but does not improve liver histology | Not recommended specifically for MASH |
| GLP-1 agonists (liraglutide) | Improves NASH histology; weight loss benefit | Used primarily for diabetes/obesity management |
| Statins | Do not directly treat MASH but safe to use; reduce cardiovascular risk | Recommended for cardiovascular risk reduction |
3. Bariatric / Metabolic Surgery
- Consider for eligible obese patients with MASH (BMI ≥35 or ≥30 with comorbidities)
- Sleeve gastrectomy and Roux-en-Y gastric bypass produce sustained weight loss
- Prospective studies demonstrate significant improvement or resolution of MASH histologically
- Not specifically approved as a MASH treatment but strongly benefits metabolic comorbidities
4. Liver Transplantation
- For MASH-related end-stage liver disease (ESLD) or HCC
- MASH cirrhosis is now one of the leading transplant indications
- Recurrence of MASLD in the transplanted liver can occur if metabolic risk factors are not controlled
Natural History and Prognosis
| Stage | Rate of Progression | Risk |
|---|---|---|
| Isolated steatosis (MASL) | ~25% progress to MASH | Low; generally benign course |
| MASH | ~11% progress to cirrhosis over 15 years | Increased mortality (liver + cardiovascular) |
| MASH + F2-F3 fibrosis | Significant progression risk | High risk of cirrhosis, HCC |
| Cirrhosis (MASH) | Decompensation, HCC, death | High liver-related mortality |
- Cardiovascular disease is the leading cause of death overall in MASLD patients (not liver disease)
- MASLD increases risk of both primary liver cancers (HCC) and extrahepatic malignancies even in non-cirrhotic livers
- Fibrosis stage (not degree of steatosis or inflammation) is the strongest predictor of liver-related mortality
Comparison: MASLD vs. ALD
| Feature | MASLD/MASH | ALD/ASH |
|---|---|---|
| Alcohol | Minimal (<20-30 g/d) | Heavy (>30-50 g/d) |
| AST:ALT ratio | Usually <1 | Usually >2 (often >3) |
| GGT | Elevated | Markedly elevated |
| Associated conditions | Obesity, T2DM, MetS | Alcohol use disorder |
| Histology (steatosis) | Macrovesicular, diffuse | Macrovesicular, predominantly Zone 3 |
| Inflammation | Mixed; lymphocytes predominate | Neutrophils predominate |
| Mallory-Denk bodies | Less prominent | More prominent |
| Fibrosis pattern | Portal/perisinusoidal (adult); Portal (pediatric) | Perivenular/perisinusoidal (Zone 3) |
| Fibrosis reversibility | Yes (with weight loss/treatment) | Yes (with abstinence) |