
Give all the diagrams related to the cardiovascular system in anatomy & physiology
Reading File
Now let me search for cardiovascular anatomy & physiology books and find all relevant image blocks.
Finding Sources
Finding Sources
Finding Sources
Now let me search for cardiovascular diagrams/images across anatomy and physiology books simultaneously:
Finding Sources
Finding Sources
Good. Now let me read the key cardiovascular sections from physiology books to extract all image URLs:
Finding Sources
Excellent - I'm finding many images. Let me now do a broader sweep to get all cardiovascular diagrams across all anatomy & physiology books:
Finding Sources
I'm getting truncated results. Let me read the actual block files to extract all image URLs from cardiovascular sections. Let me target the key physiology blocks I've already identified:
Reading File
Reading File
I have the first block of Costanzo. The output was truncated - I got many images from it. Let me now use a targeted SQL approach to extract ALL image URLs from cardiovascular sections across both anatomy and physiology books efficiently:
Finding Sources
Finding Sources
I now have a rich set of cardiovascular diagrams from both anatomy and physiology textbooks. Let me compile and display all of them now.Here are all the cardiovascular system diagrams found across the anatomy and physiology textbooks in the library:
Cardiovascular System Diagrams - Anatomy & Physiology
PHYSIOLOGY TEXTBOOKS
Costanzo Physiology 7th Edition
Fig. 4.10 - Effect of Heart Rate on Contractility: Positive Staircase & Postextrasystolic Potentiation
Section: Effect of Heart Rate on Contractility
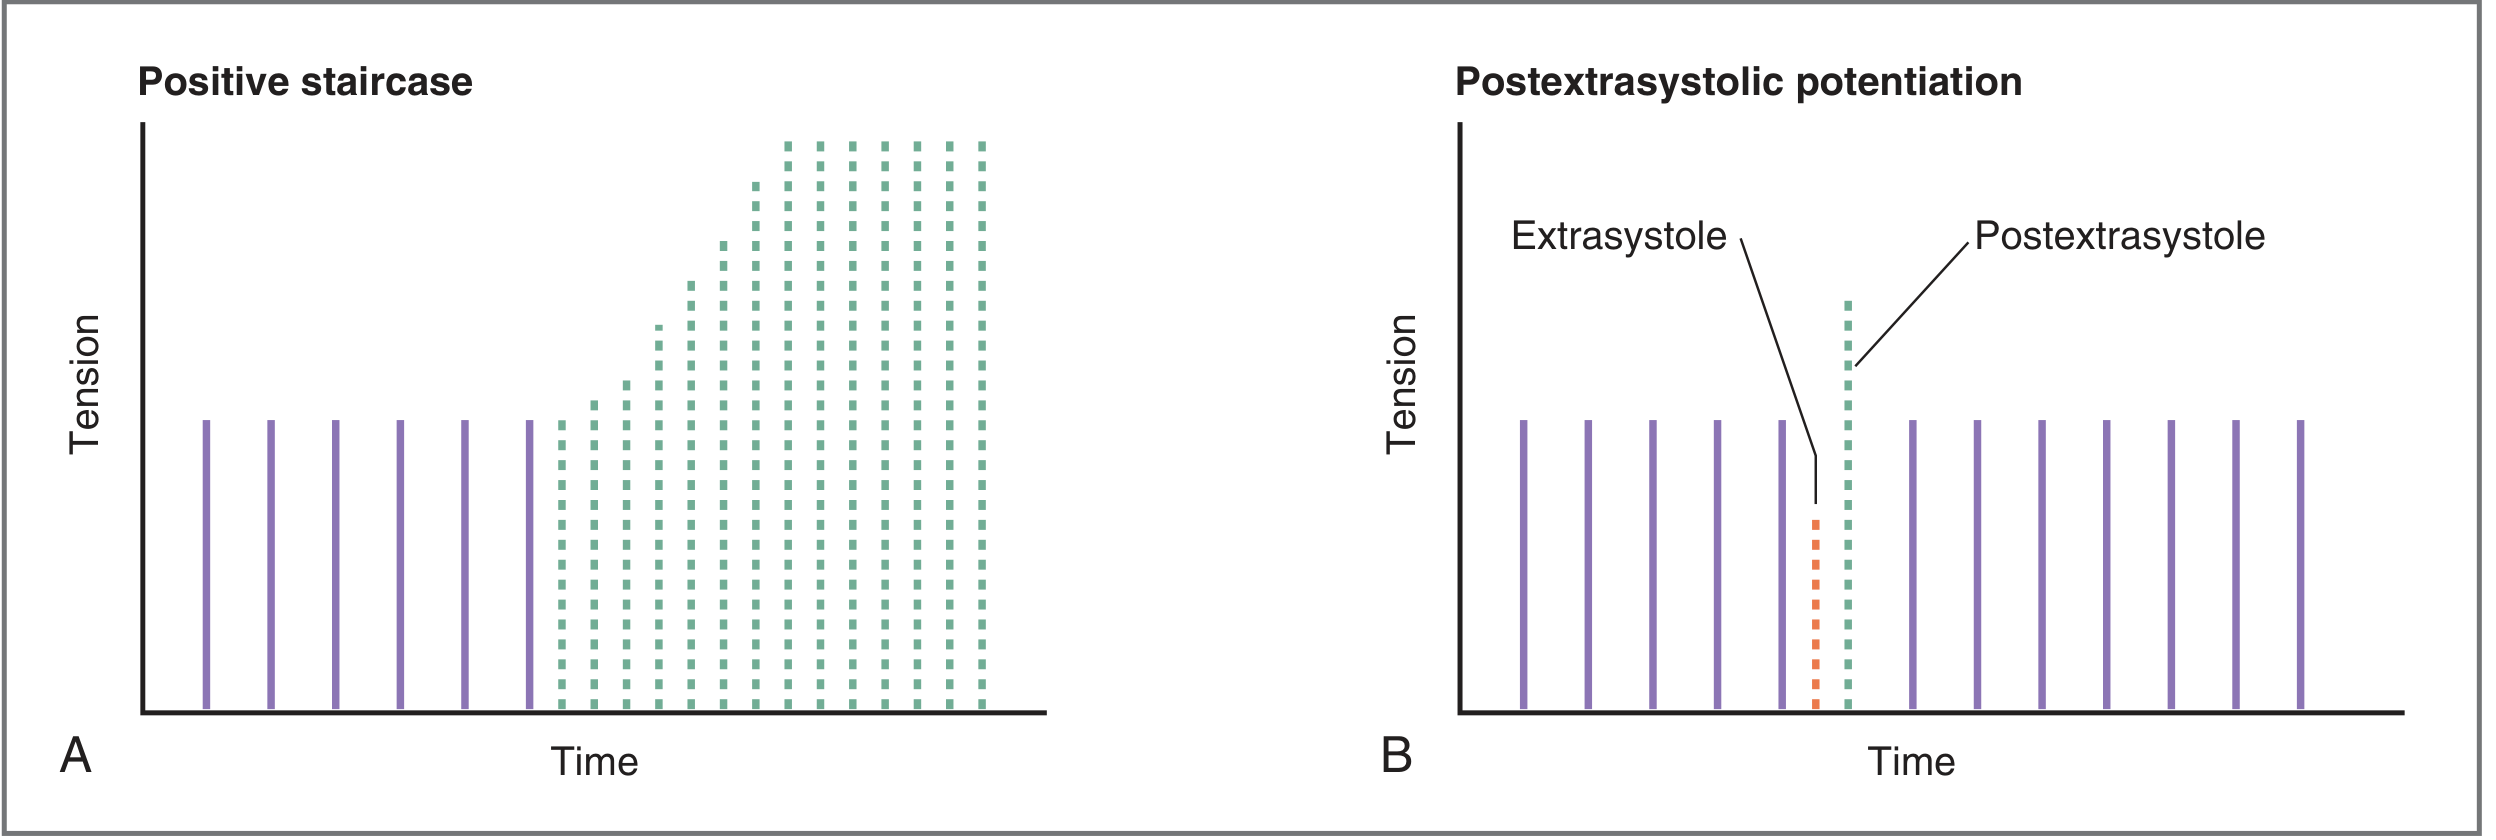
Two graphs showing tension vs time demonstrating how heart rate changes affect contractility - the Bowditch staircase effect (A) and postextrasystolic potentiation (B).
Fig. - Mechanism of Cardiac Glycosides on Contractility
Section: Effect of Cardiac Glycosides on Contractility
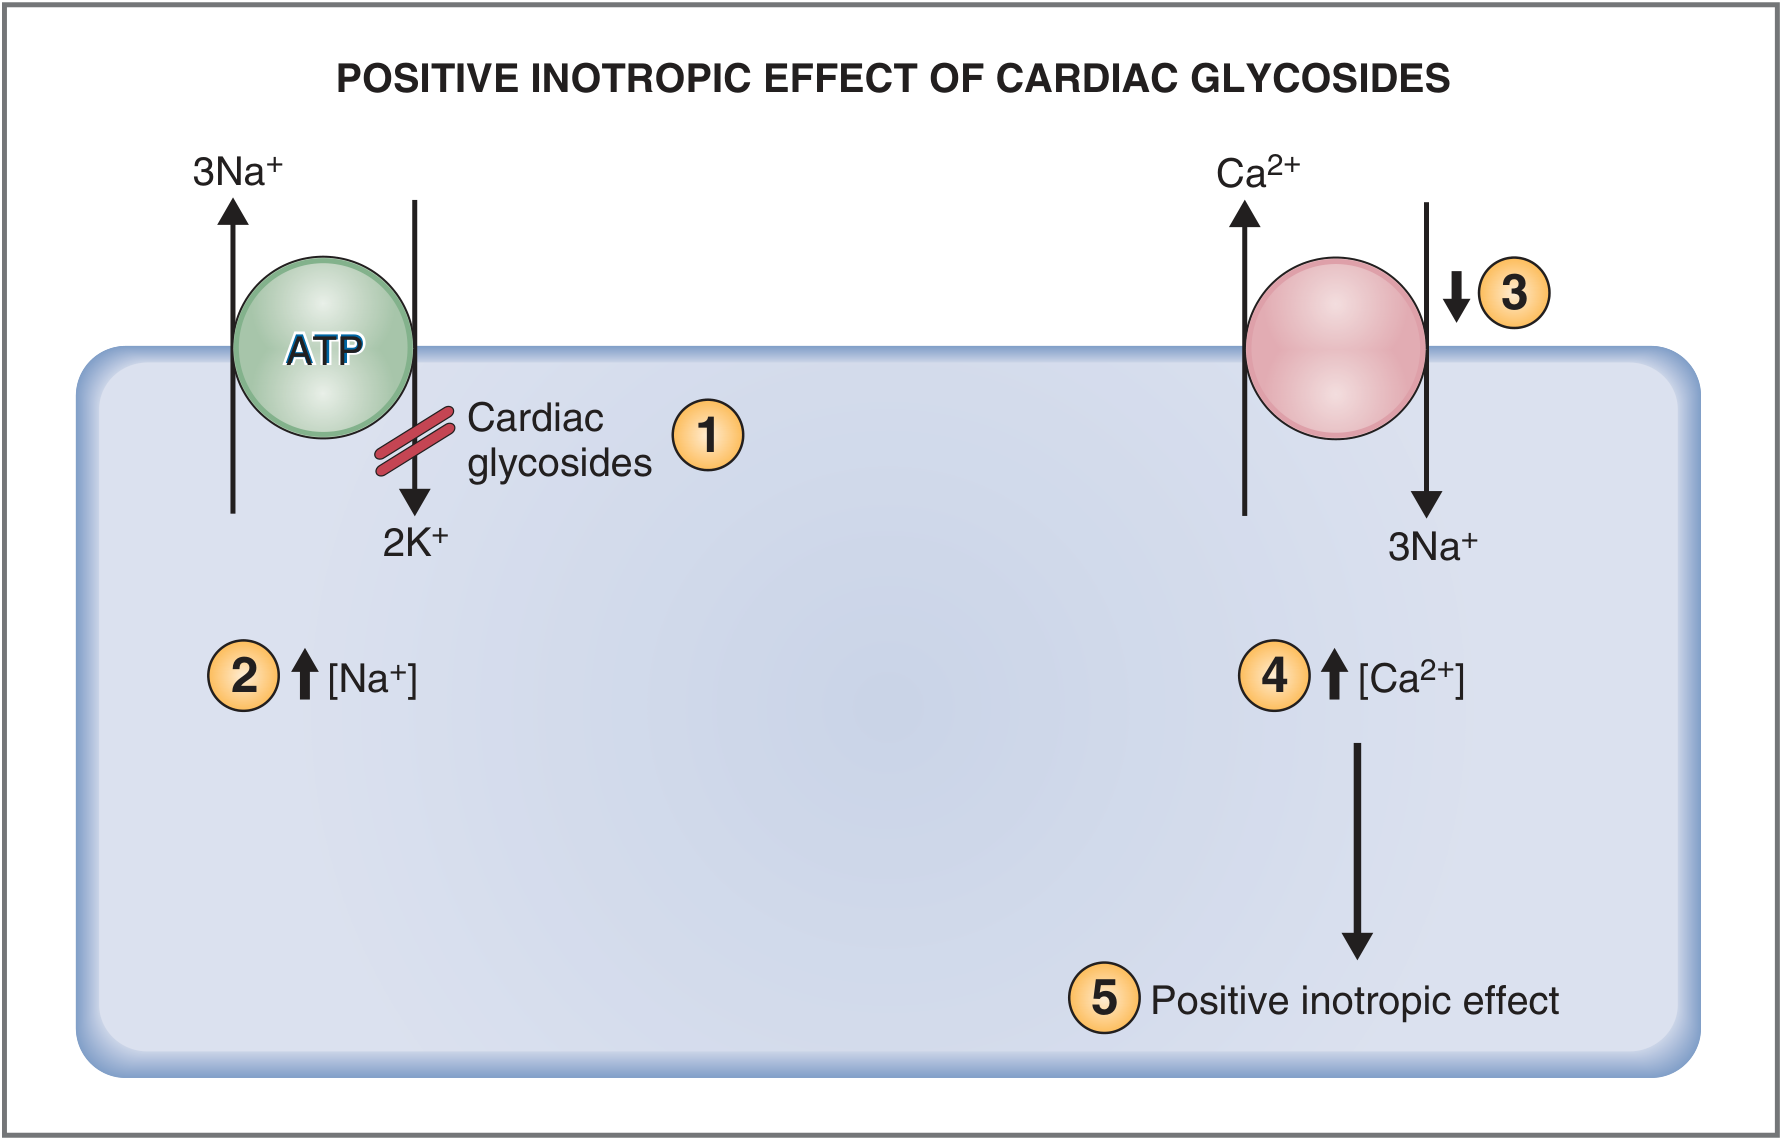
Diagram of the Na+/K+-ATPase pump inhibition by cardiac glycosides, showing how intracellular Ca2+ rises to increase contractility.
Fig. 4.21 - Systolic and Diastolic Left Ventricular Pressure-Volume Curves
Section: Length-Tension Relationship in Cardiac Muscle
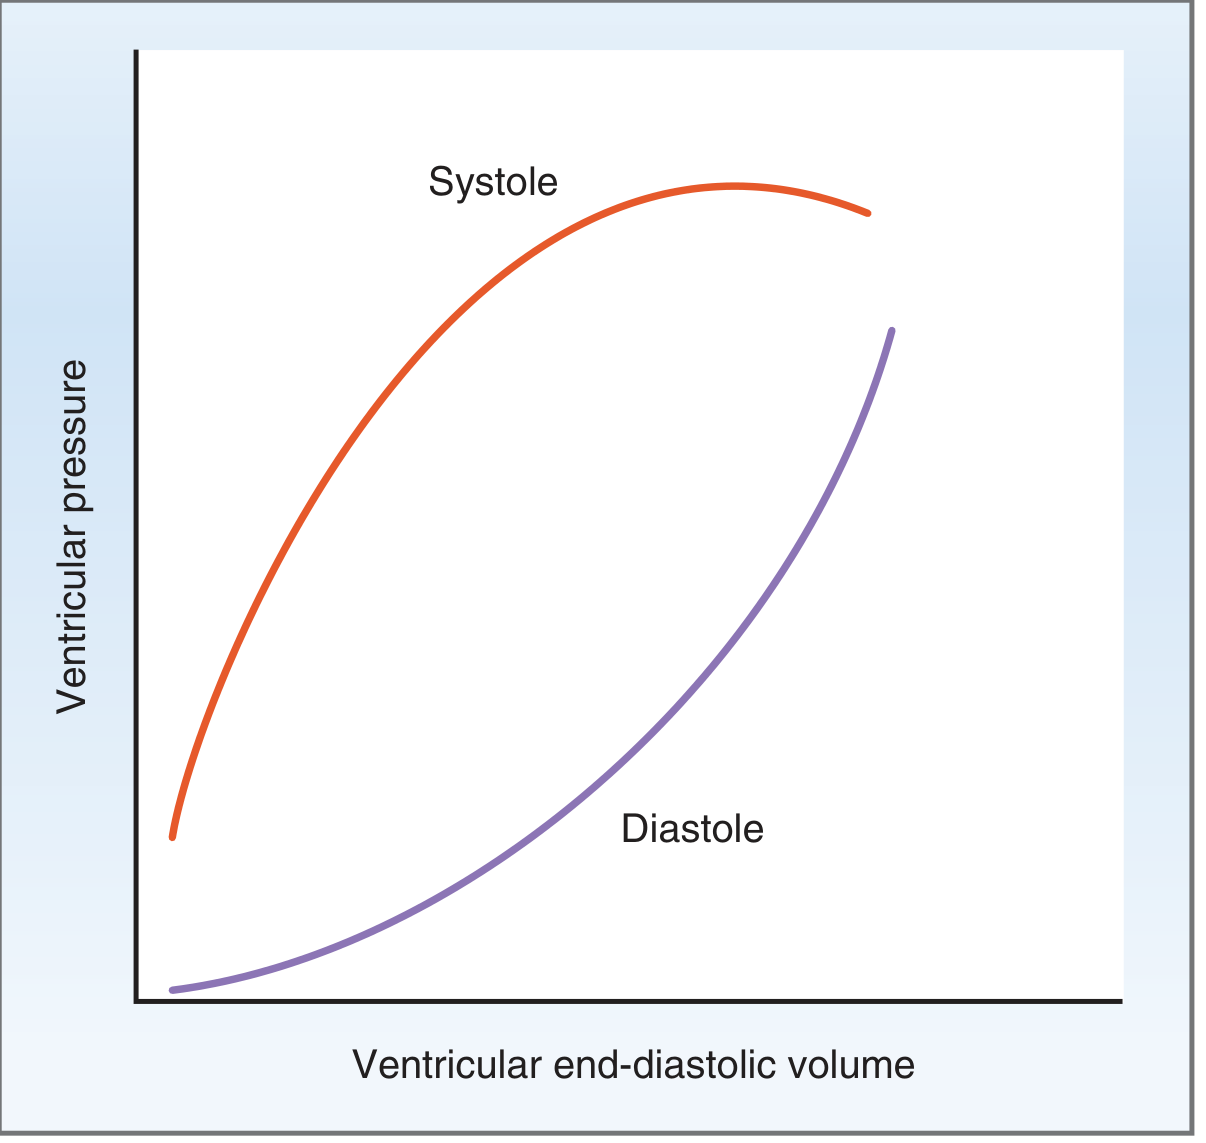
Active (systolic) and passive (diastolic) pressure as a function of end-diastolic volume - the length-tension curve extended to the whole ventricle.
Fig. 4.26 - Normal Ventricular Pressure-Volume Loop
Section: Normal Ventricular Pressure-Volume Loop

The full cardiac cycle shown as a pressure-volume loop - diastolic filling, isovolumetric contraction, ejection, and isovolumetric relaxation.
Fig. - Cardiac Function (Frank-Starling) Curve
Section: Cardiac Function Curve

Cardiac output plotted as a function of right atrial pressure (preload), illustrating the Frank-Starling mechanism at the whole-heart level.
Fig. - Cardiac Output and Venous Return Curves
Section: Cardiac Output Curve / Vascular Function Curve

The equilibrium point where cardiac output equals venous return, used to predict steady-state cardiac output and right atrial pressure.
Fig. - ECG Waveform
Section: Electrocardiogram (ECG)

The normal ECG waveform with P, QRS, and T waves labeled, showing the electrical events of the cardiac cycle.
Fig. - Circuitry of the Cardiovascular System
Section: Circuitry of the Cardiovascular System

Overview diagram of the entire cardiovascular circuit - pulmonary (right heart to lungs) and systemic (left heart to body) circulations.
Fig. - Pressures in the Cardiovascular System
Section: Pressures in the Cardiovascular System

Normal pressure values (mmHg) at each point in the pulmonary and systemic circulations, from arteries through capillaries to veins.
Fig. - Cardiac Action Potentials
Section: Cardiac Action Potentials

Comparison of ventricular myocyte (fast response) and SA node pacemaker (slow response) action potentials with their ionic mechanisms.
Fig. - Brain Stem Cardiovascular Centers
Section: Brain Stem Cardiovascular Centers

Medullary cardiovascular control centers (vasomotor and cardioinhibitory) and their autonomic efferent pathways.
Medical Physiology (Boron & Boulpaep)
Fig. - Cardiac Muscle Morphology (Intercalated Discs)
Section: Action potentials propagate between adjacent cardiac myocytes through gap junctions

Cardiac myocyte ultrastructure showing intercalated discs (desmosomes + gap junctions) that mechanically and electrically couple adjacent cells.
Fig. - Early Embryonic Circulation and Development of Major Blood Vessels
(from General Anatomy & Musculoskeletal System, THIEME Atlas)
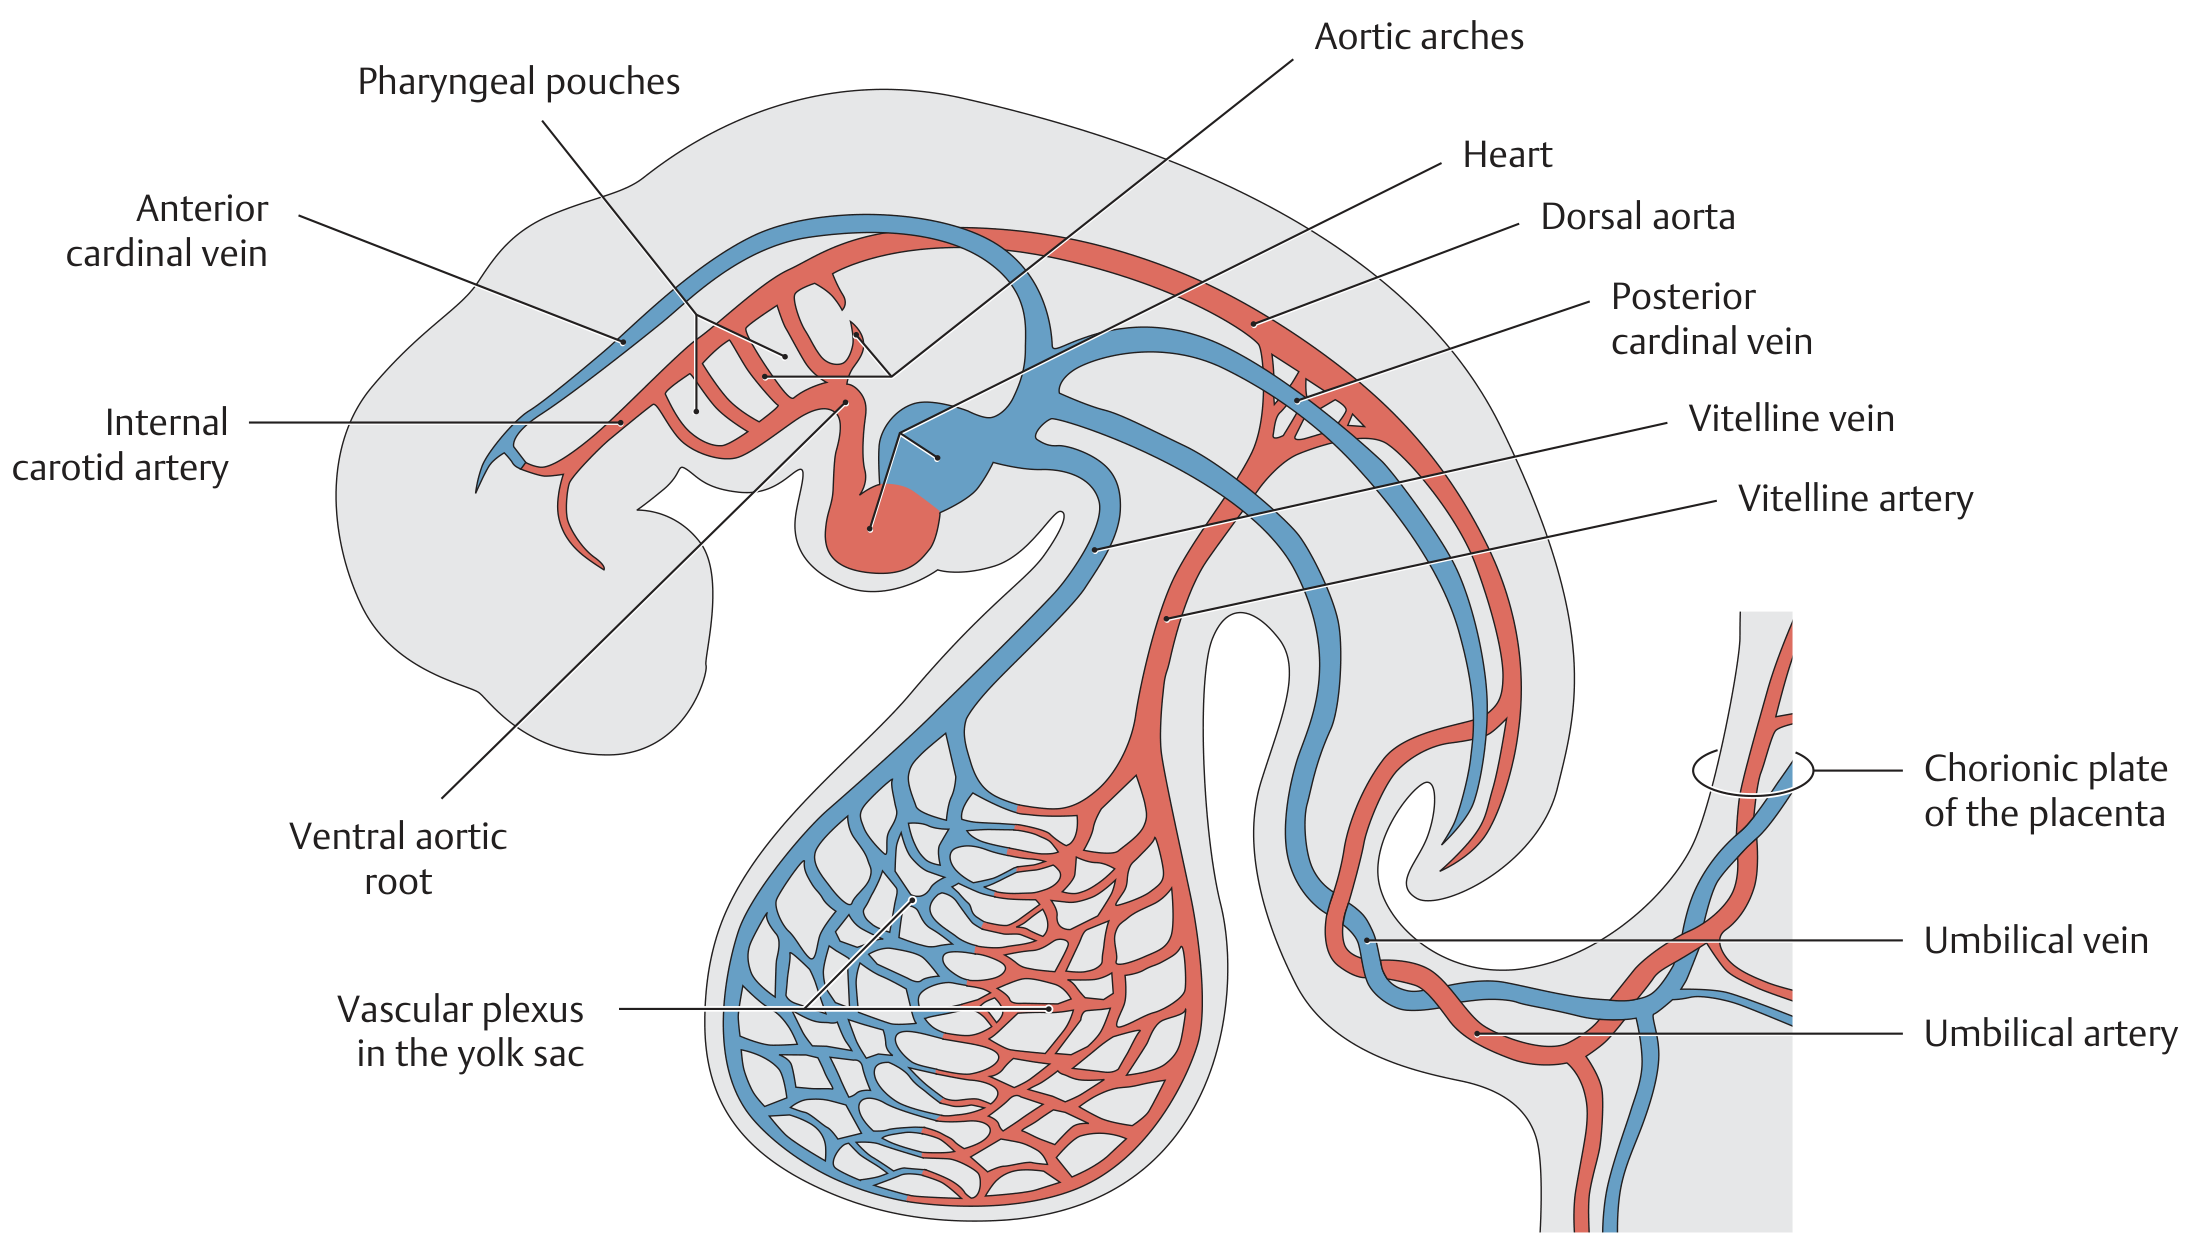
Cross-sectional view of embryonic circulation showing development of major arterial and venous vessels (red = arteries, blue = veins).
General Anatomy & Musculoskeletal System (THIEME Atlas)
Fig. - Lower Limb Arterial Supply (Aorta to Foot)
Section: Branches of the posterior tibial artery
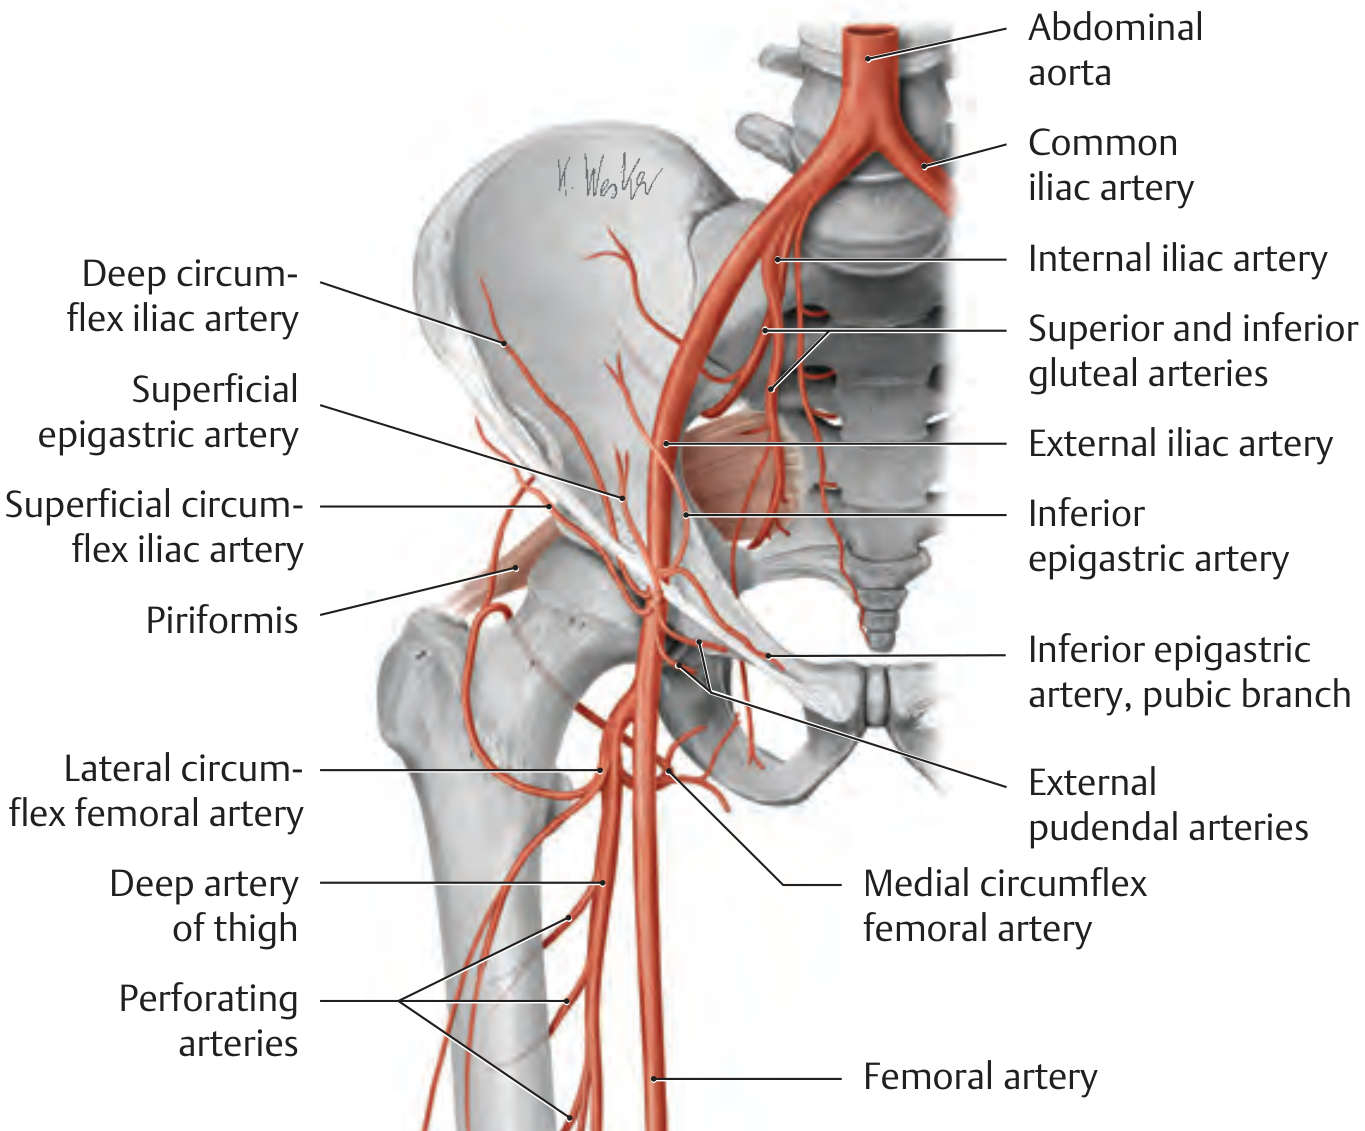
Overview diagram of lower limb arterial supply from the abdominal aorta through femoral, popliteal, and tibial arteries.
Fig. - Popliteal and Genicular Arteries
Section: Branches of the posterior tibial artery
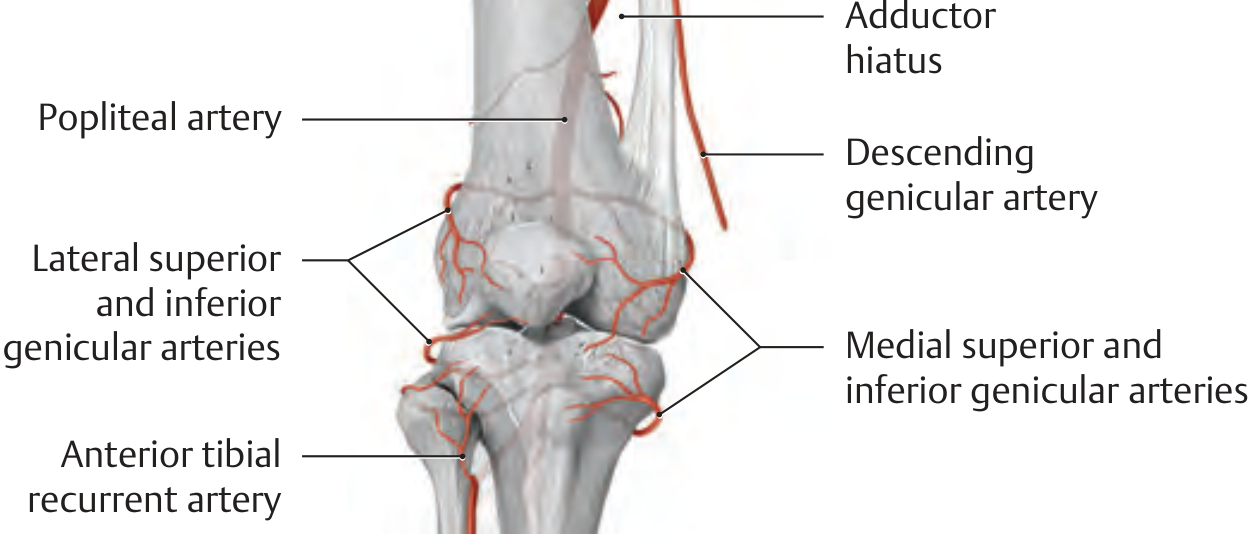
Detailed branching of the popliteal artery into genicular and tibial branches at the knee.
Fig. - Arterial Supply of the Testis (Lymphatic & Arterial Pathways)
Section: Blood supply of the testis
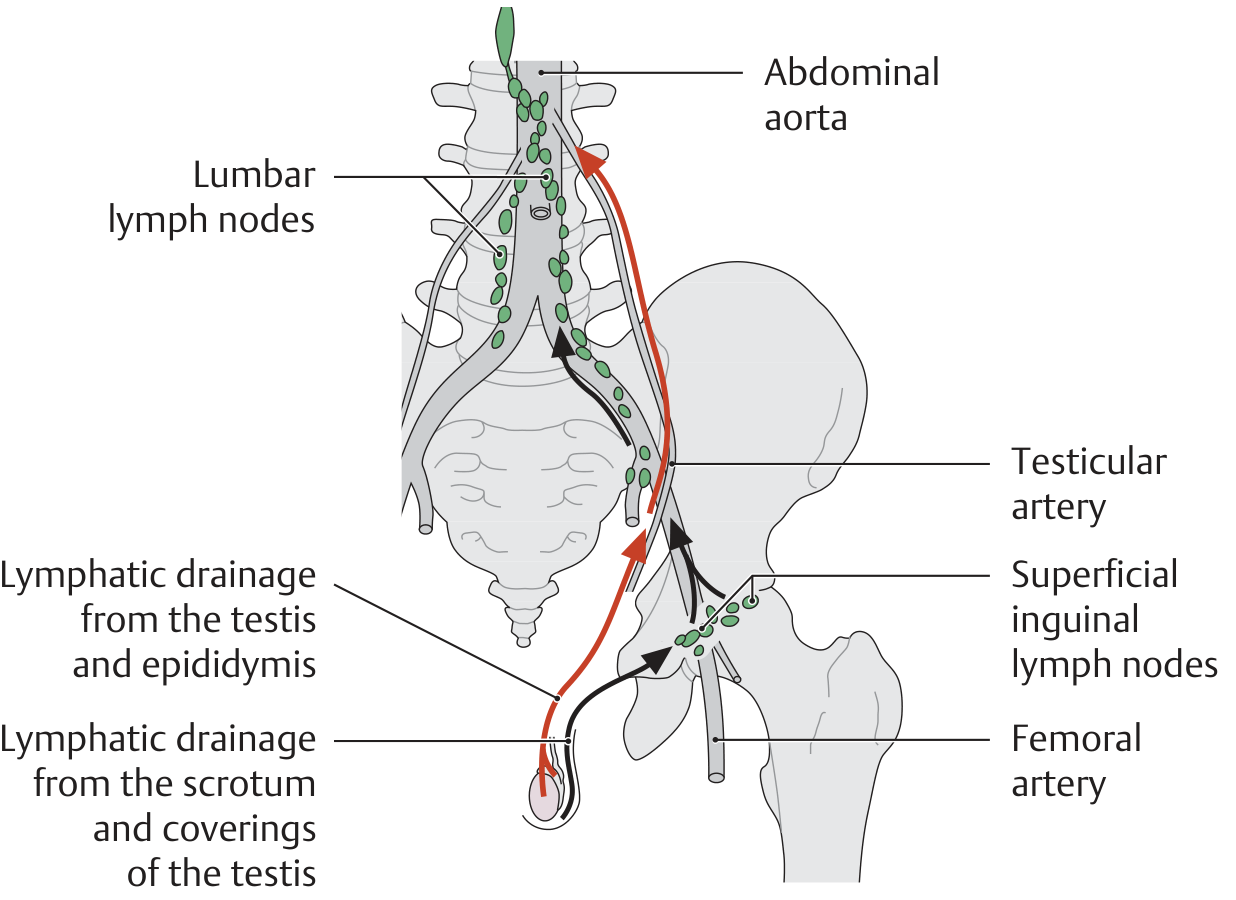
Arterial supply and lymphatic drainage of the testis, showing connections to the abdominal aorta and inguinal lymph nodes.
Fig. - Dorsal Penile Vessels and Nerves
Section: Dorsal vessels and nerves of the penis
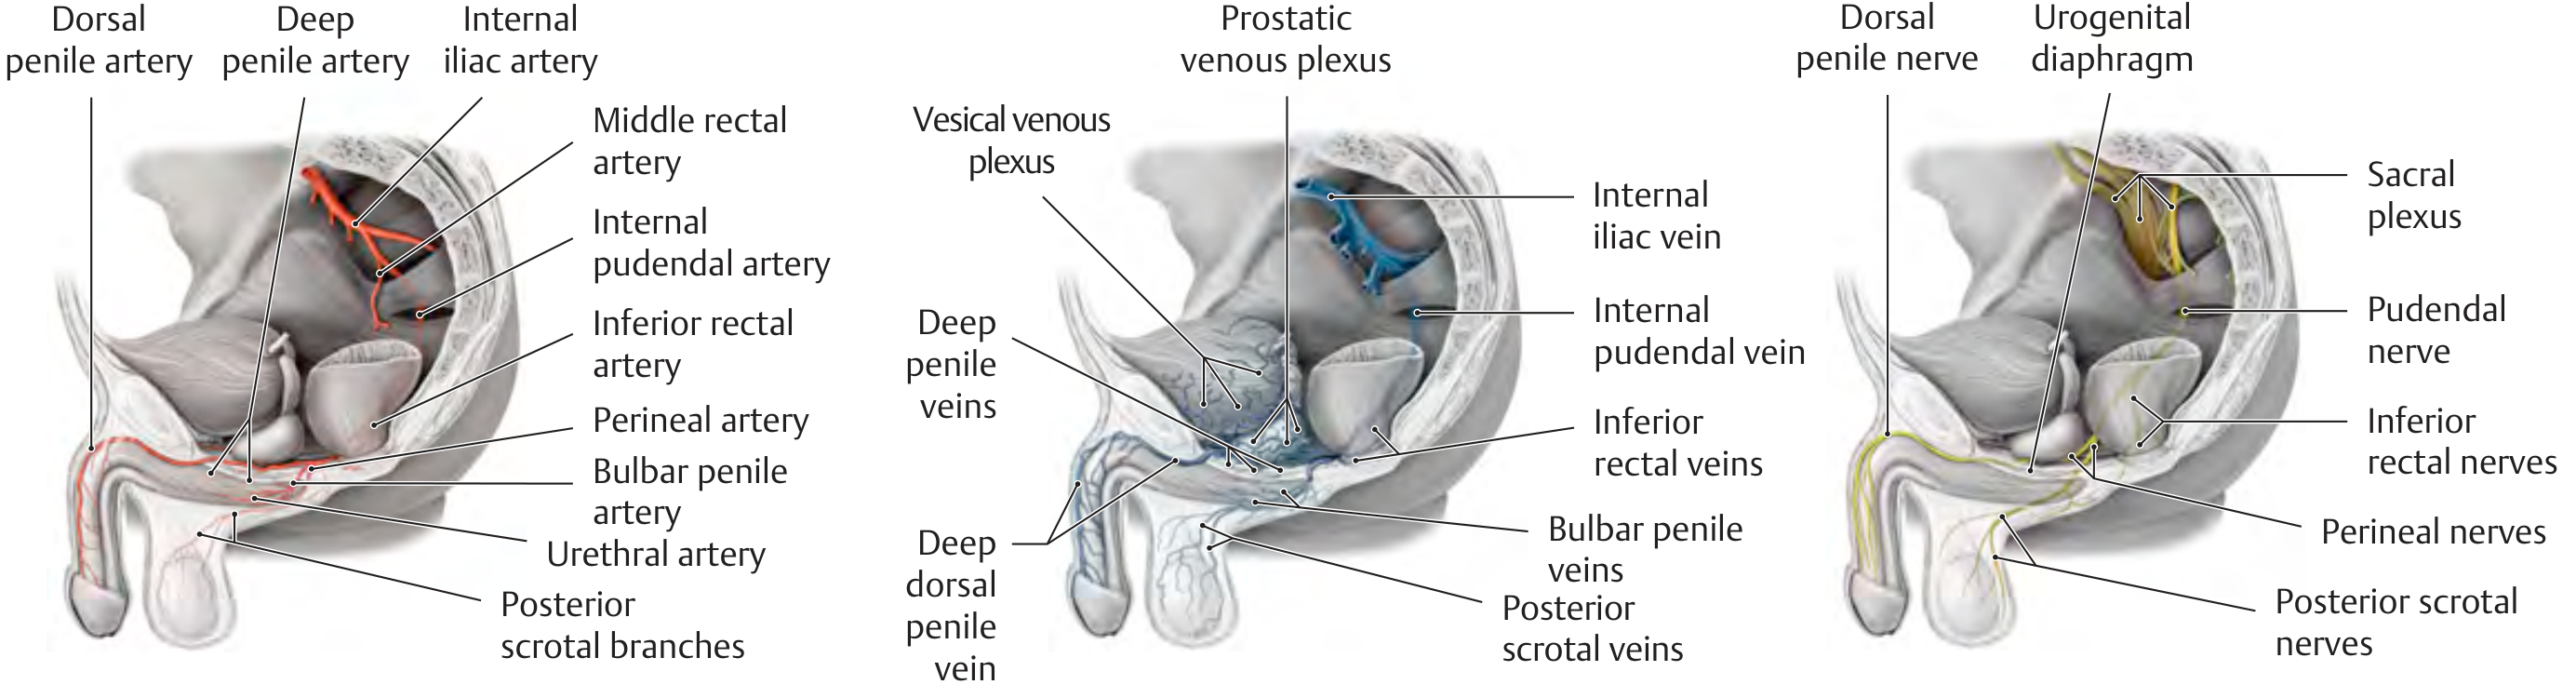
Dorsal penile artery branches and accompanying nerves on the penis shaft.
Fig. - Posterior Tibial Artery Interosseous Branches
Section: Branches of the posterior tibial artery

Interosseous membrane branches and distal anastomoses of the posterior tibial artery in the leg.
Quick Reference Summary
| # | Diagram | Topic | Source |
|---|---|---|---|
| 1 | Positive staircase & postextrasystolic potentiation | Heart rate vs. contractility | Costanzo |
| 2 | Cardiac glycoside mechanism | Na/K-ATPase inhibition, Ca2+ rise | Costanzo |
| 3 | LV pressure-volume curves (systole/diastole) | Length-tension relationship | Costanzo |
| 4 | Ventricular pressure-volume loop | Full cardiac cycle | Costanzo |
| 5 | Cardiac function (Frank-Starling) curve | CO vs. RAP | Costanzo |
| 6 | Cardiac output + vascular function curves | Equilibrium point | Costanzo |
| 7 | Normal ECG waveform (P, QRS, T) | Electrical cardiac cycle | Costanzo |
| 8 | Cardiovascular circuitry overview | Pulmonary + systemic circuits | Costanzo |
| 9 | Pressures across the circulation | Normal mmHg values | Costanzo |
| 10 | Cardiac action potentials (ventricular vs. pacemaker) | Ionic mechanisms | Costanzo |
| 11 | Brain stem cardiovascular centers | Autonomic control | Costanzo |
| 12 | Cardiac muscle morphology (intercalated discs) | Myocyte ultrastructure | Medical Physiology |
| 13 | Embryonic circulation development | Embryology | THIEME Atlas |
| 14 | Lower limb arterial supply (aorta to foot) | Regional anatomy | THIEME Atlas |
| 15 | Popliteal/genicular/tibial arteries | Knee/leg vessels | THIEME Atlas |
| 16 | Testicular arterial & lymphatic supply | Regional anatomy | THIEME Atlas |
| 17 | Dorsal penile vessels & nerves | Regional anatomy | THIEME Atlas |
| 18 | Posterior tibial artery branches | Leg vessels | THIEME Atlas |
Sources: Costanzo Physiology 7th Edition | Medical Physiology (Boron & Boulpaep) | General Anatomy and Musculoskeletal System - THIEME Atlas of Anatomy
This is a shared conversation. Sign in to Orris to start your own chat.