

Solve it with proper easy diagrams
thyroid hormone synthesis iodination thyroglobulin diagram
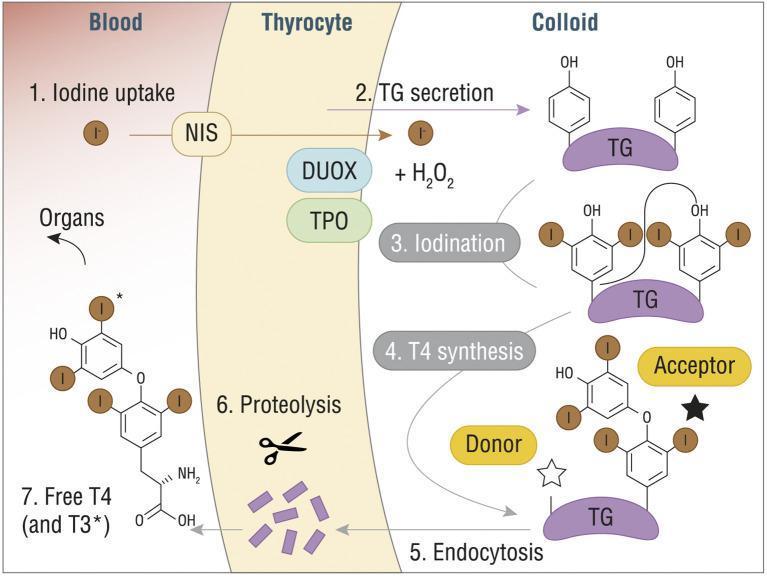
A pathophysiology diagram illustrating the seven-step process of thyroid hormone synthesis (T3 and T4) across three compartments: Blood, Thyrocyte, and Colloid. (1) Iodine uptake: Iodide (I-) enters the thyrocyte from the blood via the Sodium/Iodide Symporter (NIS). (2) TG secretion: Thyroglobulin (TG) is secreted into the colloid. (3) Iodination: Within the colloid, iodide is oxidized by Thyroid Peroxidase (TPO), dual oxidase (DUOX), and H2O2, leading to the attachment of iodine to tyrosine residues on TG. (4) T4 synthesis: A coupling reaction occurs between 'Donor' and 'Acceptor' iodinated tyrosine residues on the TG scaffold. (5) Endocytosis: The modified TG molecule is re-absorbed into the thyrocyte. (6) Proteolysis: Lysosomal enzymes break down TG, releasing individual hormones. (7) Release: Free T4 (thyroxine) and T3 (triiodothyronine) are secreted into the blood for systemic distribution to organs. The diagram includes detailed chemical structures of the phenolic rings and iodine substitutions characteristic of thyroid hormones.
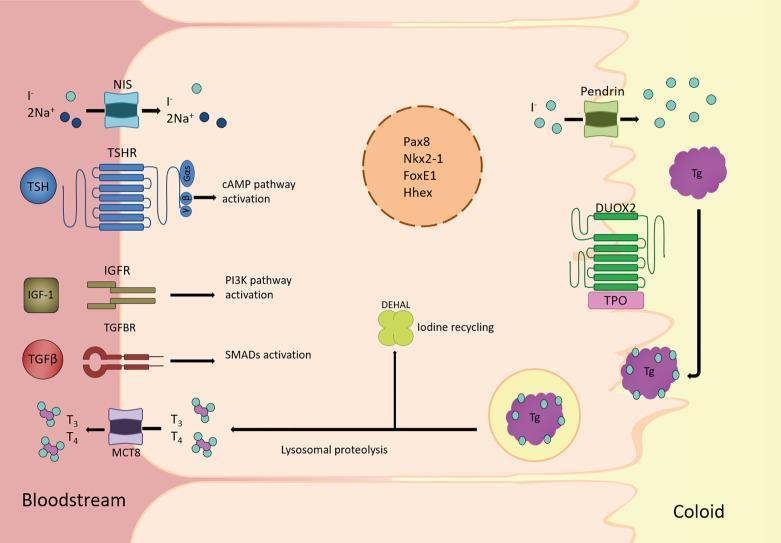
This medical schematic illustrates the pathophysiology and cellular mechanisms of a thyroid follicular cell, detailing the synthesis and secretion of thyroid hormones. The diagram is divided into three compartments: the bloodstream (basolateral side), the follicular cell cytoplasm, and the colloid lumen (apical side). Key transport proteins at the basolateral membrane include the Sodium-Iodide Symporter (NIS), which co-transports I- and Na+, and the Monocarboxylate Transporter 8 (MCT8), which facilitates the secretion of T3 and T4 into the blood. Signaling receptors TSHR, IGFR, and TGFBR are shown triggering cAMP, PI3K, and SMAD pathways respectively. At the apical membrane, Pendrin transports iodide into the colloid, where DUOX2 and Thyroid Peroxidase (TPO) facilitate the iodination of Thyroglobulin (Tg). The diagram further depicts the endocytosis of Tg, followed by lysosomal proteolysis to release T3 and T4. The enzyme DEHAL is shown recycling iodine from MIT and DIT. Centrally, the nucleus contains transcription factors Pax8, Nkx2-1, FoxE1, and Hhex, which regulate gene expression for thyroid differentiation.
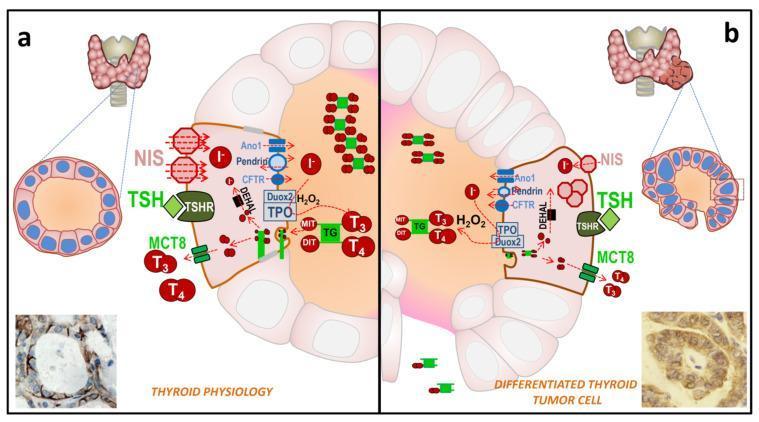
This comparative medical illustration depicts thyroid hormone (TH) biosynthesis in a normal follicle (Panel A) versus a differentiated thyroid cancer (DTC) cell (Panel B). Panel A illustrates normal physiology: a well-organized follicular structure with follicular epithelial cells surrounding a central colloid. Key proteins shown include the sodium/iodide symporter (NIS) localized strictly at the basolateral membrane, the TSH receptor (TSHR), and apical transporters like pendrin and Ano1. Iodide (I-) organification via thyroperoxidase (TPO) and Duox2-generated H2O2 is shown creating iodinated thyroglobulin (TG-I), leading to T3 and T4 synthesis. Panel B represents the pathophysiology of DTC, highlighting structural irregularities in the follicle and cellular alterations. Pathological changes include the delocalization of NIS from the basolateral membrane into the cytoplasm and a reduction in the expression of functional proteins like pendrin and TSHR. While H2O2 production persists, the synthesis and storage of TG-I and TH (T3/T4) in the colloid are visibly diminished. Bottom insets provide immunohistochemistry (IHC) correlations, confirming linear basolateral NIS expression in normal tissue versus diffuse, cytoplasmic NIS staining in tumor tissue.
basal ganglia direct indirect pathway circuit diagram
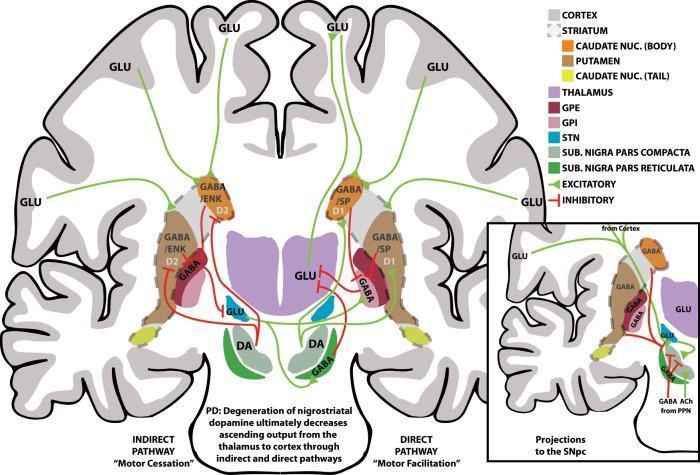
A pathophysiology diagram providing a schematic overview of the human basal ganglia motor circuits, specifically illustrating the indirect (left) and direct (right) pathways. The main illustration uses a coronal brain section to map anatomical structures: the cortex, striatum (caudate nucleus and putamen), thalamus, globus pallidus external (GPe) and internal (GPi) segments, subthalamic nucleus (STN), and substantia nigra (pars compacta, SNpc; pars reticulata, SNpr). Neurotransmission is color-coded: green arrows denote excitatory glutamatergic (GLU) or dopaminergic (DA) signals, while red T-bars signify inhibitory GABAergic (GABA/SP, GABA/ENK) signals. The direct pathway is labeled 'Motor Facilitation' and shows inhibitory projections from D1-receptor striatal neurons directly to the GPi/SNpr. The indirect pathway is labeled 'Motor Cessation' and highlights connections from D2-receptor striatal neurons to the GPe, subsequently influencing the STN and GPi/SNpr. An inset details projections to the SNpc, including inputs from the cortex, STN, and pedunculopontine nucleus (PPN). This educational material demonstrates the neuroanatomical basis for motor control and the circuit dysfunction relevant to Parkinson's disease (PD).
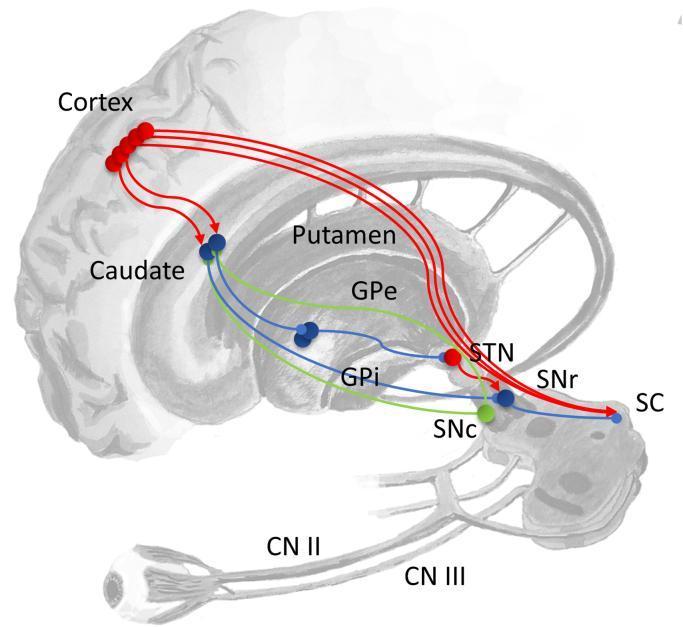
This medical diagram illustrates the basal ganglia circuitry and its contributions to eye movement control. The schematic highlights the functional pathways originating in the Cortex and projecting to the Striatum (Caudate and Putamen). The 'direct pathway' is depicted as an inhibitory connection from the striatum to the Substantia Nigra pars reticulata (SNr) or Globus Pallidus internus (GPi). The 'indirect pathway' involves sequential projections from the striatum to the Globus Pallidus externus (GPe), the Subthalamic Nucleus (STN), and then to the SNr or GPi. The SNr serves as a critical convergence point, sending inhibitory signals to the Superior Colliculus (SC) in the midbrain to regulate saccades. The Substantia Nigra pars compacta (SNc) is shown providing dopaminergic modulation to the striatum. Below the brainstem, the diagram integrates peripheral visual components, including the eye, Optic Nerve (CN II) projecting to the SC, and Oculomotor Nerve (CN III). A color-coded legend indicates functional dynamics: red for excitatory, blue for inhibitory, and green for modulatory connections.
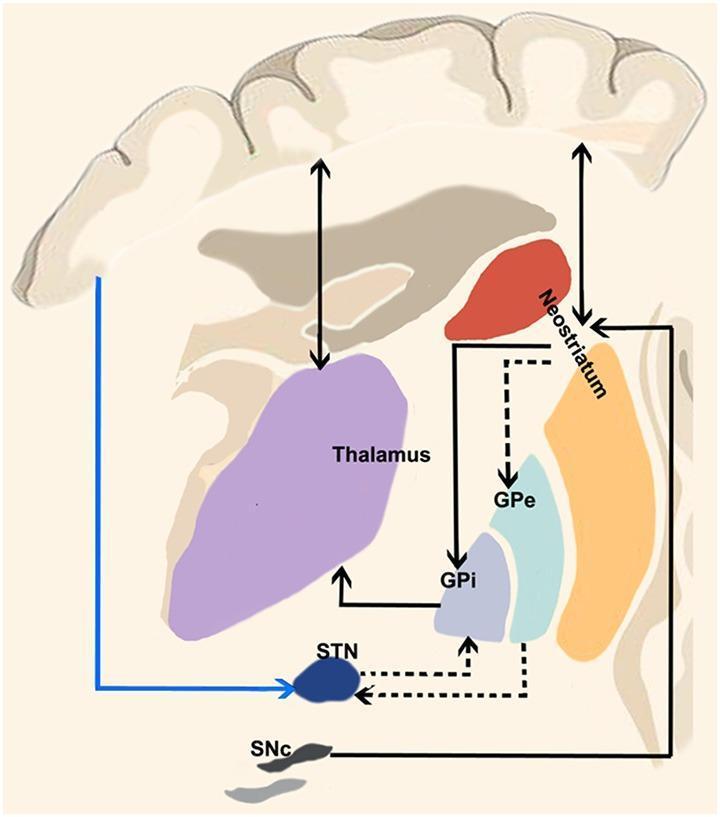
This medical schematic diagram illustrates the functional neuroanatomy of the human basal ganglia circuitry, detailing the classic motor loops. The diagram displays key anatomical structures including the cerebral cortex, thalamus (violet), neostriatum (red/orange), globus pallidus externa (GPe, light blue), globus pallidus interna (GPi, bluish-gray), subthalamic nucleus (STN, dark blue), and substantia nigra pars compacta (SNc, dark gray). Three primary functional pathways are highlighted: the Direct Pathway (solid black lines from neostriatum to GPi), which facilitates movement via disinhibition of the thalamus; the Indirect Pathway (dashed black lines connecting neostriatum to GPe, then STN, and finally GPi), which serves to inhibit motor activity; and the Hyperdirect Pathway (solid blue line from cortex directly to STN), which provides rapid inhibition of motor output by bypassing the striatum. Arrows indicate the direction of signal flow between these nuclei and the thalamocortical circuit, providing a visual model for understanding movement disorders like Parkinson's and Huntington's disease where these pathways are imbalanced.
spermatogenesis stages diagram seminiferous tubule
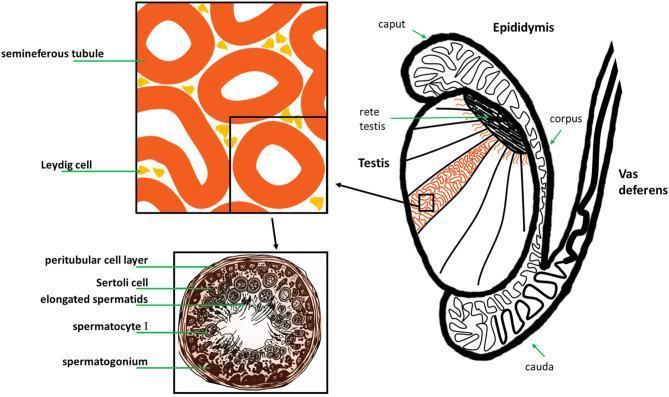
This medical illustration depicts the gross anatomy and histology of the human male reproductive system, specifically the testis and its associated ducts. The main diagram shows a sagittal-like section of the testis, highlighting internal lobules containing seminiferous tubules that converge at the rete testis. The epididymis is shown as a coiled ductal system attached to the posterior testis, divided into the caput (head), corpus (body), and cauda (tail), which then continues as the vas deferens. A magnified histological inset focuses on the interstitial space, showing Leydig cells clustered between cross-sections of seminiferous tubules. A second, high-magnification cross-section of a single seminiferous tubule illustrates the stages of spermatogenesis. Labeled structures include the peritubular cell layer (basal lamina), Sertoli cells for structural support, and germ cells in various stages of maturation: spermatogonia at the periphery, followed by spermatocytes I, and elongated spermatids positioned near the central lumen. This diagram serves as an educational tool for understanding the relationship between macroscopic anatomy and microscopic gametogenesis.
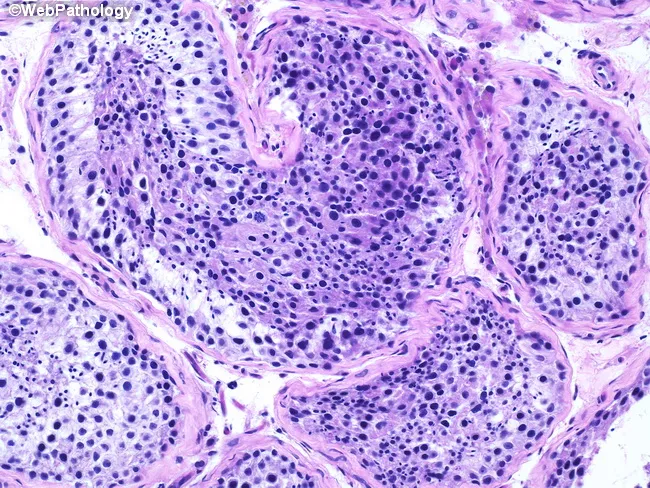
This histopathology image depicts a testicular biopsy prepared for light microscopy. Using Hematoxylin and Eosin (H&E) staining, the tissue reveals multiple cross-sections of seminiferous tubules with preserved architecture and active germ cell maturation. The tubules show intact basal membranes and orderly germinal epithelium containing all stages of spermatogenesis. Within several tubules, spermatogonia lie adjacent to the basement membrane, followed by primary spermatocytes in prophase I, round and elongated spermatids, and mature spermatozoa occupying tubule lumina in places, consistent with complete spermatogenic effort. Sertoli cells provide supportive scaffolding, appearing columnar with prominent nuclei. Interstitium between tubules contains connective tissue and rare Leydig cells without overt inflammation or fibrosis. Overall, there is no evidence of tubular sclerosis, hyalinization, maturation arrest, or neoplastic processes. The image emphasizes normal histology with germ cells at multiple maturation stages and intact tubule integrity. Clinically, such a biopsy supports normal spermatogenic function and fertility potential, assuming no systemic hormonal disturbances. The finding argues against major gonadal causes of infertility such as Sertoli cell-only syndrome or spermatogenic failure. In practice, results correlate with normal semen parameters and typical serum testosterone, FSH, and LH profiles, guiding management toward non-testicular etiologies if infertility persists. This description highlights the diagnostic significance of preserved spermatogenesis in evaluating male fertility and testicular pathology.
female reproductive cycle hormonal regulation FSH LH estrogen progesterone
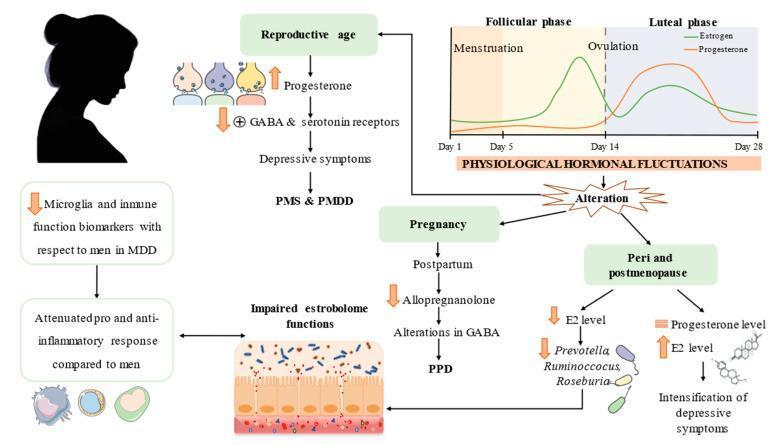
This pathophysiology diagram illustrates hallmarks of major depressive disorder (MDD) across various stages of the female reproductive lifespan, including reproductive age, pregnancy, and peri- and postmenopause. A line graph labeled 'Physiological Hormonal Fluctuations' depicts the 28-day menstrual cycle, showing estrogen peaks prior to ovulation (Day 14) and progesterone dominance during the luteal phase. A signaling pathway shows how progesterone fluctuations lead to GABA and serotonin receptor modulation, contributing to premenstrual syndrome (PMS) and premenstrual dysphoric disorder (PMDD). In the pregnancy/postpartum pathway, reduced allopregnanolone levels and GABA alterations are linked to postpartum depression (PPD). The peri- and postmenopausal section illustrates declining estradiol (E2) and progesterone, linked to the intensification of depressive symptoms. The diagram also highlights secondary factors, including impaired estrobolome function (gut-microbiome-estrogen axis) involving bacteria like Prevotella and Ruminococcus, and an immune component characterized by attenuated microglia and inflammatory responses compared to men. This visualization integrates endocrinology, neurobiology, and immunology to explain sex-specific vulnerabilities in mood disorders.
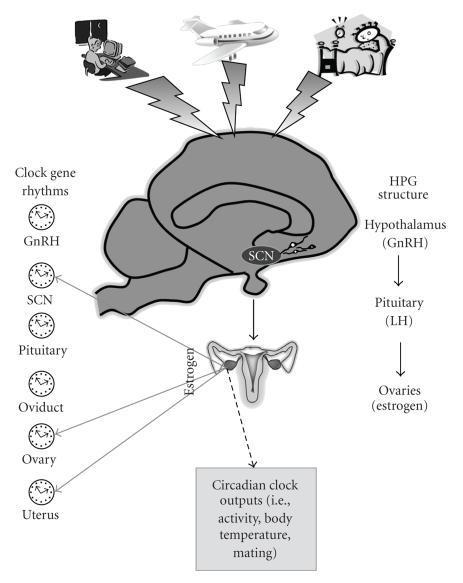
This pathophysiology diagram illustrates the integration of the hypothalamus-pituitary-gonadal (HPG) axis with circadian rhythm regulation in the female reproductive system. A sagittal section of the brain highlights the suprachiasmatic nucleus (SCN) and its relationship with GnRH neurons in the hypothalamus. The diagram outlines the hormonal cascade: Hypothalamus (GnRH) stimulates the Pituitary (LH), which acts on the Ovaries to produce Estrogen. External circadian disruptors—shift work, jet lag, and sleep deprivation—are shown influencing the SCN via lightning bolt symbols. Educational icons represent 'Clock gene rhythms' present in the GnRH neurons, SCN, Pituitary, Oviduct, Ovary, and Uterus, emphasizing peripheral molecular clocks. Solid arrows denote estrogen's feedback effects on reproductive tissues and the brain, while a dashed arrow indicates influence over circadian outputs like body temperature and activity levels. This visual serves as a summary of how environmental factors and internal clocks synchronize reproductive endocrinology.
referred pain dermatome mechanism convergence projection
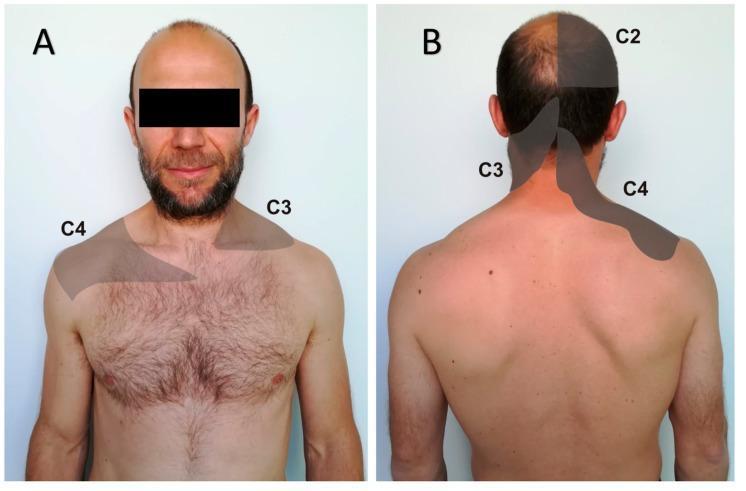
This clinical photograph consists of two panels illustrating the patterns of visceral referred pain mapped onto specific cervical dermatomes. Image A provides an anterior view of a male torso with shaded regions indicating referred pain in the C3 and C4 dermatome distributions. The C3 region is depicted over the right clavicular and lower neck area, while the C4 region is shown on the left shoulder and upper pectoral area. Image B provides a posterior view, highlighting the C2, C3, and C4 dermatomes. C2 is mapped over the right occipital region of the scalp; C3 is shown along the left posterior neck; and C4 is mapped across the right supraclavicular and superior scapular region. This anatomical illustration is used for clinical education regarding the recognition of referred pain originating from internal organs, such as the diaphragm, liver, or heart, which can manifest as somatic discomfort in the neck and upper quadrant. The content is suitable for medical education in fields such as neurology, physical therapy, and internal medicine to assist in the differential diagnosis of visceral versus somatic pain sources.
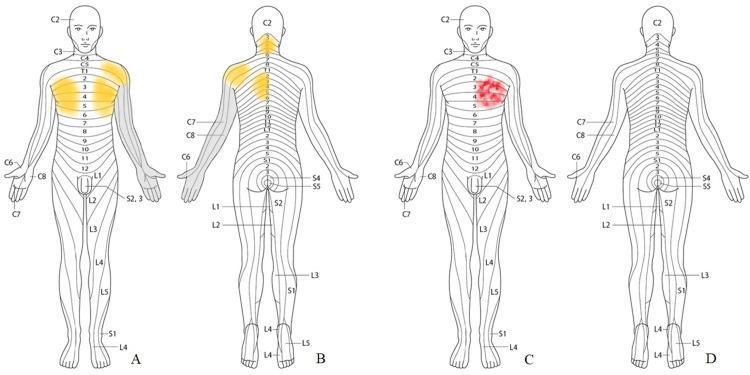
A series of four schematic anatomical diagrams (A-D) illustrating dermatomal distributions of pain and numbness on human figures. Panels A (anterior) and B (posterior) show preoperative cervical radiculopathy symptoms, with yellow shading indicating persistent pain in the neck (C2-C3), bilateral upper chest (C4-T4), left shoulder, and left subscapular area. Gray shading on the left upper extremity represents numbness involving the arm and all digits (C6-C8 distribution). Panels C (anterior) and D (posterior) illustrate postoperative symptoms following cervical surgery. A red shaded area on the left anterior chest (spanning approximately C3-T4 dermatomes) represents the location of angina pectoris pain. The diagrams use standard dermatome labeling (C2-S5) to map clinical sensory manifestations. This medical illustration is used to differentiate between cervical referred pain and cardiac-origin chest pain in a clinical context, highlighting the importance of sensory mapping in differential diagnosis.
cerebellum functions anatomy diagram
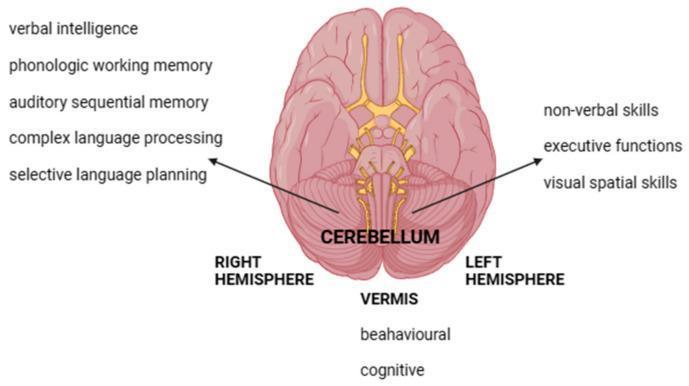
This medical anatomical diagram illustrates the functional neuroanatomy of the human cerebellum from an inferior view. The diagram highlights the division of the cerebellum into the Right Hemisphere, Left Hemisphere, and the midline Vermis. It serves as an educational infographic detailing the lateralization of cerebellar functions. The Right Hemisphere is annotated with language-related and verbal tasks, including verbal intelligence, phonologic working memory, auditory sequential memory, complex language processing, and selective language planning. Conversely, the Left Hemisphere is associated with non-verbal skills, executive functions, and visual spatial skills. The midline Vermis is linked to behavioral and cognitive regulation. The visual includes a simplified representation of the brain's ventral surface, including the brainstem and cranial nerve origins, emphasizing the cerebellum's role in the Cerebellar Cognitive Affective Syndrome (CCAS). This material is designed for neurology and neuropsychology education, illustrating the functional consequences of localized cerebellar lesions.
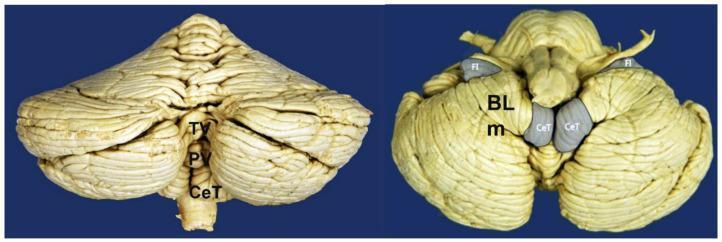
This medical anatomical diagram features two clinical photographs of a gross human cerebellum and brainstem specimen, highlighting key surface anatomy. The left image provides a posterior view, emphasizing the midline vermis and cerebellar hemispheres. Labeled structures include the tuber of vermis (TV) superiorly, the pyramid of vermis (PV) centrally, and the cerebellar tonsils (CeT) at the inferior margin. The right image presents an inferior view, showcasing the ventral aspects and the relationship to the brainstem. Key labels include the flocculus (Fl) positioned laterally, the medial part of the biventral lobe (BLm), and the cerebellar tonsils (CeT) adjacent to the midline. The visual illustrates the striated folia and lobular organization critical for understanding neuroanatomical relationships, particularly in the context of Chiari malformations and tonsillar herniation. This material is designed for intermediate to advanced medical education in neuroanatomy and neurology.
light adaptation dark adaptation rhodopsin retina photoreceptor
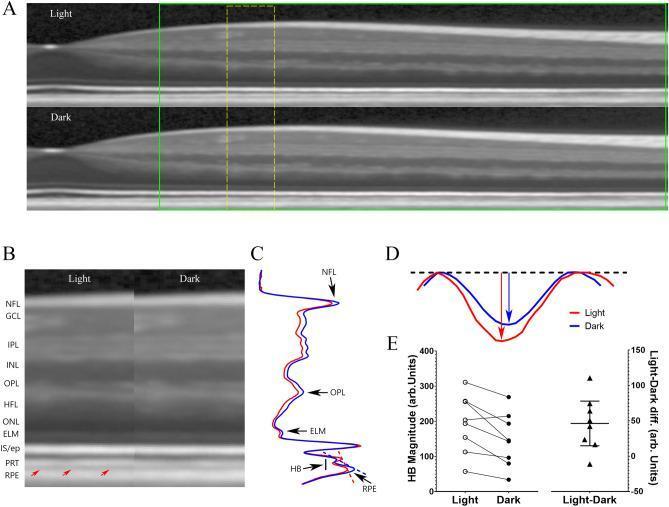
This composite educational graphic illustrates the functional assessment of the human outer retina using Optical Coherence Tomography (OCT) under light and dark adaptation conditions. (A) B-scans of a human eye flattened along the Retinal Pigment Epithelium (RPE) demonstrate structural layering. (B) Magnified side-by-side comparison reveals a hyperreflective band (HB) between the photoreceptor tip layer (PRT) and the RPE, prominently marked by red arrows in the light-adapted state. (C) Transretinal intensity profiles map layers including the Nerve Fiber Layer (NFL), Outer Plexiform Layer (OPL), and External Limiting Membrane (ELM), with the HB region quantified against a dashed baseline connecting PRT and RPE peaks. (D) A magnified intensity plot highlights the higher HB magnitude in light (red line) versus dark (blue line). (E) Quantitative data from eight subjects show a consistent significant reduction in HB magnitude during dark adaptation. This content demonstrates how OCT biomarkers can be used to evaluate physiological and metabolic changes at the rod-RPE interface, providing insights into mitochondrial function in the outer retina.
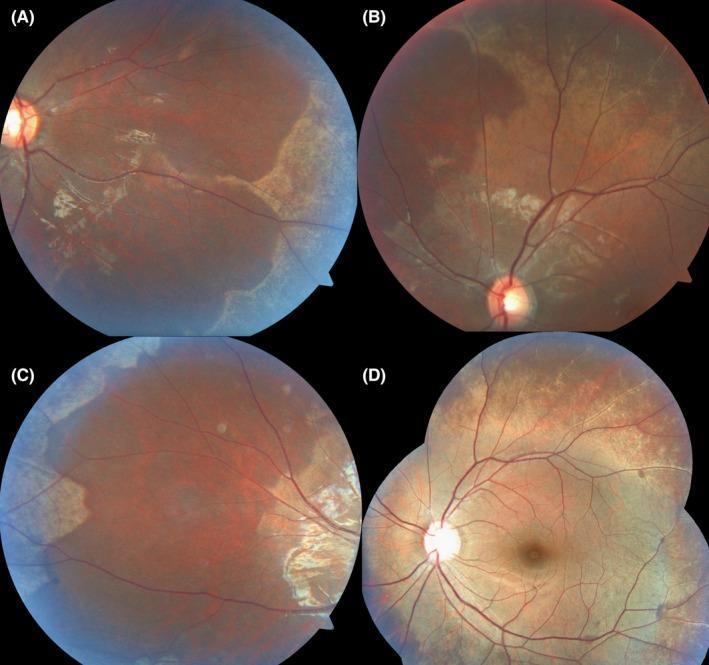
This set of four clinical fundus photographs (A-D) demonstrates the classic Mizuo-Nakamura phenomenon associated with Oguchi disease, a rare form of congenital stationary night blindness. Panels A, B, and C show the light-adapted state of the mid-peripheral retina, characterized by a peculiar, patchy, grayish-white or golden-yellow metallic sheen and discoloration located predominantly outside the retinal vascular arcades. Panel D illustrates the same fundus under increased light exposure or a camera flash, where the golden-yellow reflective sheen becomes more accentuated and widespread. This diagnostic visual finding typically disappears or returns to a normal reddish-brown fundus appearance after several hours of dark adaptation. The images emphasize the dynamic pigmentary changes of the retinal pigment epithelium and photoreceptor layer in response to light, providing a key clinical marker for hereditary retinal dysfunction. The optic disc, macula, and retinal vasculature appear otherwise normal, highlighting the functional rather than structural nature of this specific dystrophy.
PHYSIOLOGY PAPER II - SENDUP EXAMINATION, AUG 2025
SECTION - A
Q1. Thyroid Hormone Biosynthesis, Storage, Release, Regulation, Functions & Wolff-Chaikoff Effect (10 Marks)
A) BIOSYNTHESIS OF THYROID HORMONES (4 Marks)
BLOOD                THYROCYTE              COLLOID
  |                      |                     |
  I-  ---[NIS]-------->  I-                    |
         (Na/I symporter) |                    |
                      [Pendrin] ----------->   I-
                          |                    |
  Thyroglobulin (TG) ---[Exocytosis]-------->  TG
  (synthesized in ER)     |                    |
                          |        [TPO + H2O2]|
                          |        Iodination  |
                          |                    v
                          |           TG + I- --> MIT --> DIT
                          |                    |
                          |           MIT + DIT = T3
                          |           DIT + DIT = T4
                          |                    |
                    [Endocytosis] <---------- TG-T3/T4
                          |
                    [Lysosomal proteolysis]
                          |
                    T3 + T4 released
                          |
                    [MCT8 transporter]
                          |
                         BLOOD
- Iodide uptake - I- enters thyrocyte via Na/I Symporter (NIS) at basolateral membrane (active transport, energy-dependent)
- Iodide transport to colloid - via Pendrin at apical membrane
- Thyroglobulin (TG) synthesis - glycoprotein made in RER, secreted into colloid by exocytosis; contains 123 tyrosine residues (only 4-8 used for hormone synthesis)
- Organification (Iodination) - Thyroid Peroxidase (TPO) + H2O2 oxidizes I- to I2, then attaches iodine to tyrosine residues on TG:
- Tyrosine + 1 iodine = Monoiodotyrosine (MIT)
- Tyrosine + 2 iodines = Diiodotyrosine (DIT)
- Coupling reaction (also by TPO):
- MIT + DIT = T3 (Triiodothyronine)
- DIT + DIT = T4 (Thyroxine/Tetraiodothyronine)
- Storage - T3 and T4 remain attached to TG in colloid (reservoir for 2-3 months supply)
- Release - TSH stimulates endocytosis of TG, lysosomal proteolysis releases free T3 and T4 into blood
B) REGULATION OF THYROID HORMONES (2 Marks)
          HYPOTHALAMUS
               |
           [TRH] (Thyrotropin Releasing Hormone)
               |  (stimulates via +)
               v
           PITUITARY (Anterior)
               |
           [TSH] (Thyroid Stimulating Hormone)
               |  (stimulates via +)
               v
            THYROID
               |
           [T3 + T4]
               |
    Negative Feedback loops:
    T3/T4 ---(-)--> Pituitary (main)
    T3/T4 ---(-)--> Hypothalamus
- TRH (tripeptide from hypothalamus): stimulates TSH release
- TSH acts via cAMP on thyroid follicular cells - stimulates all steps of synthesis and release
- Negative feedback: High T3/T4 inhibits both TRH and TSH (mainly at pituitary level)
- Other factors stimulating TSH: Cold exposure, stress, low blood T3/T4
- Factors inhibiting TSH: High cortisol, dopamine, somatostatin, high iodide (Wolff-Chaikoff)
C) FUNCTIONS OF THYROID HORMONES (3 Marks)
| System | Function |
|---|---|
| Metabolism | Increases BMR; stimulates O2 consumption in all tissues except brain, spleen, testes |
| Carbohydrates | Increases glycogenolysis, gluconeogenesis, intestinal glucose absorption |
| Proteins | Physiologic amounts = anabolic; excess = catabolic (increased protein catabolism) |
| Fats | Increases lipolysis and oxidation of fatty acids; reduces cholesterol (by upregulating LDL receptors) |
| CVS | Increases HR, cardiac output, and cardiac contractility; decreases peripheral resistance |
| Growth | Essential for normal growth and bone maturation; works synergistically with GH |
| Development | Critical for CNS development in fetus and neonate; deficiency causes cretinism |
| Thermoregulation | Calorigenic effect - increases heat production |
| Nervous system | Increases alertness, reflexes, and sensitivity to catecholamines |
| Reproduction | Necessary for normal gonadal function |
D) WOLFF-CHAIKOFF EFFECT (1 Mark)
High plasma I-  -->  High intra-thyroidal I-
                             |
                    Inhibits TPO (organification)
                             |
                    [Inhibition of T3/T4 synthesis]
                             |
                    "Escape" after 10-14 days
                    (NIS is down-regulated, reducing I- uptake)
- Lugol's iodine given pre-operatively in thyrotoxicosis
- Treatment of thyroid storm
- Basis of using iodinated contrast media effects
Q2. Short Notes (6 Marks each)
a) SPERMATOGENESIS
SPERMATOGONIUM (2n = 46)
    |
[PHASE 1: Mitotic proliferation]
    |
    |-- Type A spermatogonia (self-renewal)
    |-- Type B spermatogonia (differentiation)
          |
          v
    PRIMARY SPERMATOCYTE (2n = 46)
          |
[PHASE 2: Meiosis]
          |
    Meiosis I (reductional)
          |
    SECONDARY SPERMATOCYTES (n = 23, 2 cells)
          |
    Meiosis II (equational)
          |
    SPERMATIDS (n = 23, 4 cells) - round, immature
          |
[PHASE 3: Spermiogenesis]
    (No more division - shape transformation only)
          |
    Acrosome formation (from Golgi)
    Nuclear condensation
    Flagellum development (from centriole)
    Loss of excess cytoplasm
          |
    MATURE SPERMATOZOON (n = 23)
- Head: Nucleus (haploid DNA) + Acrosome (contains hydrolytic enzymes for fertilization)
- Middle piece: Rich in mitochondria (energy for motility)
- Tail (flagellum): Provides motility via axoneme (9+2 microtubule arrangement)
- FSH: Acts on Sertoli cells → stimulates spermatogenesis, ABP (Androgen Binding Protein) production
- LH: Acts on Leydig cells → stimulates testosterone production
- Testosterone: Required for spermatogenesis at high local concentration
- Inhibin (from Sertoli cells): Negative feedback on FSH
b) PHYSIOLOGICAL ACTIONS OF INSULIN
                        INSULIN
                           |
        ___________________|___________________
        |                  |                  |
    LIVER              MUSCLE              ADIPOSE TISSUE
        |                  |                  |
 ↑ Glycogenesis    ↑ Glucose uptake    ↑ Glucose uptake
 ↓ Glycogenolysis    (GLUT-4)           (GLUT-4)
 ↓ Gluconeogenesis  ↑ Glycogenesis    ↑ Lipogenesis
 ↑ Lipogenesis      ↑ Protein synthesis ↓ Lipolysis
 ↑ Protein synthesis ↓ Proteolysis    ↓ HSL activity
 ↓ Ketogenesis      ↑ K+ uptake
| System | Action |
|---|---|
| Carbohydrate metabolism | ↑ Glucose uptake (GLUT-4 in muscle & fat), ↑ glycolysis, ↑ glycogenesis, ↓ gluconeogenesis, ↓ glycogenolysis |
| Fat metabolism | ↑ Lipogenesis (de novo), ↓ lipolysis (inhibits Hormone Sensitive Lipase), ↓ ketogenesis |
| Protein metabolism | ↑ Amino acid uptake, ↑ protein synthesis, ↓ proteolysis - overall anabolic |
| Electrolytes | ↑ K+ uptake into cells (important for treating diabetic ketoacidosis-related hyperkalemia) |
| Growth | Acts as a growth factor; stimulates cell growth and differentiation |
| CVS | Vasodilatory (via NO production in endothelium) |
c) ADDISON'S DISEASE
- Autoimmune (most common, 80%) - anti-21-hydroxylase antibodies
- Tuberculosis
- Metastatic carcinoma
- Bilateral adrenalectomy
ADRENAL CORTEX
    |
    |-- Zona Glomerulosa --> [Aldosterone deficiency]
    |                           (salt-wasting)
    |
    |-- Zona Fasciculata --> [Cortisol deficiency]
    |                           (hypoglycemia, weakness)
    |
    |-- Zona Reticularis --> [Adrenal androgens deficiency]
                                (in females: loss of pubic/axillary hair)
| Deficiency | Clinical Feature |
|---|---|
| Aldosterone deficiency | Na+ loss (hyponatremia), K+ retention (hyperkalemia), hypotension, dehydration |
| Cortisol deficiency | Hypoglycemia, weakness, fatigue, nausea, vomiting, weight loss |
| ↑ ACTH (due to loss of negative feedback) | Hyperpigmentation (ACTH has MSH-like activity) - in skin creases, buccal mucosa, pressure points |
| Androgen deficiency | Loss of axillary and pubic hair in women |
- Low morning cortisol
- Low serum Na+, High K+
- Short Synacthen (ACTH stimulation) test - no cortisol rise (diagnostic)
- High ACTH levels
d) THERMOREGULATORY MECHANISMS DURING HEAT EXPOSURE
HEAT EXPOSURE
      |
   [Temperature receptors in skin and hypothalamus]
      |
   [Preoptic area of Hypothalamus - "Heat Loss Center"]
      |
      |__________________________|________________________
      |                          |                       |
  CUTANEOUS               SWEATING              BEHAVIORAL
  VASODILATION                 |               (removing clothes,
      |               Eccrine sweat glands      seeking shade)
  Skin blood flow      activated by cholinergic
  increases 7-8x       sympathetic fibers
  (from 0.2L to        Max rate: 1-2 L/hour
   2-3L/min)                |
  Heat loss by         Evaporation of sweat
  radiation +          (most important in humid
  conduction/          environments)
  convection
- Radiation (60%) - Infrared rays emitted from skin surface
- Evaporation (25%) - Sweating + insensible perspiration (most important when temperature > body temp)
- Convection - Air currents carry heat away
- Conduction - Direct transfer to cooler objects
- Panting (mainly in animals; humans only at extremes) - increases respiratory evaporation
- Reduced metabolic rate - decreased voluntary activity
- Acclimatization to heat (after 7-10 days): increased sweat volume, decreased NaCl in sweat (aldosterone-mediated), earlier onset of sweating, increased plasma volume
| Feature | Heat Exhaustion | Heat Stroke |
|---|---|---|
| Mechanism | Water/salt depletion | Failure of thermoregulation |
| Sweating | Present | Absent (anhidrosis) |
| Core temp | <40°C | >40°C |
| Consciousness | Alert | Confused/coma |
| Emergency? | Yes | Yes (life-threatening) |
e) HORMONAL REGULATION OF FEMALE REPRODUCTIVE CYCLE

DAY 1-5:    MENSTRUATION (shedding of functional endometrium)
DAY 1-13:   FOLLICULAR PHASE (OVARIAN) / PROLIFERATIVE PHASE (UTERINE)
DAY 14:     OVULATION
DAY 14-28:  LUTEAL PHASE (OVARIAN) / SECRETORY PHASE (UTERINE)
HYPOTHALAMUS
GnRH (pulsatile) --> PITUITARY
                         |
                    FSH + LH released
                         |
              ___________|___________
              |                     |
        [FOLLICULAR PHASE]     [LUTEAL PHASE]
              |                     |
    FSH: stimulates          LH surge (Day 13-14):
    follicle growth          - Triggers ovulation
    (Graafian follicle       - Luteinization of
    develops)                  ruptured follicle
              |                     |
    Rising ESTROGEN          CORPUS LUTEUM forms
    (from granulosa          - Secretes Progesterone
     cells)                    + Estrogen
              |                     |
    Positive feedback        Progesterone:
    at mid-cycle -->         - Maintains secretory
    LH SURGE (ovulation)       endometrium
                             - ↑ basal body temp
                             - ↓ GnRH pulse freq
                                   |
                           If no fertilization:
                           Corpus luteum regresses
                           (luteolysis) Day 24-26
                                   |
                           Fall in E2 + P4
                                   |
                           Endometrium sheds
                           --> MENSTRUATION
| Phase | Dominant Hormone | Ovarian Event | Uterine Event |
|---|---|---|---|
| Day 1-5 | Low E2 + P4 | Follicle recruitment | Menstruation |
| Day 6-13 | Estrogen (FSH-driven) | Follicular growth | Proliferation (thick endometrium) |
| Day 13-14 | LH surge (estrogen-driven) | Ovulation | - |
| Day 14-26 | Progesterone (dominant) | Corpus luteum | Secretory changes (glandular) |
| Day 26-28 | Both fall | Corpus luteum regression | Ischemia + shedding |
SECTION - B
Q1. Clinical Case: 60-year-old man with resting tremor, rigidity, bradykinesia
a) Most Probable Diagnosis (1 Mark)
- Resting tremor ("pill-rolling," 4-6 Hz, decreases with voluntary movement)
- Rigidity (cogwheel or lead-pipe rigidity)
- Bradykinesia (slowness of movement, difficulty initiating movement)
b) Nuclei of Basal Ganglia (2 Marks)
BASAL GANGLIA COMPONENTS:
         ____________
        |   STRIATUM  |
        |  __________|
        | | Caudate   |  } Input nuclei
        | | Nucleus   |  (receive cortical input)
        | |___________|
        | | Putamen   |
        |_|___________|
        |   PALLIDUM  |
        |  ___________|
        | | Globus    |
        | | Pallidus  |
        | | Externa   |  } Output/relay nuclei
        | | (GPe)     |
        | |___________|
        | | Globus    |
        | | Pallidus  |
        | | Interna   |  Output nucleus
        | | (GPi)     |
        |_|___________|
            +
    SUBTHALAMIC NUCLEUS (STN)
            +
    SUBSTANTIA NIGRA
    |- pars compacta (SNpc) - dopamine neurons
    |- pars reticulata (SNpr) - output nucleus
- Caudate
- Putamen (caudate + putamen = Neostriatum/Striatum)
- Globus Pallidus (external + internal)
- Subthalamic Nucleus
- Substantia Nigra
c) Direct and Indirect Circuits of Basal Ganglia (4 Marks)
CORTEX (+Glu)
    |
STRIATUM (D1 receptors)
    |
    | (-GABA)
    v
GPi/SNpr [INHIBITED]
    |
    | Less (-GABA output)
    v
THALAMUS [DISINHIBITED]
    |
    | (+Glu)
    v
CORTEX (Motor area)
    |
MOVEMENT FACILITATED ✓

Dopamine from SNpc acts on D1 receptors
in striatum --> EXCITES direct pathway
CORTEX (+Glu)
    |
STRIATUM (D2 receptors)
    |
    | (-GABA)
    v
GPe [INHIBITED]
    |
    | Less (-GABA from GPe)
    v
STN [DISINHIBITED]
    |
    | (+Glu, excitatory)
    v
GPi/SNpr [EXCITED]
    |
    | More (-GABA output)
    v
THALAMUS [INHIBITED]
    |
MOVEMENT SUPPRESSED ✗

Dopamine from SNpc acts on D2 receptors
in striatum --> INHIBITS indirect pathway
(net effect: still facilitates movement)
| Feature | Direct Pathway | Indirect Pathway |
|---|---|---|
| Net effect | Facilitates movement | Suppresses movement |
| Striatal receptor | D1 | D2 |
| Dopamine effect | Excites | Inhibits (so less suppression) |
| Neurotransmitter | GABA/Substance P | GABA/Enkephalin |
| GPe involvement | No | Yes |
| STN involvement | No | Yes |
- SNpc degeneration → loss of dopamine
- Direct pathway underactive → less movement facilitation
- Indirect pathway overactive → more movement suppression
- Net result: Hypokinesia/bradykinesia, rigidity, tremor
- Degeneration of D2-receptor striatal neurons (indirect pathway neurons)
- Indirect pathway underactive → thalamus overactive
- Net result: Hyperkinesia (chorea, involuntary movements)
d) Physiological Functions of Basal Ganglia (3 Marks)
BASAL GANGLIA FUNCTIONS
         |
    _____|______________________________
    |           |          |           |
MOTOR        COGNITIVE   LIMBIC    OCULOMOTOR
    |           |          |           |
Movement    Planning   Motivation  Saccadic eye
initiation  & sequencing mood       movements
- Initiation and execution of voluntary movements
- Selection of appropriate motor programs (which movement to make)
- Suppression of unwanted/competing movements
- Regulation of muscle tone (especially in sustained postures)
- Control of automatic/learned movements (riding a bicycle, typing)
- Procedural learning (habit formation)
- Working memory for motor sequences
- Attention switching and cognitive flexibility
- Contributes to frontal lobe executive functions via frontal-subcortical circuits
- Reward processing and reinforcement learning
- Motivation and goal-directed behavior
- Emotional processing
- Regulation of saccadic eye movements (via SNpr → superior colliculus pathway)
| Disorder | Pathology | Clinical Features |
|---|---|---|
| Parkinson's disease | ↓ Dopamine (SNpc loss) | Bradykinesia, rigidity, resting tremor |
| Huntington's disease | Caudate/putamen (D2 neurons) | Chorea, dementia |
| Hemiballismus | STN lesion | Wild flinging movements |
| Wilson's disease | Copper deposition in striatum | Tremor, dysarthria |
Q2. Short Notes - Section B
a) MECHANISM AND SIGNIFICANCE OF REFERRED PAIN
VISCERAL PAIN PATHWAY:

Visceral organ (e.g., heart)
    |
Visceral afferent C-fibers
    |
    v
DORSAL HORN of spinal cord (e.g., T1-T4)
    |
    |<-- CONVERGENCE with somatic afferents
    |    from skin of chest/arm/jaw (same segment)
    v
SPINOTHALAMIC TRACT
    |
    v
THALAMUS
    |
    v
SOMATOSENSORY CORTEX
    |
    v
Brain "projects" pain to skin area
(because brain is accustomed to somatic pain
from that dermatome, not visceral pain)
    |
    v
PAIN FELT IN ARM/CHEST WALL/JAW
| Organ | Referred Pain Site | Spinal Level |
|---|---|---|
| Heart (MI) | Left arm, jaw, neck | C8-T4 |
| Diaphragm | Shoulder (C4 - phrenic nerve) | C3-C5 |
| Appendix | Periumbilical region | T10 |
| Gallbladder | Right shoulder tip | T7-T9 |
| Kidney/ureter | Groin, scrotum, labia | T10-L1 |
| Peptic ulcer | Back, epigastrium | T6-T8 |
- Diagnostic value - helps identify diseased visceral organs (e.g., left arm pain → suspect MI)
- Explains delay in diagnosis - pain in a seemingly unrelated area may mislead clinician
- Understanding pain pathways in neurophysiology
- Guiding nerve blocks - targeting dorsal horn levels for visceral pain control
b) FUNCTIONS OF CEREBELLUM
CEREBELLUM
     |
_____|__________________________
|              |               |
VESTIBULOCERE-  SPINOCERE-    CEREBROCERE-
BELLUM         BELLUM         BELLUM
(Archicerebellum) (Paleocerebellum) (Neocerebellum)
     |              |               |
Flocculonodular  Vermis +        Lateral
lobe            Intermediate     hemispheres
     |           zones            |
Balance &        |             Fine motor
vestibular      Muscle tone     control
equilibrium     Posture         Coordination
                Gait            Planning of
                Proprioception  movement
-
Coordination of voluntary movement
- Ensures smooth, accurate movements
- Prevents intention tremor and dysmetria
- Times and sequences muscle contractions
-
Maintenance of muscle tone
- Facilitates extensor tone through reticulospinal pathways
- Lesion → hypotonia
-
Balance and equilibrium
- Flocculonodular lobe + vestibular nuclei
- Maintains upright posture
-
Motor learning
- Long-term modification of motor patterns
- Learning skilled movements (e.g., learning to ride a bicycle)
-
Gait control
- Coordinates leg movements during walking
-
Eye movement control
- Smooth pursuit and fixation
- Prevents nystagmus (vestibulocerebellum)
- Dysmetria (past-pointing)
- Ataxia (gait)
- Nystagmus
- Intention tremor
- Scanning/slurred speech (dysarthria)
- Hypotonia
c) LIGHT AND DARK ADAPTATION
DARK ADAPTATION:
Bright light --> Dim/Dark environment

Initial response (0-7 minutes): Cone adaptation
- Cones regenerate cone photopigments
- Threshold decreases relatively quickly
- Limited sensitivity gain

Later response (7-40 minutes): Rod adaptation
- Rods regenerate rhodopsin slowly
- Rhodopsin = opsin + 11-cis retinal (from Vitamin A)
- Greater sensitivity gain (100,000x more sensitive than cones)

RHODOPSIN CYCLE:
Light
  |
Rhodopsin (purple) --> All-trans retinal + Opsin
                              |
                         [Reduced to
                          all-trans retinol]
                              |
                        [Converted back to
                         11-cis retinal]
                              |
                         + Opsin
                              |
                         Rhodopsin (regenerated)
                         (takes ~30-40 min)
LIGHT ADAPTATION:
Dark --> Bright light

PHOTOPIGMENT BLEACHING:
- Rhodopsin rapidly bleached by intense light
- Cones (less sensitive) take over from rods
- Pupils constrict (pupillary light reflex)
- Neural adaptation: retinal ganglion cell responsiveness decreases
- Very fast (seconds to minutes)
- Night blindness (Nyctalopia): Impaired dark adaptation; caused by Vitamin A deficiency (rhodopsin cannot regenerate) or retinitis pigmentosa
- Fully dark-adapted eye is 100,000x more sensitive than fully light-adapted eye
- Rod-free fovea means poorest vision in very low light (look slightly off-center in dark)
d) CARDIOVASCULAR CHANGES DURING EXERCISE AND THEIR MECHANISMS
REST          MODERATE EXERCISE      MAXIMAL EXERCISE
HR: 70/min  → 150/min             → 200/min
CO: 5 L/min → 15-20 L/min         → 25-30 L/min
BP(sys): 120 → 160-180             → 200 mmHg
BP(dia): 80 → 75-80 (stays low)   → 90 mmHg
SVR: Normal → Decreases markedly
O2 consumption: 250ml/min → 3-4 L/min
- Withdrawal of vagal tone (immediate)
- Sympathetic activation (SNS)
- Circulating catecholamines (epinephrine)
- Intrinsic cardiac response
- Increased venous return (Frank-Starling mechanism)
- Increased cardiac contractility (inotropic effect of SNS)
- More complete ventricular emptying
AT REST:                AT EXERCISE:
Muscle: 15-20%    →    Muscle: 80-85% of CO
Gut: 25%          →    Gut: 3-4%
Skin: 5%          →    Skin: 12% (heat dissipation)
Heart: 5%         →    Heart: 4-5% (more absolute)
Brain: 14%        →    Brain: 3-4% (maintained)
- Metabolic vasodilation in exercising muscles (CO2, H+, K+, adenosine)
- Contrasts with vasoconstriction in inactive tissues (SNS)
- Increases 4-6 fold in trained athletes
- Systolic rises (increased SV and HR)
- Diastolic barely rises (vasodilation reduces resistance)
- Enhanced venous return (respiratory pump effect)
- Bradycardia at rest (increased vagal tone)
- Increased SV (cardiac hypertrophy/dilatation)
- Increased maximum VO2 (aerobic capacity)
e) RIGHTS OF A PATIENT AND DUTIES OF A DOCTOR
RIGHTS OF A PATIENT:
PATIENT RIGHTS
       |
_______|_______________________________________________
|          |           |           |         |        |
RIGHT TO  RIGHT TO   RIGHT TO   RIGHT TO  RIGHT TO RIGHT TO
INFORMED  PRIVACY &  REFUSE     SECOND   DIGNIFIED KNOW
CONSENT   CONFIDEN-  TREATMENT  OPINION  CARE     DIAGNOSIS
          TIALITY                        & RESPECT & PROGNOSIS
-
Right to Informed Consent
- Must be told about diagnosis, nature of treatment, risks, benefits, alternatives
- Consent must be voluntary, competent, and informed
- Exception: Emergency when patient is unconscious
-
Right to Privacy and Confidentiality
- Medical information kept confidential
- Examination in private
- Exceptions: notifiable diseases, court orders, public safety
-
Right to Refuse Treatment
- Competent adult can refuse any treatment
- Must be documented with a waiver
-
Right to Second Opinion
- Can seek another doctor's opinion
-
Right to Dignified Care
- Treated with respect regardless of caste, religion, gender, economic status
-
Right to Information
- Access to medical records
- Right to know diagnosis and prognosis
-
Right to Continuity of Care
- Treatment not abandoned without notice
-
Right to Emergency Care
- Cannot be denied emergency treatment
DUTIES OF A DOCTOR (Medical Ethics - Four Pillars):
FOUR PRINCIPLES (Beauchamp & Childress)
              |
   ___________|___________
   |           |     |   |
AUTONOMY  BENEFICENCE  NON-    JUSTICE
           |         MALEFICENCE   |
   Respect  Do good   Do no harm   Fair
   patient  for                   distribution
   decisions patient               of care
-
Duty of Care - Once doctor-patient relationship established, duty to provide reasonable care
-
Non-abandonment - Cannot abandon a patient without arranging appropriate care
-
Competence - Maintain adequate medical knowledge and skills; refer when beyond expertise
-
Confidentiality - Maintain patient privacy (except legally required disclosures)
-
Informed Consent - Explain procedures, risks, and alternatives; obtain valid consent
-
Non-maleficence - "First, do no harm" (Primum non nocere)
-
Beneficence - Act in the best interest of the patient
-
Justice - Treat all patients fairly and equitably
-
Honesty and Transparency - Disclose errors; provide truthful information
-
Documentation - Maintain accurate medical records
-
Referral - Refer to specialist when needed without delay
-
Continuing Medical Education - Keep knowledge updated
Sources: Ganong's Review of Medical Physiology (26th Ed.), Costanzo Physiology (7th Ed.), Kandel's Principles of Neural Science (6th Ed.) - Ganong's Review of Medical Physiology, pp. 370-371; Costanzo Physiology, pp. 469-470