
Peripheral resistance
Reading File
Peripheral resistance is the resistance to blood flow offered by the systemic circulation, primarily determined by arteriolar tone. Now let me pull detailed content from the medical library.
Searching sources...
Finding Sources
Finding Sources
Reading File
Reading File
Finding Sources
Finding Sources
Finding Sources
Reading File
Reading File
Loading Image
Finding Sources
I now have enough to give a thorough, well-structured answer.
Peripheral Resistance
Definition
Total peripheral resistance (TPR), also called systemic vascular resistance (SVR), is the sum of all resistance to blood flow offered by the systemic (peripheral) circulation. It is expressed mathematically using the hydraulic equivalent of Ohm's law:
R = ΔP / F
Where ΔP is the pressure difference across the circuit (mean arterial pressure minus right atrial pressure) and F is cardiac output. The units are peripheral resistance units (PRUs) - mmHg/(mL/s).
Blood pressure is therefore:
Blood Pressure = Cardiac Output × Total Peripheral Resistance
Anatomical Basis - Where Does Resistance Arise?
Resistance resides overwhelmingly in the arterioles - the small muscular vessels (20-100 µm diameter) just upstream of capillary beds. Large arteries and veins contribute negligible resistance under normal conditions. Contraction of smooth muscle in arteriolar walls raises resistance; relaxation lowers it. - Medical Physiology, p. 824-828; Robbins & Kumar Basic Pathology, p. 309
Determinants: Poiseuille's Law
For a cylindrical tube, resistance follows Poiseuille's equation:
R = (8ηl) / (πr⁴)
Where:
- η = blood viscosity
- l = vessel length
- r = vessel radius
Three key implications:
- Resistance is proportional to vessel length (fixed in physiology)
- Resistance is proportional to blood viscosity (e.g., rises in polycythaemia)
- Resistance is inversely proportional to the 4th power of radius - this is the dominant, physiologically regulated factor. Halving vessel radius increases resistance 16-fold.
- Medical Physiology, p. 811-835
Regulation of Peripheral Resistance
Peripheral resistance is tightly regulated at the arteriolar level by three overlapping systems:
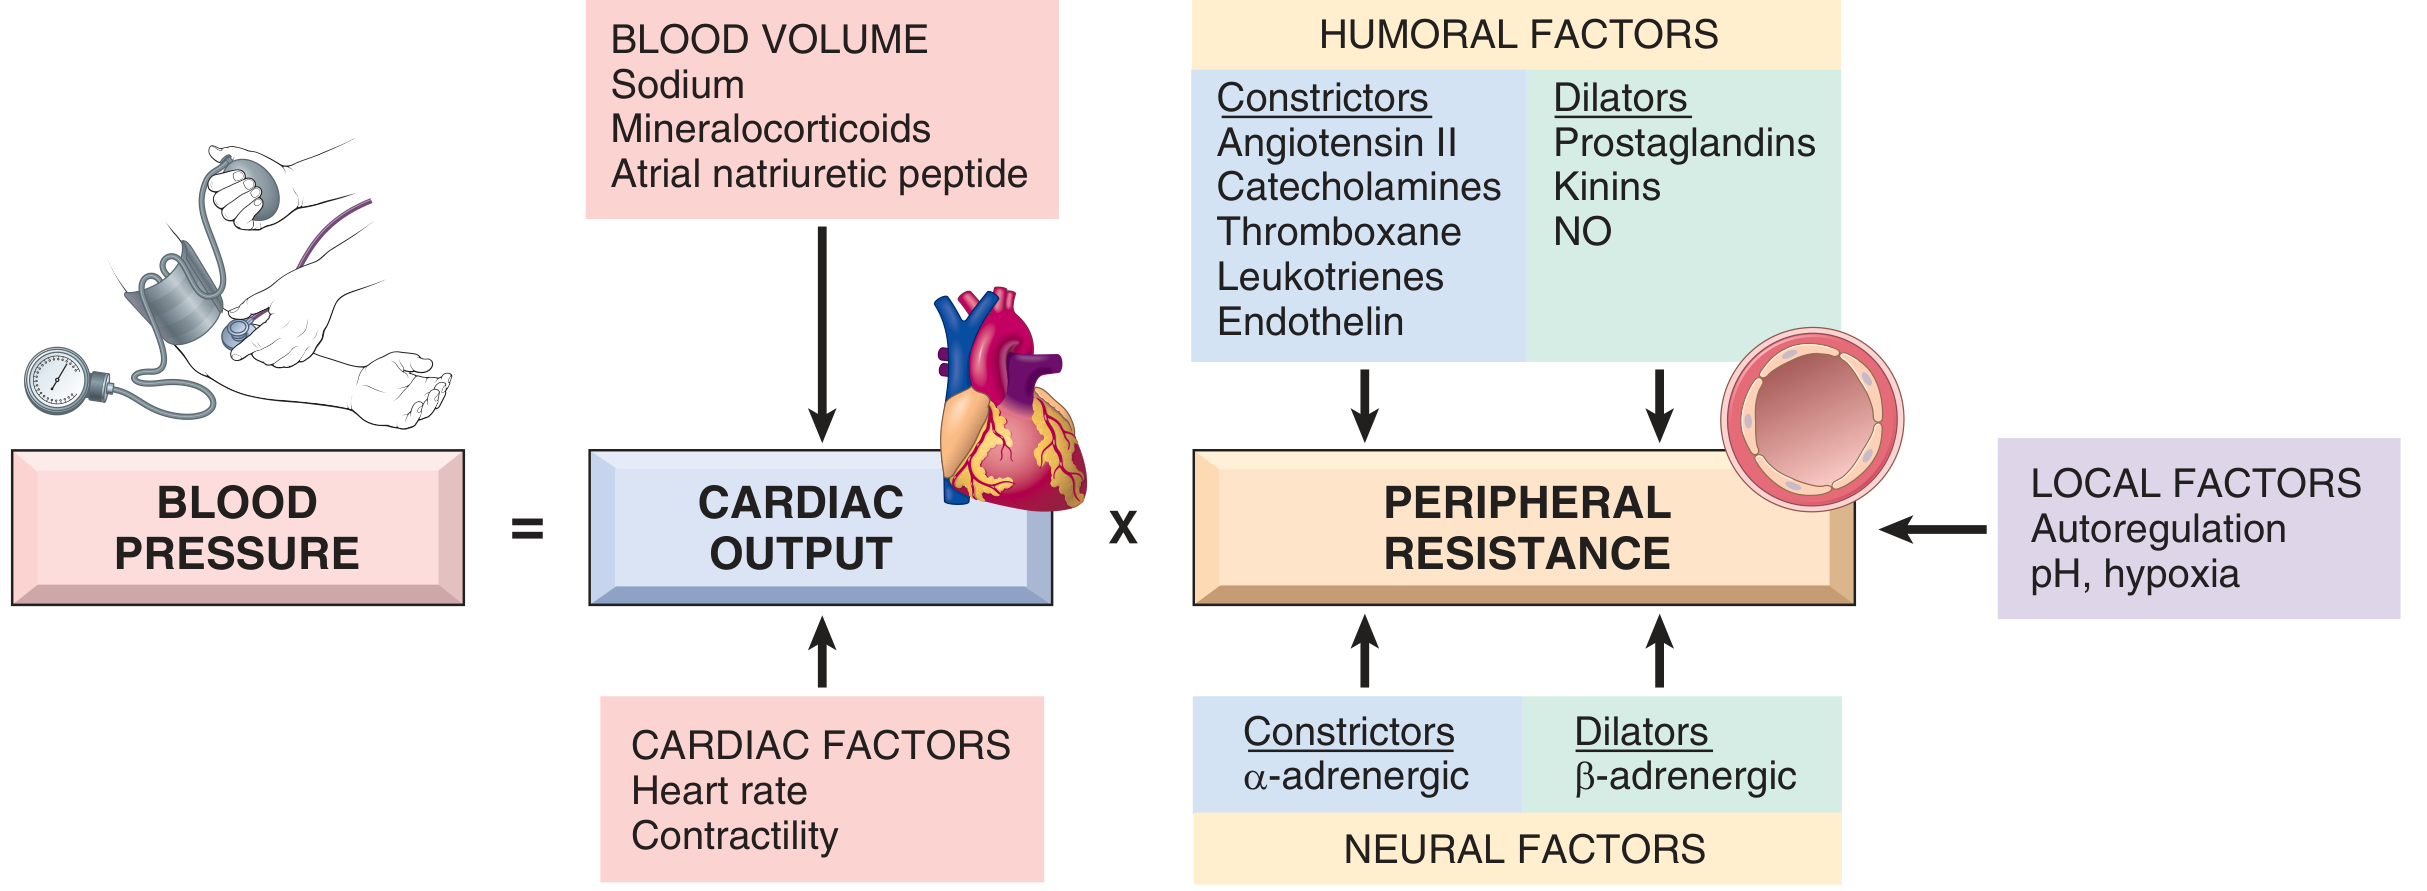
Fig. 8.2 Blood pressure = Cardiac Output × Peripheral Resistance, with key regulators. (Robbins & Kumar Basic Pathology)
1. Neural Factors
- Sympathetic (α-adrenergic) activation → vasoconstriction → ↑ TPR → ↑ blood pressure
- β-adrenergic activation → vasodilation → ↓ TPR
- The medullary vasomotor centre controls sympathetic outflow to arterioles. In haemorrhage, reflex sympathetic activation increases TPR to sustain arterial pressure. - Costanzo Physiology, p. 168
- Centrally acting α2-agonists (e.g., clonidine) decrease sympathetic outflow, reducing TPR and blood pressure. - Lippincott Pharmacology, p. 4350
2. Humoral Factors
| Vasoconstrictors (↑ TPR) | Vasodilators (↓ TPR) |
|---|---|
| Angiotensin II | Nitric oxide (NO) |
| Catecholamines | Kinins (bradykinin) |
| Endothelin | Prostaglandins |
| Thromboxane A₂ | Adenosine, CO₂ |
| Leukotrienes | Atrial natriuretic peptide |
Angiotensin II acts on blood vessels both directly and indirectly to increase resistance. - Goodman & Gilman's, p. 3155
3. Local / Autoregulatory Factors
- Autoregulation: increased blood flow triggers vasoconstriction to protect tissues from hyperperfusion
- Metabolic vasodilation: low pH, hypoxia, elevated CO₂, and adenosine cause local arteriolar dilation, reducing local resistance to match perfusion to metabolic need
- Robbins & Kumar Basic Pathology, p. 309
Haemodynamic Effects of TPR Changes
From Costanzo Physiology (p. 168-169):
↑ TPR (arteriolar constriction):
- "Holds" blood in arteries → ↑ arterial pressure
- ↑ afterload → ↓ cardiac output
- Cardiac function curve shifts down; vascular function curve rotates counter-clockwise
- Net: ↑ arterial pressure, ↓ cardiac output, ↓ venous return
↓ TPR (arteriolar dilation):
- Blood flows out of arteries faster → ↓ arterial pressure
- ↓ afterload → ↑ cardiac output
- Cardiac function curve shifts up; vascular function curve rotates clockwise
- Net: ↓ arterial pressure, ↑ cardiac output, ↑ venous return
Relationship to Hypertension
Hypertension is characterised by:
- Early phase: elevated cardiac output (often due to fluid/volume expansion)
- Established phase: near-normal cardiac output with markedly elevated TPR (the dominant chronic mechanism)
Importantly, Guyton's model shows that an increase in TPR alone cannot sustain long-term hypertension unless it is accompanied by a change in renal function (i.e., a rightward shift in the pressure-natriuresis curve). Without altered renal handling, autoregulation ultimately restores blood pressure to normal. - Guyton and Hall Medical Physiology, p. 3988-3993
In volume-loading hypertension (e.g., reduced kidney mass + high salt intake), the sequence is:
- ↑ blood/extracellular fluid volume
- ↑ cardiac output
- Peripheral autoregulation → ↑ TPR
- Cardiac output returns toward normal, but blood pressure remains elevated - Guyton and Hall, p. 4149-4162
Clinical Relevance
| Condition | TPR | Mechanism |
|---|---|---|
| Essential hypertension | ↑ | Increased arteriolar tone |
| Haemorrhagic shock (compensated) | ↑ | Sympathetic vasoconstriction |
| Septic shock | ↓↓ | Massive vasodilation (NO, inflammatory mediators) |
| Exercise (active muscles) | ↓ | Local metabolic vasodilation |
| Heart failure | ↑ | Compensatory sympathetic and RAAS activation |
| Polycythaemia | ↑ | ↑ viscosity |
Summary: Peripheral resistance is primarily set by arteriolar smooth muscle tone, governed by the 4th-power relationship with radius (Poiseuille). Neural (sympathetic), humoral (Ang II, NO, endothelin), and local (autoregulation, metabolic) factors continuously adjust resistance. TPR is one of the two major determinants of blood pressure alongside cardiac output, and its dysregulation is central to the pathophysiology of hypertension and circulatory shock.
This is a shared conversation. Sign in to Orris to start your own chat.