
Drug response curve
I'll cover drug response curves from the medical library. Let me retrieve the relevant content.
Reading File
Now let me search the library for drug response curve content in parallel:
Finding Sources
Finding Sources
Finding Sources
Finding Sources
Good hits. Let me read the key sections from both Katzung and Lippincott in parallel:
Reading File
Reading File
Excellent content. Let me now fetch the key diagrams and read the quantal dose-response section:
Loading Image
Loading Image
Reading File
Now let me get the quantal dose-response and therapeutic index sections:
Reading File
Reading File
Now let me fetch the quantal curve image and the potency/efficacy comparison figure, plus get the therapeutic index content:
Loading Image
Loading Image
Reading File
I now have comprehensive content from both Katzung and Lippincott textbooks with all the key diagrams. Here is the full response:
Drug Response Curves
A drug response curve (dose-response curve) is a graphical representation of the relationship between the dose (or concentration) of a drug and the magnitude of its pharmacological effect. There are two main types: graded and quantal.
1. Graded Dose-Response Curve
As the concentration of a drug increases, its pharmacological effect gradually increases until all receptors are occupied (the maximum effect, Emax). When plotted on a linear scale, the curve is hyperbolic; on a semi-logarithmic scale (log dose on x-axis), it becomes the classic sigmoidal (S-shaped) curve, which is easier to interpret across a wide range of doses.
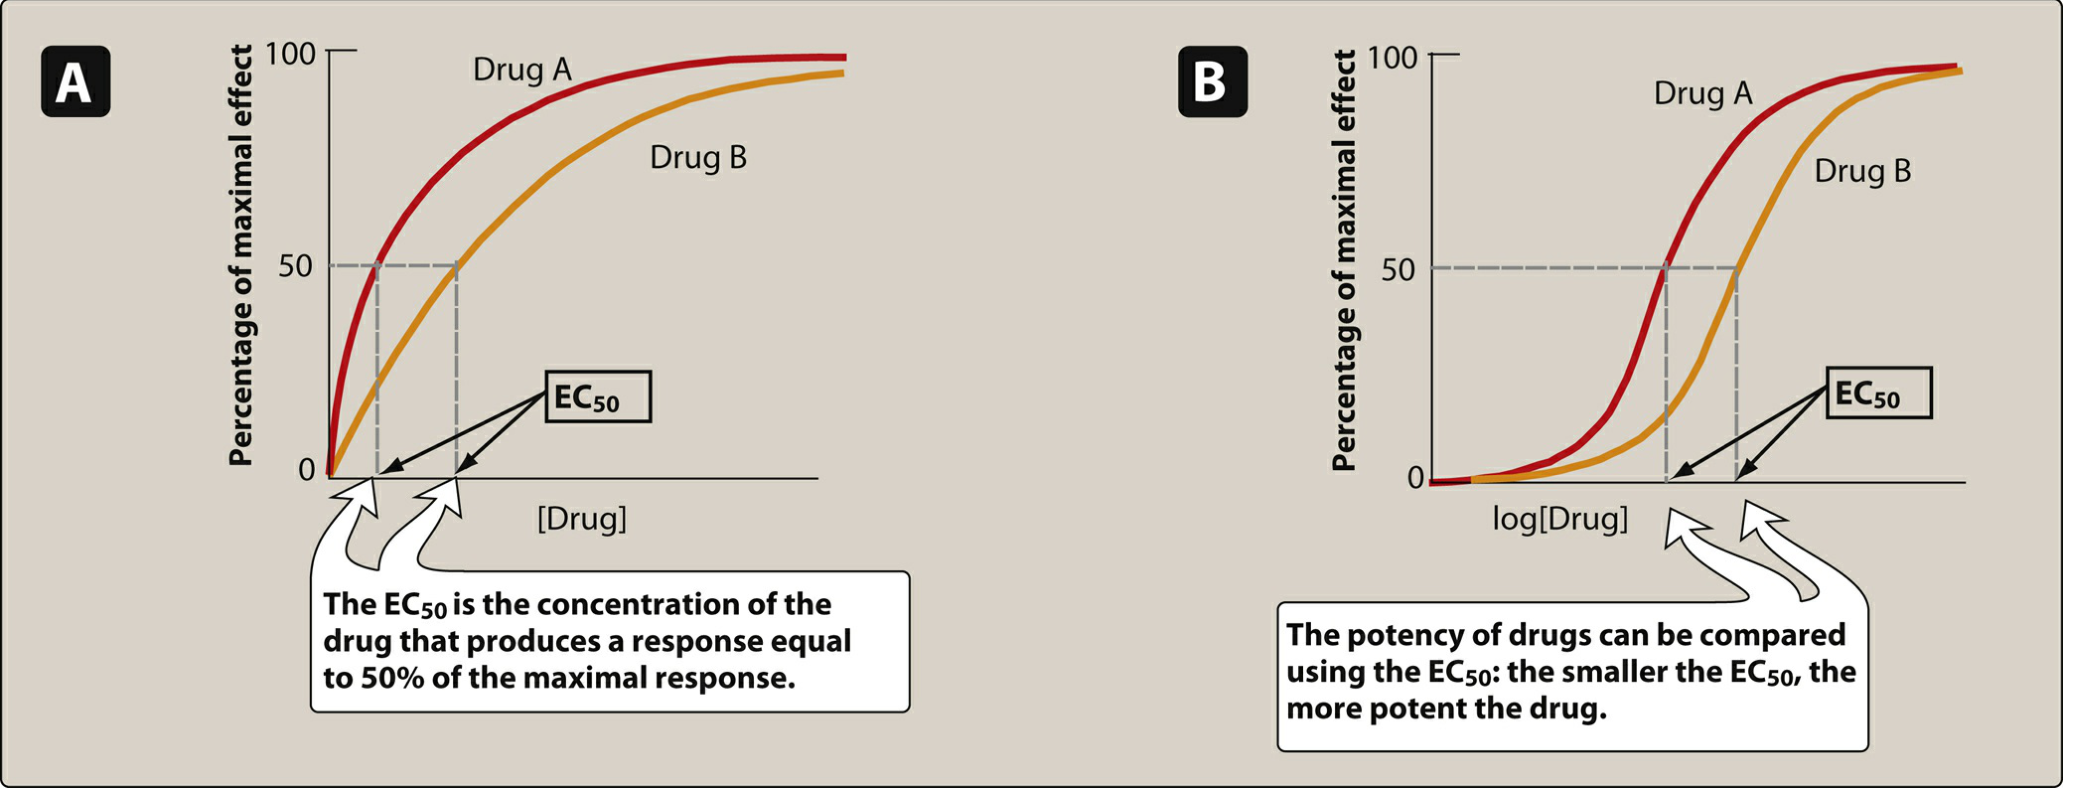
Figure: Panel A = linear plot; Panel B = semi-log (sigmoidal) plot. Drug A has a lower EC50 than Drug B, so Drug A is more potent. - Lippincott Illustrated Reviews: Pharmacology, p. 95
Key Parameters from the Graded Curve
A. Potency
- Potency is a measure of how much drug is needed to produce a given effect.
- Quantified by the EC50 (effective concentration producing 50% of maximal response) or ED50 (effective dose).
- A smaller EC50 = more potent drug (curve shifted to the left).
- Potency depends on receptor affinity (K
a) and efficiency of receptor coupling to the response. - Clinically, potency matters for dosing (e.g., candesartan is dosed at 4-32 mg while irbesartan requires 75-300 mg for the same antihypertensive effect - candesartan is more potent).
B. Maximal Efficacy (Emax)
- The ceiling effect - the maximum response a drug can produce regardless of dose.
- Determined by the drug's intrinsic activity (ability to activate the receptor after binding).
- Reflects the limit of the dose-response curve on the response axis.
- Clinically more important than potency: morphine has greater efficacy than naproxen and can treat severe cancer pain, whereas naproxen cannot - even though both may be equipotent for mild pain.
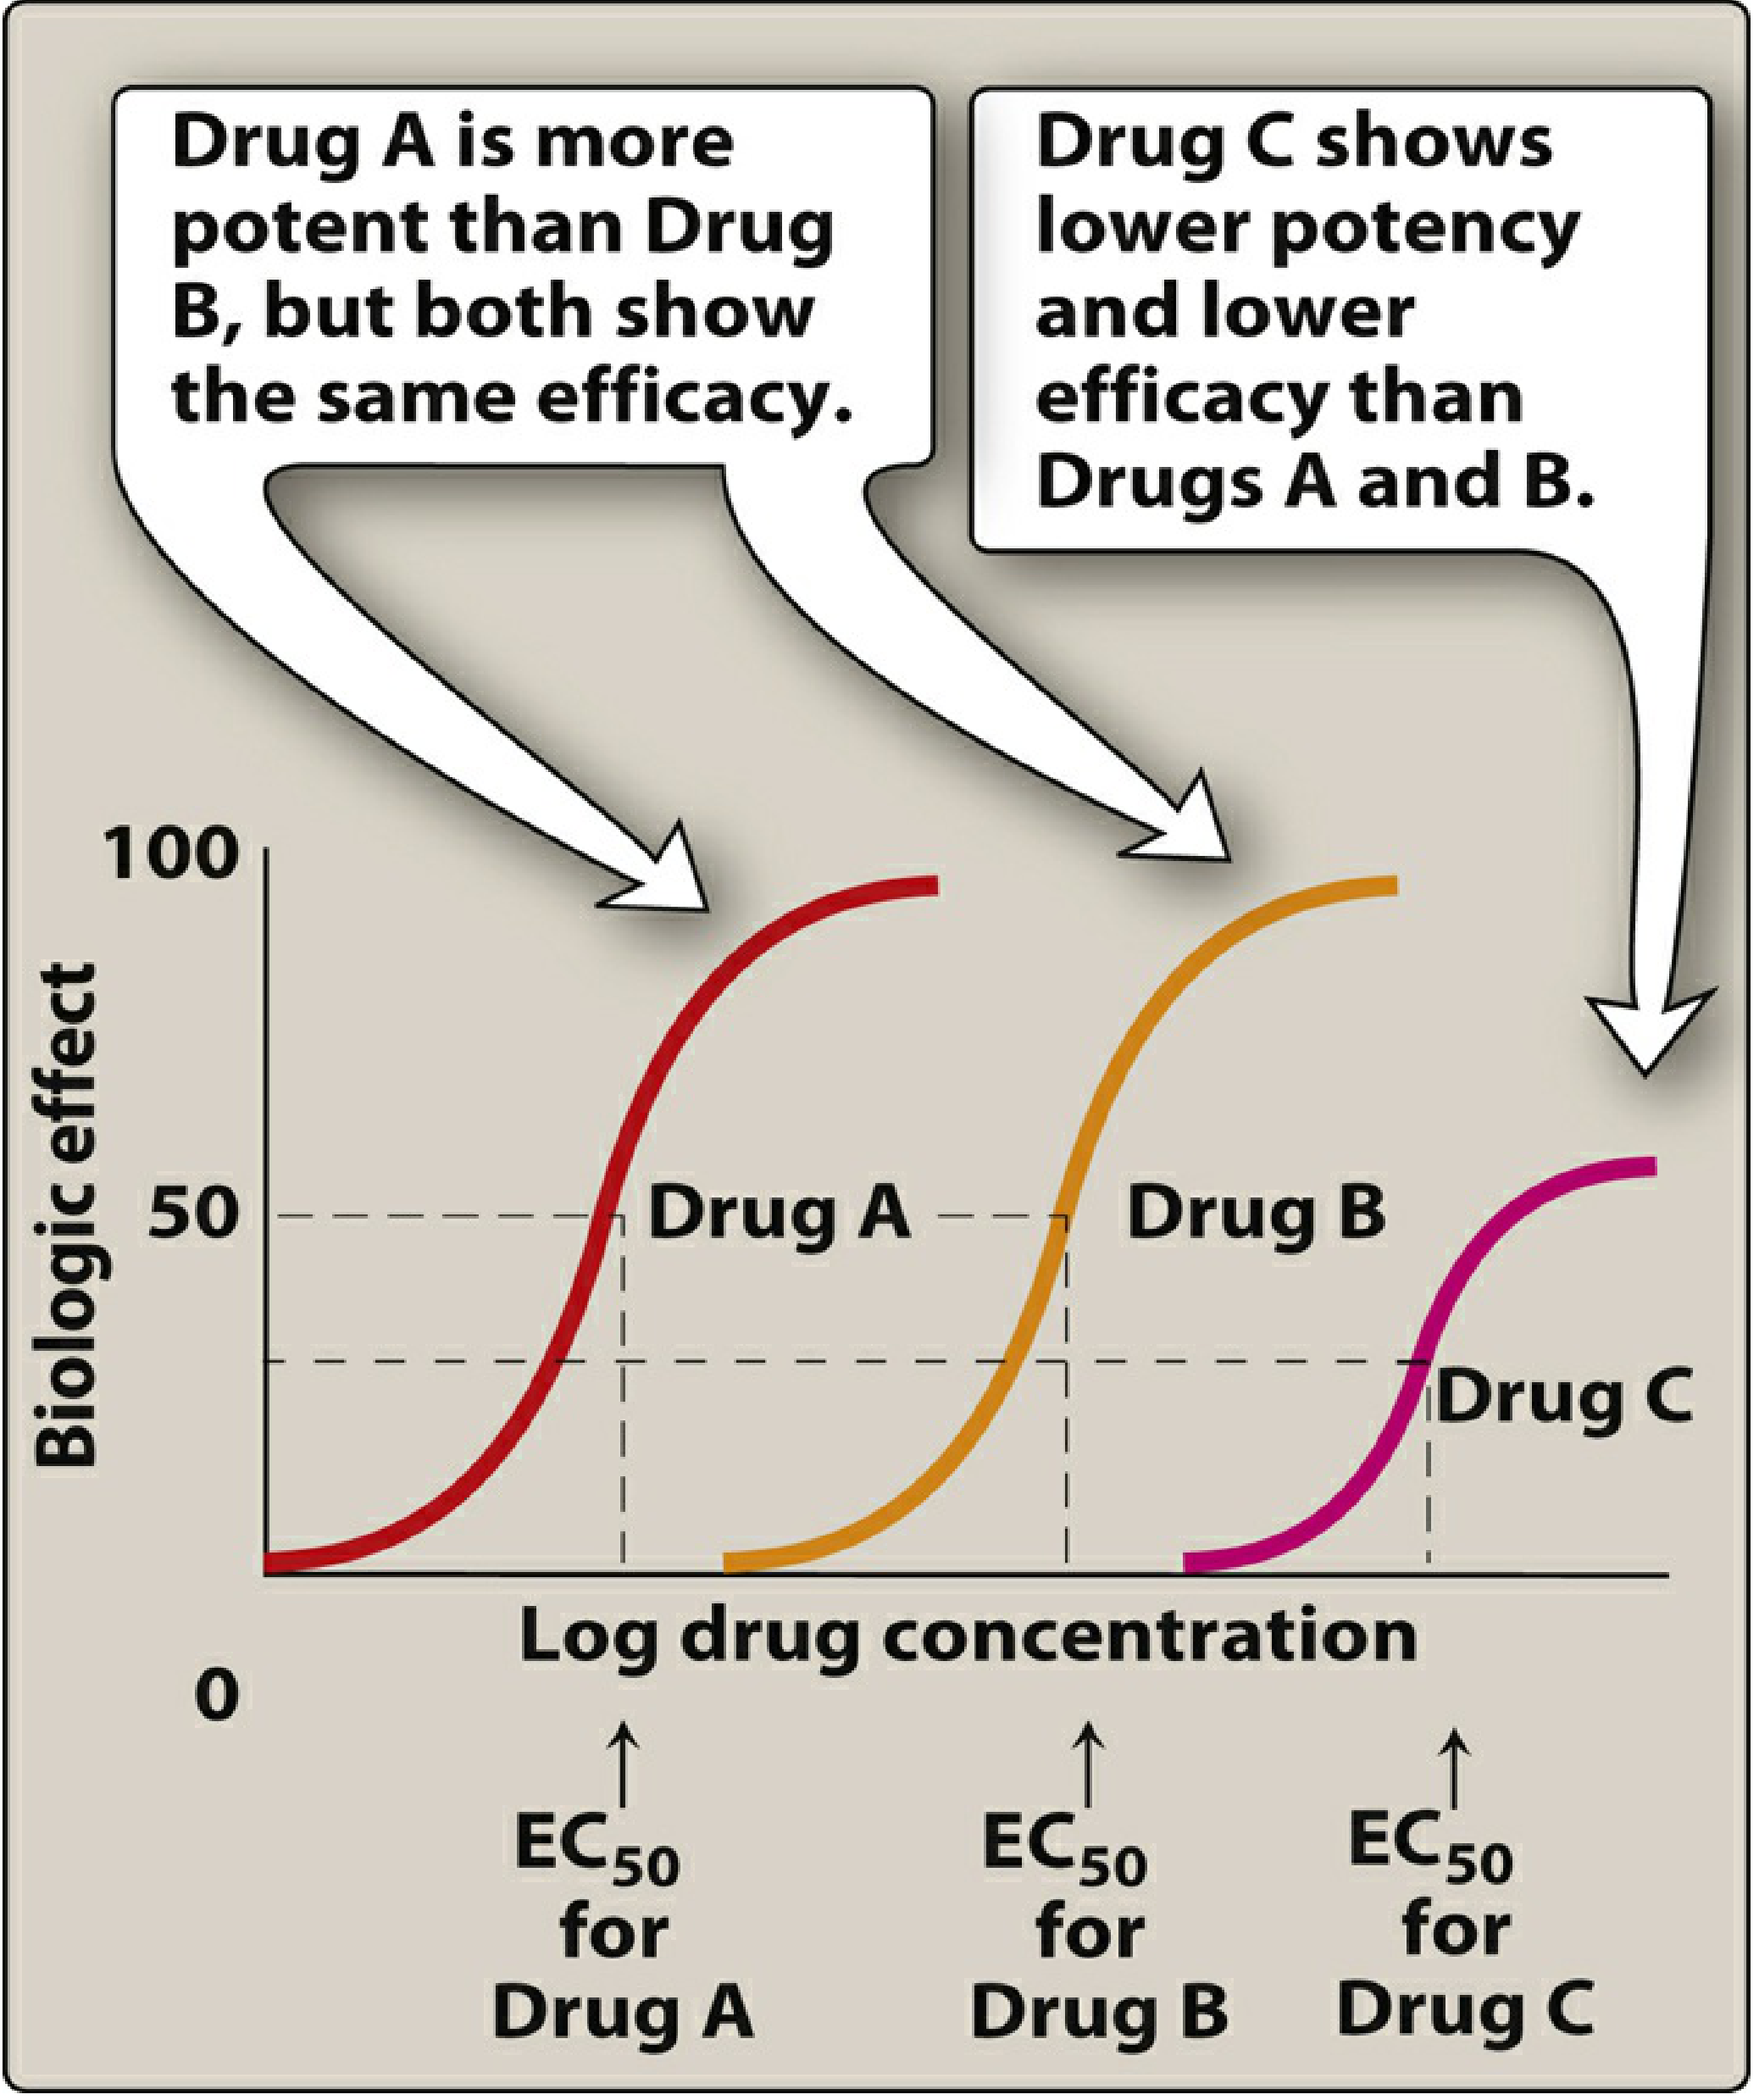
Figure: Drug A is more potent than B (left-shifted EC50) but both have the same Emax. Drug C has both lower potency and lower efficacy. - Lippincott Illustrated Reviews: Pharmacology, p. 96-97
Graded Curves and Drug Types
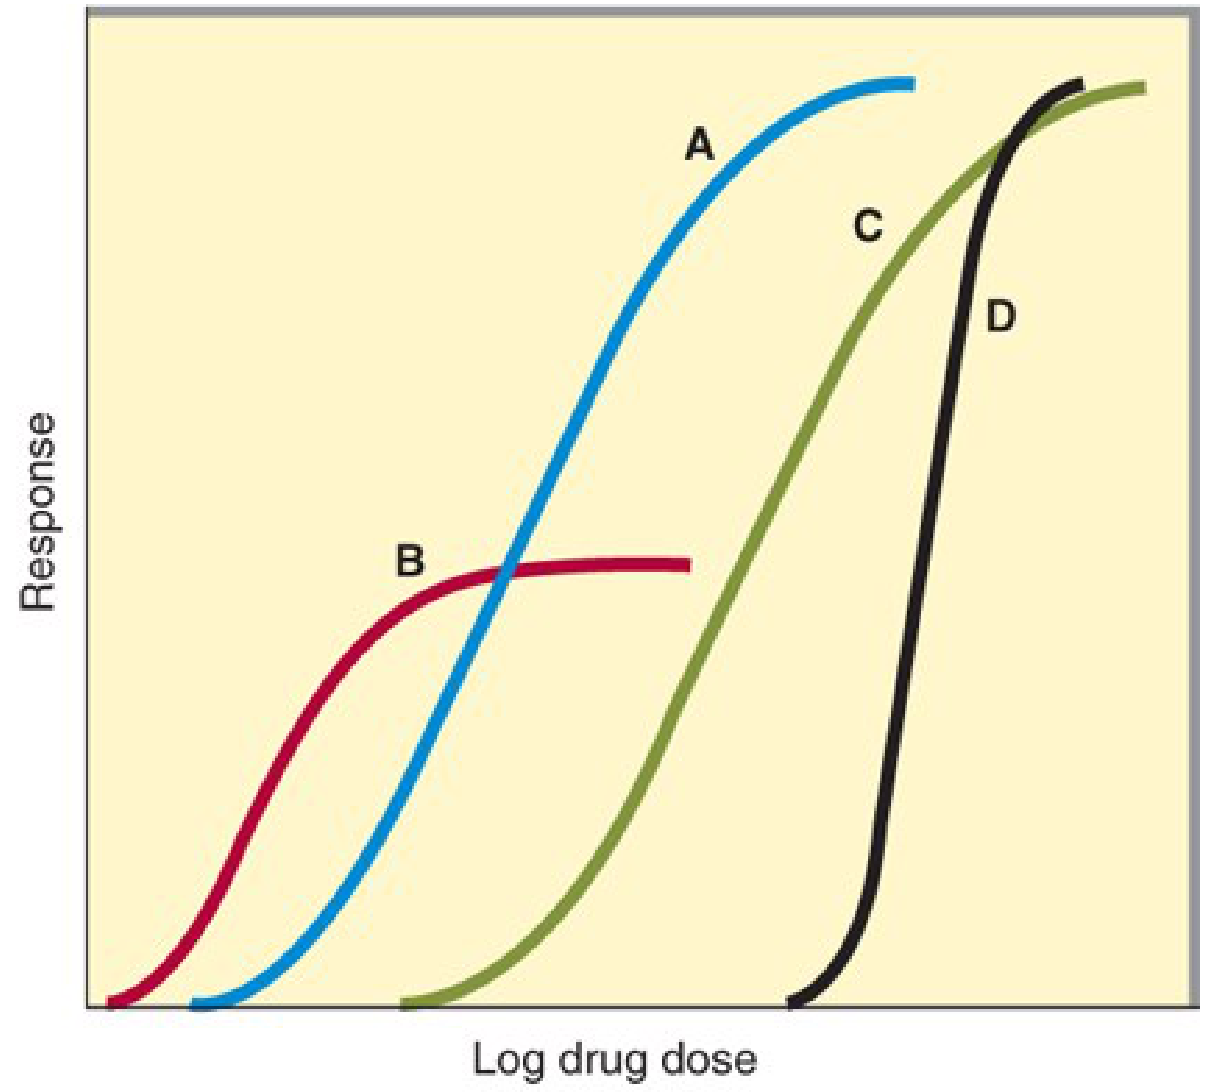
Figure: Drugs A, C, D = equal maximal efficacy (full agonists). Drug B = lower Emax (partial agonist). Drugs B > A in potency (lower EC50), but Drug A achieves higher response at high doses. Curve D = steep slope (clinical danger if upper portion = toxicity). - Katzung's Basic & Clinical Pharmacology, p. 64
| Drug Type | Intrinsic Activity | Emax | EC50 / Position |
|---|---|---|---|
| Full agonist | = 1 | Same as endogenous ligand | Variable |
| Partial agonist | 0 < α < 1 | Lower than full agonist | May be lower (more potent) |
| Antagonist | 0 | Zero (blocks, no activation) | - |
| Inverse agonist | Negative | Suppresses below baseline | - |
Important distinction:
- A drug can be more potent but less efficacious than another (e.g., Drug B vs Drug A above).
- A drug with greater efficacy is clinically more useful when a strong effect is needed.
Slope of the Curve
Extremely steep curves (like curve D in the Katzung figure) have major clinical implications. A small dose increment can push the response from therapeutic to toxic (e.g., sedative-hypnotics causing coma). Steep slopes can result from cooperative interactions across multiple systems (e.g., a drug simultaneously affecting brain, heart, and vessels to lower blood pressure). - Katzung's Basic & Clinical Pharmacology, p. 65
2. Quantal Dose-Effect Curve
Used when the response is all-or-nothing (quantal) - e.g., prevention of seizures, arrhythmia, or death. Rather than measuring intensity of effect in one individual, quantal curves measure the fraction of a population that responds to a given dose.
Constructed by:
- Determining the dose needed to produce a specified effect in each individual
- Plotting cumulative % of responders vs. log dose
- The resulting curve is sigmoidal (cumulative frequency distribution)
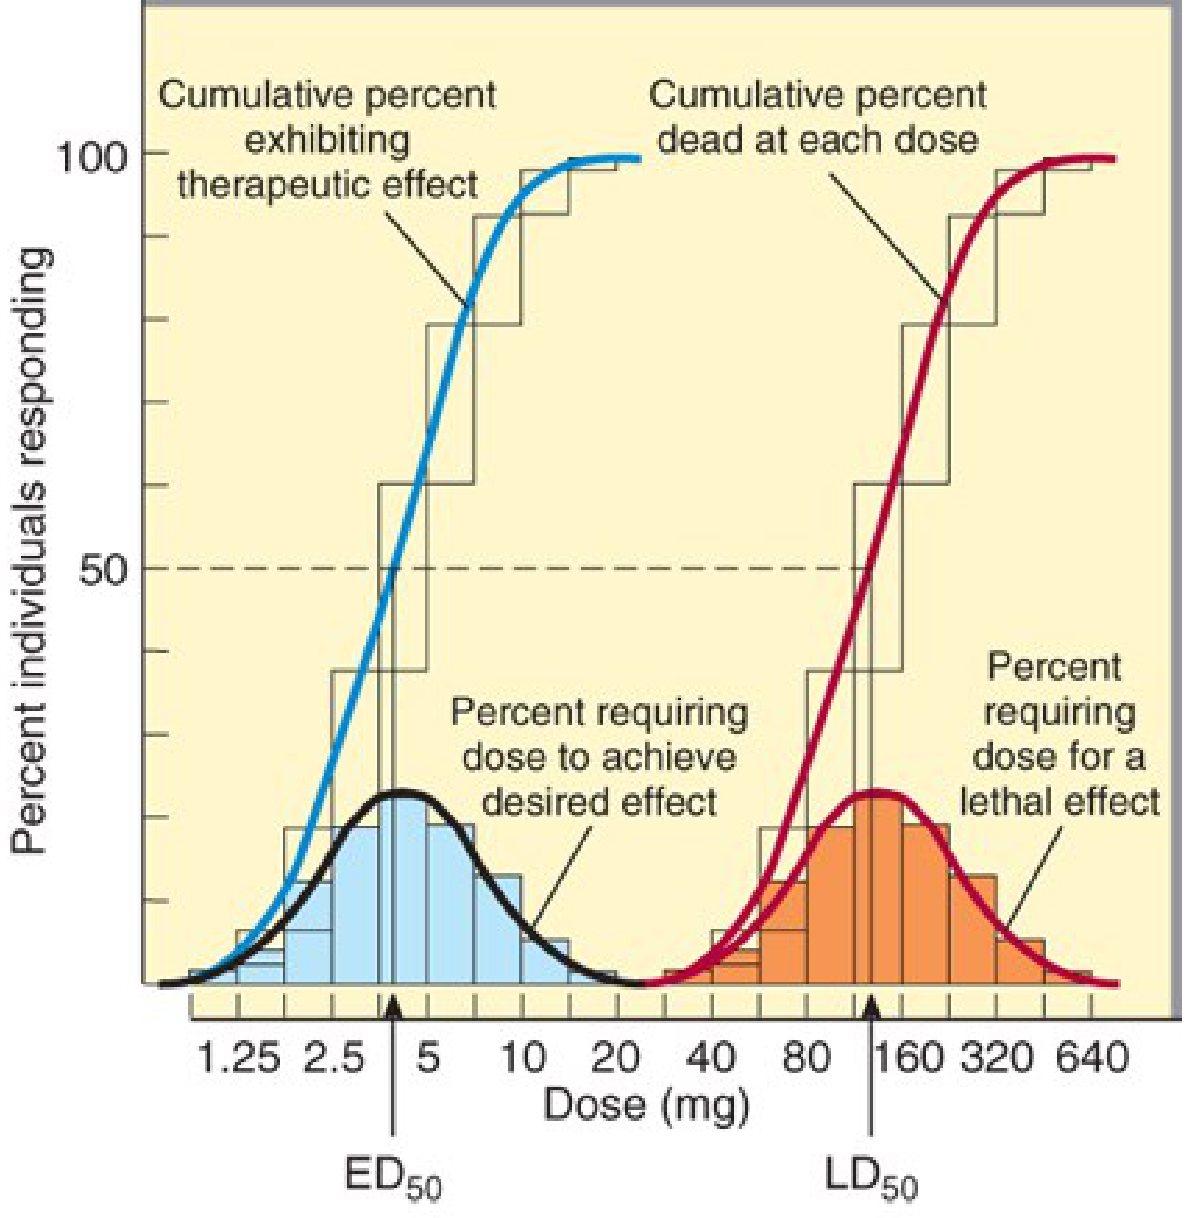
Figure: Blue curve = cumulative therapeutic responders; Red curve = cumulative lethal effect. ED50 = ~5 mg; LD50 = ~160 mg. The wide separation = wide therapeutic index. - Katzung's Basic & Clinical Pharmacology, p. 65-66
Key Parameters from the Quantal Curve
| Parameter | Definition |
|---|---|
| ED50 | Dose at which 50% of the population exhibits the desired effect |
| TD50 | Dose at which 50% exhibit a specified toxic effect |
| LD50 | Dose lethal to 50% (animal studies) |
| Therapeutic Index (TI) | TI = LD50 / ED50 (animal) or TD50 / ED50 |
| Therapeutic Window | Range between minimum toxic dose and minimum effective dose |
A high TI = wide safety margin (e.g., penicillin). A low TI = narrow margin requiring monitoring (e.g., digoxin, warfarin, lithium, aminoglycosides).
Note: The slopes of the dose-response curves matter. Even if ED50 and LD50 are well-separated, if the upper tail of the therapeutic curve overlaps the lower tail of the lethal curve, some patients at therapeutic doses may experience toxicity. - Goodman & Gilman's Pharmacological Basis of Therapeutics
3. Graded vs Quantal: Key Comparison
| Feature | Graded | Quantal |
|---|---|---|
| Measured in | One individual or preparation | A population |
| Response type | Continuous (intensity) | All-or-nothing (yes/no) |
| X-axis | Log dose / concentration | Log dose |
| Y-axis | % maximal effect | % individuals responding |
| Key parameters | EC50, Emax, potency, efficacy | ED50, LD50, therapeutic index |
| What it shows | Potency + maximal efficacy | Population variability + safety margin |
4. Receptor Occupancy and the Hill Equation
The relationship between drug concentration and receptor binding follows the law of mass action:
Drug + Receptor ⇌ Drug-Receptor Complex → Biological Effect
The fraction of occupied receptors is:
[DR]/[R_total] = [D] / (K_d + [D])
Where K_d = equilibrium dissociation constant. A lower K_d = higher affinity. The Hill-Langmuir equation extends this to describe the dose-response relationship mathematically (the basis for the sigmoidal curve). - Lippincott Illustrated Reviews: Pharmacology, p. 99-100
5. Variation in Drug Responsiveness
Individuals vary considerably in their response to the same drug due to:
- Hyporeactivity / hyperreactivity - reduced or increased response compared to most individuals
- Tolerance - diminishing response with continued use (e.g., opioids, nitrates)
- Tachyphylaxis - rapid tolerance after just a few doses
- Idiosyncratic responses - genetic polymorphisms in drug metabolism (e.g., CYP450 variants) or immunologic reactions
- Age, sex, body size, comorbid disease states, and drug-drug interactions
These factors explain why the quantal curve shows a bell-shaped frequency distribution (Gaussian) around the ED50 rather than a sharp threshold. - Katzung's Basic & Clinical Pharmacology, p. 66
Sources:
- Lippincott Illustrated Reviews: Pharmacology, Chapter 2, pp. 95-100
- Katzung's Basic & Clinical Pharmacology, 16th Ed., Chapter 2, pp. 64-66
- Goodman & Gilman's Pharmacological Basis of Therapeutics, Introduction
This is a shared conversation. Sign in to Orris to start your own chat.